 Open Access Article
An ordered mesoporous carbon–silica hybrid for the detection of the antiviral drug ribavirin in clinical samples†
Amir Hosein
Ali Naghian
a,
Zahra
Hashemi
a,
Fereshteh
Chekin
 *b and
Na'il
Saleh
 *c
*c
aDepartment of Pharmacy, Ayatollah Amoli Branch, Islamic Azad University, Amol, Iran
bDepartment of Chemistry, Ayatollah Amoli Branch, Islamic Azad University, Amol, Iran. E-mail: fchekin@yahoo.com; Tel: +981143217076
cDepartment of Chemistry, College of Science, United Arab Emirates University, Al Ain 15551, United Arab Emirates. E-mail: n.saleh@uaeu.ac.ae; Tel: +97137136138
First published on 29th July 2024
Abstract
Ribavirin (RIB) is widely used for the treatment of viral diseases such as herpes, hepatitis C, and Lassa fever. Moreover, to control the spread of COVID-19, the consumption of antiviral medicines, including RIB, has increased significantly worldwide. By combining ordered mesoporous carbon with silica nanoparticles via ultrasound, we synthesized silica/ordered mesoporous carbon (SiO2–OMC) hybrid composites that show excellent electrochemical performance. The hybrid composite was found to contain spherical SiO2 nanoparticles having diameters ranging from 21 to 29 nm. A sensor comprising a carbon paste electrode and SiO2–OMC (SiO2–OMC/CPE) facilitated the ultrasensitive and selective detection of RIB at an oxidation potential of 0.71 V, having a linear range of 0.1–40 μmol L−1, limit of detection of 0.067 μmol L−1, and sensitivity of 1.969 μA μmol−1 L. Furthermore, the results indicate that charge transfer at the interface of the SiO2–OMC hybrid results in a synergistic effect compared to OMC and SiO2 alone. The advantages include the potential for regenerating the sensor surface, rapid and facile production, and suitability for the detection of RIB in capsule, human plasma, and urine samples, making SiO2–OMC/CPE a promising interface for bioelectrochemical applications.
Introduction
Hepatitis C virus (HCV) is the leading cause of liver disease.1 The combination of polyethylene glycol (PEG)ylated-interferon α and ribavirin (RIB) is currently recommended for the treatment of HCV.2 RIB ([(2R,3R,4S,5R)-3,4-dihydroxy-5-(hydroxymethyl)oxolan-2-yl]-1,2,4-triazole-3-carboxamide) is a synthetic analogue of a purine nucleoside3 and is a broad-spectrum antiviral agent effective against both DNA and RNA viruses. It has proven efficacious in treating HCV infections, especially when used in conjunction with interferon α-2a/2b or PEGylated-interferon α-2a/2b.4,5 RIB is also the sole medication prescribed for Lassa fever, haemorrhagic fevers, severe acute respiratory syndrome (SARS), serious respiratory syncytial virus infections in paediatric patients, and influenza A and B viruses.6 The mechanisms of action of RIB include modulating the imbalance between T-helper-1 and -2 lymphocytes, depleting cellular guanosine triphosphate by inhibiting inosine monophosphate dehydrogenase, obstructing viral RNA-dependent RNA polymerase, impairing translation by preventing the capping of messenger viral RNA, and inducing lethal viral mutagenesis.7The COVID-19 pandemic has seen clinical development and use of antiviral therapies at an unprecedented speed. Antiviral therapies have greatly improved the clinical outcome in COVID-19 patients, especially when administered early after diagnosis.8 However, the presence of antiviral drugs in aquatic environments has triggered alarm concerning damage to natural ecosystems and human health.9 In particular, RIB is associated with considerable side effects; over 10% of patients experience dermatological, endocrine, metabolic issues, anorexia, nausea, vomiting, and anaemia.10 The hazards linked with RIB and its primary metabolites include haemolysis, genetic and reproductive toxicity, and teratogenicity.11 Hence, antiviral medications such as RIB are emerging primary pollutants.
Various analytical methods including thin-layer chromatography,12 high-pressure liquid chromatography,13 liquid chromatography-tandem mass spectrometry,14 flow injection chemiluminescence,15 capillary electrophoresis,16 and voltammetry17–20 have been employed to quantify RIB in clinical specimens. Electrochemical sensors such as the 3-aminophenyl boronic acid/reduced graphene oxide/glassy carbon electrode(APBA/RGO/GCE),17 hanging mercury drop electrode (HMDE),18 glassy carbon electrode modified with molecularly imprinted membrane/Prussian blue-gold (MIM/Au-PB/GCE),19 and Pt electrodes20 have been shown to be feasible tools for RIB detection.
Ordered mesoporous materials having diameters ranging from 2 to 50 nm have been extensively investigated for a wide range of applications, including adsorption, separation, catalysis, drug delivery, energy conversion, and storage.21,22 Owing to their hierarchical and modifiable porous architectures, mesoporous materials are frequently utilised in catalysis, sorption, separation, and biomedicine. Recently, ordered mesoporous carbons (OMC) have garnered considerable interest because of their distinctive hexagonal structures, adjustable large pore volumes, high thermal stabilities, and substantial surface area to volume ratios.23 Furthermore, the bimodal structure of OMCs may enhance electron and ion transfer, leading to OMC composites having high current densities. Amongst OMC materials, CMK-3 is distinguished by its ordered carbon nanowire arrays, which have a high length-to-diameter ratio.24 Additionally, CMK-3 can be readily customised in terms of pore size and wall thickness for practical applications. The macroscopic coarse particle structure of CMK-3 also aids its dispersion within a matrix, making it a promising candidate for the fabrication of composites as catalytic materials.25
Electroanalytical devices based on silica have also been developed. In particular, the attractive structures of silica have driven the development of mesoporous silica-based sensors and biosensors that show enhanced performance relative to their non-ordered counterparts.26 To the best of our knowledge, there is no prior reports in literature on the electro-catalytic behavior of SiO2–OMC nanocomposite. By combining SiO2 nanoparticles and OMC porous framework, an excellent nanocomposite was created with high surface area and good conductivity to improve the surface of electrodes. The prepared modified electrode demonstrated remarkable electro-catalytic activity for the detection of RIB in clinical samples with reasonable analytical results.
Experimental
Chemicals
OMC, sodium silicate, RIB, potassium hexacyanoferrate(II), phosphoric acid and its salts, graphite powder, and sodium hydroxide were obtained from Sigma-Aldrich. Green tea, predominantly cultivated in Rasht Province, was also used in this study. Human plasma and urine samples were prepared from clinical laboratory tests, Amol. All experiments were performed and informed consent was obtained in accordance with the Guidelines for Care and Use of Clinical Laboratory in Amol.Apparatus
The surface morphology and chemical composition of the samples were analysed using scanning electron microscopy (SEM; MIRATESCAN-XMU, Czech Republic) and energy dispersive X-ray spectroscopy (EDS). Ultraviolet-visible (UV-vis) spectrophotometry was carried out using a UV-1900 device (Shimadzu Co., Japan). Raman spectra were obtained on a Takram P50C0R10 Raman spectrometer (Teksan, Iran). X-ray diffractometry (XRD) measurements were performed with a Bruker D8 Advance X-ray diffractometer (Germany). Electrochemical measurements were carried out using a potentiostat/galvanostat (Sama 500-c, Sama, Iran). A platinum wire (as an auxiliary electrode), Ag|AgCl|KCl (as the reference electrode), carbon paste electrode (CPE), and SiO2–OMC/CPE (as working electrodes) were employed in the electrochemical cell.Ultrasonic assisted extraction (UAE)
Green tea (2 g) was infused in distilled water (100 mL) and sonicated in an ultrasound bath (60 kHz) at 45 °C for 20 min. The extract was filtered using Whatman filter paper and stored at 4 °C.Synthesis of SiO2–OMC nanocomposites
A 10 mL aliquot of the extract was combined with sodium silicate (20 mL, 0.5 M) with constant stirring at 60 °C and sonicated for 30 min. The pH of the mixture was adjusted to 9.0 using NaOH (1.0 M). The mixture was refluxed for 10 h at 50 °C, centrifuged for 10 min, washed with water, and heated at 600 °C for 1 h. The resultant product was composed of SiO2 powder. OMC (10 mg) and SiO2 nanoparticles (10 mg) were added to distilled water (30 mL), and the mixture was sonicated for 30 min at 25 °C. The product (SiO2–OMC) was washed with water and dried at 60 °C overnight.Fabrication of SiO2–OMC nanocomposite modified electrode
The CPE was prepared following our previously reported method.27,28 Graphite powder and paraffin were mixed manually until a uniformly wetted paste was achieved. The carbon paste was then packed into a glass tube (internal diameter of 3 mm). Electrical contacts were established using a copper wire. Subsequently, a fresh electrode surface was exposed by polishing with paper. Then, SiO2–OMC (1 mg) nanocomposite was dispersed in ethanol (1 mL) and sonicated for 30 min. Finally, the dispersion (5 μL) was drop-cast onto the CPE and dried in an oven at 50 °C.Analysis of biological samples
Human serum plasma or urine (500 μL) were aliquoted into phosphate buffer solution (PBS; 10 mL, 0.1 mol L−1; pH 7.0), and electrochemical analysis was performed by cyclic voltammetry(CV). Additionally, the samples were analysed by UV-vis spectroscopy at a wavelength of 220 nm after the addition of the samples (500 μL) to PBS (5 mL, 0.1 M; pH 7.0).Results and discussion
Characterisation
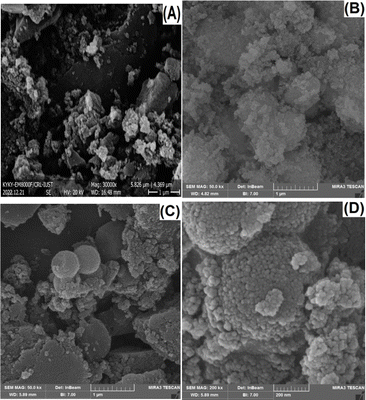
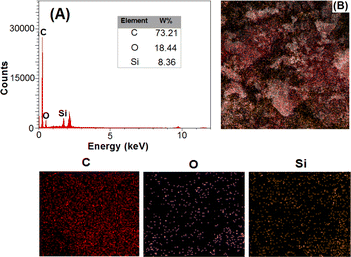
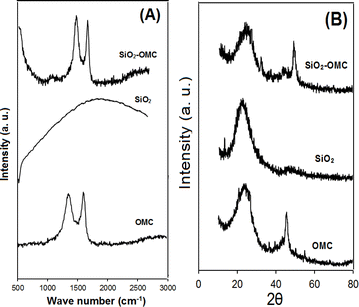
The morphologies of OMC, SiO2, and SiO2–OMC were characterised using field-emission (FE)-SEM. As shown in Fig. 1, OMC has a plate-like structure (Fig. 1A), whereas SiO2 displays aggregated spherical nanoparticles (Fig. 1B). The SEM image of SiO2–OMC reveals SiO2 nanoparticles enveloping the OMC layers (Fig. 1C), having diameters ranging from 21 to 29 nm (Fig. 1D). The EDS spectrum of SiO2–OMC (Fig. 2A) reveals that the sample comprises C (73.21%), O (18.44%), and Si (8.36% W), confirming the synthesis of the SiO2–OMC hybrid. Additionally, elemental mapping demonstrates a uniform distribution of Si in SiO2–OMC (Fig. 2B).Raman analysis was conducted on OMC, SiO2, and SiO2–OMC (Fig. 3A) to assess the defects introduced into the OMC structure after decoration with SiO2 nanoparticles. The D and G bands of OMC appeared at 1340 and 1603 cm−1, respectively, with an intensity ratio (ID/IG) of 0.98. SiO2 did not exhibit any peaks within this range. For SiO2–OMC, the D and G bands shifted to 1346 and 1598 cm−1, respectively, and the ID/IG ratio increased to 1.06, indicating chemical interactions between SiO2 and OMC.
XRD analysis was employed to examine the crystalline structure and interlayer modifications of the samples. The XRD patterns of OMC, SiO2, and SiO2–OMC are shown in Fig. 3B. The characteristic peaks of OMC at 24° and 45° correspond to the (002) and (100) planes, respectively. The SiO2 nanoparticles demonstrated a peak at 22.5°, consistent with the JCPDS89-0510 card. The (002) and (100) diffraction peaks of SiO2–OMC shifted to 25° and 48°, respectively, suggesting changes owing to the incorporation of SiO2 particles onto OMC.
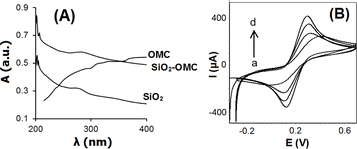
The UV spectra of aqueous dispersions containing OMC, SiO2, and SiO2–OMC are presented in Fig. 4A. OMC did not show any significant absorption peak at 200–400 nm. In contrast SiO2 yielded a broad absorption peak at 279 nm, which, after integration with OMC, shifted to 282 nm, indicating the formation of the SiO2–OMC hybrid.
Fig. 4B illustrates the electrochemical behaviour of [Fe(CN)6]3−/4− with the CPE and modified CPEs in PBS (0.1 mol L−1, pH 7.0), as determined by CV measurements. The current of the SiO2–OMC/CPE exceeded those recorded with the CPE, SiO2/CPE, and OMC/CPE. OMC and SiO2 nanostructures are known to have high surface areas, excellent electrical conductivities, rapid electron transfers, and current enhancement. The active surface areas of the OMC, SiO2, and SiO2–OMC interfaces were estimated by plotting the peak current against the square root of the scan rate,29 yielding values of 0.07, 0.09, 0.15, and 0.19 cm2 for CPE, SiO2/CPE, OMC/CPE, and SiO2–OMC/CPE, respectively. Benefiting from the synergistic enhancement effect between the SiO2 nanoparticles and OMC materials and the construction of a unique hierarchical and modifiable porous architectures that can make full use of SiO2 the conductive network structure and the high specific surface area of OMC, the SiO2–OMC nanocomposite demonstrates good charge transfer conductance, high specific capacitance, and excellent rate capability.
Electrochemical sensing of RIB
The electrocatalytic activities of the bare CPE, SiO2/CPE, OMC/CPE, and SiO2–OMC/CPE were investigated for the electro-oxidation of 10 μmol per L RIB in PBS (0.1 mol L−1, pH 7.0). As shown in Fig. 5A, the RIB oxidation current at SiO2–OMC/CPE was more pronounced at a potential of 0.71 V. Hybrid SiO2 nanoparticles with OMC have been shown to be efficient for enhancing electron transfer and electrical conductivity. Notably, the oxidation current of RIB on the SiO2–OMC/CPE increased as the pH increased from 5.0 to 7.0, peaking at pH 7.0. It's found that the O–H and –NH2 groups of the RIB are protonated at acidic conditions and the adsorption of RIB might be decreased on the electrode surface, the oxidation current dropped, while RIB exists in its deprotonated form at pH 7.0 and provides hydrogen binding with functional groups of SiO2–OMC causing adsorption of RIB. Moreover, degradation of ribavirin under basic conditions gives a major alkaline degradation product. The rate of acidic hydrolysis was lower when compared with that in alkali.30 Consequently, pH 7.0 was established as the optimal pH for RIB sensing. Moreover, the linear regression plot was observed for the pH values vs. oxidation potential Epa = 0.049 pH + 1.317 (R2 = 0.992), indicating an equal number of protons and electrons according to Scheme 1.The effect of the scan rate on the oxidation current of RIB in PBS (0.1 mol L−1, pH 7.0) on the SiO2–OMC/CPE is illustrated in Fig. 5B. A linear relationship between the oxidation current and scan rate was observed, yielding a regression equation of I (μA) = 0.2074ν + 10.21 (R = 0.992), as shown in Fig. 5C, suggesting an adsorption-controlled oxidation process.
The adsorption time is a crucial parameter for the detection of RIB on SiO2–OMC/CPE. An increase in the oxidation current of RIB was observed with the increase in adsorption time (Fig. 6A), and the current increased until reaching a plateau at 30 s, indicating saturation of the electrode with adsorbed RIB. Thus, an adsorption time of 30 s was selected as optimal for subsequent tests. Fig. 6B demonstrates the effect of the volume of SiO2–OMC deposited on the CPE in 0.1 mol per L PBS (pH 7.0) for the electro-oxidation of 5 μmol per L RIB. An optimal volume of 5 μL was identified, and smaller volumes resulted in reduced active surface area, whereas larger volumes than 5 μL produced excessively thick SiO2–OMC films.
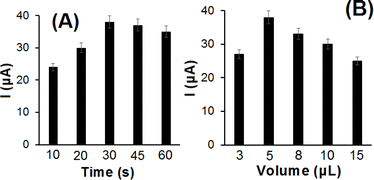 | ||
| Fig. 6 Effect of (A) adsorption time and (B) volume of SiO2–OMC on oxidation peak current of 5 μmol per L RIB. | ||
Electrochemical performance for the detection of RIB
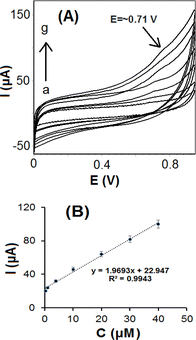
SiO2–OMC/CPE was further employed for RIB detection in PBS 0.1 mol L−1 (pH 7.0). Upon the addition of RIB, the oxidation current was recorded using CV (Fig. 7A). A linear response was obtained for RIB concentrations ranging from 0.1 to 40 μmol L−1, with an R2 value of 0.9943, and a regression equation of I (μA) = 22.947 + 1.9693 × [RIB] (μmol L−1), as shown in Fig. 7B. The limit of detection (LOD) for RIB was determined to be 0.067 μmol L−1. When compared to other methods,5,17–20,31,32 SiO2–OMC/CPE exhibited a low LOD, as shown in Table 1. Nonetheless, lower LODs have been reported for molecularly imprinted membrane/Prussian blue-gold modified glassy carbon electrodes (3 nmol L−1) and HDMEs (2 nmol L−1). However, the straightforward fabrication of SiO2–OMC/CPE may offer an advantage for the sensing of clinical samples at the nanomolar level. Moreover, the sensitivity of 1.969 μA μmol−1 L is particularly noteworthy for RIB sensing in biological fluids.| Electrode | Method | Linear range (μmol L−1) | LOD (μmol L−1) | Ref. |
|---|---|---|---|---|
| a Square-wave adsorptive stripping voltammetry. | ||||
| HMDE | SWAdSVa | 0.0001–0.2 | 0.0002 | 18 |
| — | UV-vis | 6.55–81.89 | 0.229 | 5 |
| — | UV-vis | 102.37–342.51 | 0.704 | 5 |
| MIM/Au-PB/GCE | DPV | 0.015–3.50 | 0.003 | 19 |
| APBA/ERGO/GCE | DPV | 0.04–3.07 | — | 17 |
| Pt | Oscillating | 0.15–63 | 0.032 | 20 |
| — | HPLC | 1–64 | 0.100 | 31 |
| — | HPLC | 0.82–20.47 | 0.245 | 32 |
| SiO2–OMC/CPE | CV | 0.1–40 | 0.067 | This work |
Next, the reproducibility of SiO2–OMC/CPE fabrication for RIB sensing was investigated. The relative standard deviation (RSD) for the RIB current was determined to be 5.7% at 5 μmol per L RIB across five electrodes. Additionally, the stability of the SiO2–OMC/CPE was assessed, revealing a decrease of 4.2% in RIB current at 5 μmol L−1 over 15 days. These results show that OMC is an excellent host for SiO2 nanoparticles, and the SiO2–OMC composite functions as a conductive and stable matrix.
To evaluate the selectivity of the proposed sensor, the sensing of RIB was carried out in the presence of endogenous compounds and other common interfering agents. The interference from cysteine, lysine, glucose, cations (K+, Na+, Ca2+, and Mg2+), doxorubicin, acetaminophen, uric acid, and ascorbic acid (5 μmol L−1 each) was examined for the detection of 5 μmol per L RIB with the SiO2–OMC/CPE in PBS (pH 7.0). The findings (Fig. S1†) indicated only minimal changes in the RIB current in the presence of these interferents, underscoring the high selectivity of the proposed RIB sensor.
RIB sensing in real samples
The applicability of the proposed method for real sample analysis was validated using CV. Recovery studies to detect RIB in capsules, plasma, and urine were performed to ascertain the efficacy of the SiO2–OMC/CPE. The mean recoveries for RIB ranged from 92.0% to 97.5%, having RSD values of 1.6–4.3%, as determined from standard addition tests (Table 2). This indicates minimal interference from the plasma and urine matrices. Consequently, the SiO2–OMC/CPE was used for the analysis of RIB concentrations in real samples. Furthermore, the results obtained with the SiO2–OMC/CPE sensor were compared with the UV-vis spectroscopy data using t-tests and F-tests (Table 2). The calculated t and F values did not exceed the theoretical values at the 95% confidence level, indicating that the precision of the developed sensor is comparable to that of the UV-vis method (Fig. 8).| Sample | Spiked (μmol L−1) | Found (μmol L−1) | Mean recovery (%) proposed | Mean recovery (%) UV method | t exp | F exp |
|---|---|---|---|---|---|---|
| a Theoretical values for t = 2.31 and F = 6.39 (p = 0.05). | ||||||
| Capsule | 5 | 4.7 | 94.0 ± 1.6 | 97.0 ± 3.4 | 1.98 | 5.76 |
| Plasma | — | — | — | — | — | — |
| Plasma | 5 | 4.7 | 96.0 ± 2.1 | — | — | — |
| Plasma | 10 | 9.5 | 97.5 ± 1.9 | — | — | — |
| Urine | — | — | — | — | — | — |
| Urine | 5 | 4.6 | 92.0 ± 3.1 | — | — | — |
| Urine | 10 | 9.7 | 93.5 ± 4.3 | — | — | — |
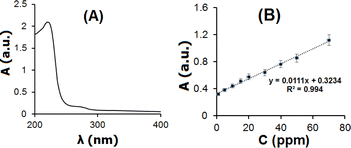 | ||
| Fig. 8 UV-vis spectrum of RIB 150 ppm in 0.1 mol per L PBS (pH 7.0). (E) Calibration curve for RIB determined by UV-vis spectroscopy. | ||
Conclusion
A novel and stable SiO2–OMC hybrid was effectively synthesized via environmentally friendly process. The results showed sphere-like SiO2 nanoparticles with particle sizes of 21–29 nm decorated onto OMC substrate. A precise and selective sensor, based on the SiO2–OMC hybrid integrated with a CPE, was developed to detect RIB. The SiO2–OMC/CPE sensor could display ultrasensitive and selective detection of RIB at an electro-oxidation potential of 0.71 V within a concentration range of 0.1–40 μM with an LOD of 0.067 μmol L−1 and a sensitivity of 1.969 μA μmol L−1. The sensor can also be used for the analysis of RIB in capsule, human plasma, and urine and the recoveries were 92.0–97.5%, with RSD values of 1.6–4.3%, suggesting that the proposed sensing methodology might be reliable and effective for monitoring of RIB in clinical specimens.Ethical statement
This research with ethical code of IR.IAU.AMOL.REC.1402.141 was approved by Ayatollah Amoli Branch, Islamic Azad University.Data availability
The data supporting this article have been included as part of the ESI.†Author contributions
All the authors contributed equally in this work.Conflicts of interest
The authors declare that they have no conflicts of interest.Acknowledgements
The authors are sincerely thankful for the research facilities provided by the Ayatollah Amoli Branch of the Islamic Azad University and the financial support provided by the United Arab Emirates University.References
- G. Taha, L. Ezra and N. Abu-Freha, Viruses, 2023, 15, 1413 CrossRef PubMed.
- P. Mathur, S. Kottilil and E. Wilson, J. Clin. Transl. Hepatol., 2018, 6, 431 CrossRef PubMed.
- X. Wu, J. Zhang, S. Hu, G. Zhang, H. Lan, J. Peng and H. Liu, Sci. Total Environ., 2022, 850, 157851 CrossRef CAS.
- D. Ye, Z. Bao, Y. Yu, Z. Han, Y. Yu, Z. Xu, W. Ma, Y. Yuan, L. Zhang, Y. Xu, T. Ma, S. Liu, X. Gao, G. Yan, Q. Huang, X. Wang, B. Hua, F. Yang, Y. Li and B. Cai, Toxicology, 2020, 435, 152422 CrossRef CAS.
- N. M. Krishna, Der Pharma Chem., 2018, 10, 73 CAS.
- A. A. El-Shanawany, A. R. A. Tantawi, A. A. Abdullah, A. S. Al-Hadi, A. A. Suleiman, A. M. Abdulhamid, A. M. Bayoumi, A. H. Ibrahim and M. M. Sebaiy, Arch. Med. Case Rep. Case Stud., 2023, 7, 158 Search PubMed.
- H. S. Te, G. Randall and D. M. Jensen, Gastroenterol. Hepatol., 2007, 3, 218 Search PubMed.
- M. Singh and E. de Wit, Cell Rep. Med., 2022, 3, 100549 CrossRef CAS PubMed.
- M. Kumar, P. Mazumder, S. Mohapatra, A. Kumar Thakur, K. Dhangar, K. Taki, S. Mukherjee, A. Kumar Patel, P. Bhattacharya, P. Mohapatra, J. Rinklebe, M. Kitajima, F. I. Hai, A. Khursheed, H. Furumai, C. Sonne and K. Kuroda, J. Hazard. Mater., 2021, 405, 124043 CrossRef CAS PubMed.
- A. F. El-Yazbi, Y. Khalifa, M. A. W. Elkhatib and A. F. El-Yazbi, Microchem. J., 2021, 164, 105964 CrossRef CAS.
- J. K. Ma, X. C. Huang and S. L. Wei, J. Sep. Sci., 2019, 42, 3372 CrossRef CAS PubMed.
- I. A. Darwish, H. F. Askal, A. S. Khedr and R. M. Mahmoud, J. Chromatogr. Sci., 2008, 46, 4 CAS.
- L. Liu, S. Guo, Ch. Che, Q. Su, D. Zhu and X. Hai, Biomed. Chromatogr., 2022, 36, e5370 CrossRef CAS PubMed.
- Y. L. Wu, R. X. Chen, L. Zhu, Y. Lv, Y. Zhu and J. Zhao, J. Chromatogr. B, 2016, 55, 1012 Search PubMed.
- Y. Lu, Z. Zhang, D. He and Y. Hu, Anal. Lett., 2003, 36, 1587 CrossRef CAS.
- M. C. Breadmore, R. Theurillat and W. Thormann, J. Electroph., 2004, 25, 1615 CrossRef CAS PubMed.
- M. Z. H. Khan, M. Daizy, C. Tarafder and X. Liu, Sci. Rep., 2019, 9, 19041 CrossRef CAS PubMed.
- A. A. Abdel Gaber, S. A. Ahmed and A. M. Abdel Rahim, Arab. J. Chem., 2017, 10, S2175 CrossRef CAS.
- Q. Gao, D. Jin, J. Xu, H. Huang, H. Cheng and H. Xue, J. Pharm. Biomed. Anal., 2023, 230, 115378 CrossRef CAS PubMed.
- J. Gao, H. Dai, H. Chen, D. Lv, W. Yang, X. Wei and J. Qu, J. Chil. Chem. Soc., 2007, 52, 1150 CAS.
- X. Du, X. Li, L. Xiong, X. Zhang, F. Kleitz and Sh. Zhang Qiao, Biomater, 2016, 91, 90 CrossRef CAS PubMed.
- Z. Zhu, S. Bai, H. Shang, Q. Tian, J. Sun, X. Wu and J. Liu, Microporous Mesoporous Mater., 2020, 293, 109768 CrossRef CAS.
- H. Xu, Y. Pan, H. Kou, Y. Zhu and J. Guo, J. Alloys Compd., 2010, 502, L6 CrossRef CAS.
- Y. Gao, Q. Wang, G. Ji, A. Li and J. Niu, RSC Adv., 2021, 11, 5361 RSC.
- K. Quiroz-Estrada, M. Esparza-Schulz and C. Felipe, J. Compos. Sci., 2022, 6, 344 CrossRef CAS.
- A. Walcarius, Curr. Opin. Electrochem., 2018, 10, 88 CrossRef CAS.
- H. Bagheri Ladmakhi, S. Fathi, F. Chekin and J. B. Raoof, Russ. J. Electrochem., 2022, 58, 184 CrossRef.
- R. Rahimpour, B. Sabeti and F. Chekin, Russ. J. Electrochem., 2021, 57, 654 CrossRef.
- E. Vatandost, A. Ghorbani HasanSaraei, F. Chekin, S. Naghizadeh Raeisi and S. A. Shahidi, Russ. J. Electrochem., 2021, 57, 490 CrossRef.
- F. Belal, M. K. Sharaf El-Din, M. I. Eid and R. M. El-Gamal, J. Chromatogr. Sci., 2015, 43, 603 Search PubMed.
- J. V. Svensson, A. Bruchfeld, R. Schvarcz and L. Stahle, Ther. Drug Monit., 2000, 22, 215 CrossRef CAS PubMed.
- S. Larrat, F. Stanke-Labesque, A. Plages, J. P. Zarski, G. Bessard and C. Souvignet, Antimicrob. Agents Chemother., 2003, 47, 124 CrossRef CAS PubMed.
Footnote |
| † Electronic supplementary information (ESI) available. See DOI: https://doi.org/10.1039/d4na00435c |
| This journal is © The Royal Society of Chemistry 2024 |

