 Open Access Article
Development of a laser induced graphene (LIG) and polylactic acid (PLA) shape memory polymer composite with simultaneous multi-stimuli response and deformation self-sensing characteristics†
Reza
Gholami
a,
Ibrahim
Lawan
a,
Panuwat
Luengrojanakul
a,
Sahar
Ebrahimi
a,
Cheol-Hee
Ahn
b and
Sarawut
Rimdusit
 *a
*a
aCenter of Excellence in Polymeric Materials for Medical Practice Devices, Department of Chemical Engineering, Faculty of Engineering, Chulalongkorn University, Bangkok, 10330, Thailand. E-mail: sarawut.r@chula.ac.th
bDepartment of Materials Science and Engineering, Seoul National University, Seoul 08826, Korea
First published on 31st July 2024
Abstract
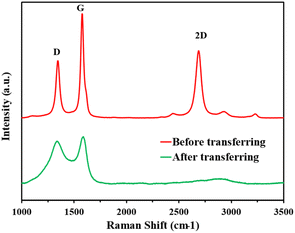
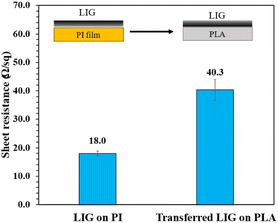
This study presents the integration of laser-induced graphene (LIG) on a polylactic acid (PLA) substrate to create a novel shape memory polymer composite (SMPC) with multi-stimuli response and deformation self-sensing characteristics. The LIG was initially engraved on a commercial polyimide film and subsequently transferred to the PLA substrate through hot compression. Raman spectra analysis confirmed the successful engraving of the LIG, exhibiting the typical characteristic peaks. Durability tests revealed that the transferred LIG adhered well to the PLA substrate. Additionally, the transferred LIG demonstrated a sheet resistance of 40.3 Ω sq−1, which facilitated the electrical actuation of the LIG/PLA composite through Joule heating, allowing precise temperature control by manipulating the applied electrical power. An optimum electrical power of 0.95 W was identified to rapidly reach the actuation temperature without exceeding 80 °C. The study also demonstrated the LIG/PLA composite's responsiveness to infrared (IR) light, attributed to photothermal conversion behavior of LIG. An optimum IR intensity of 85 mW cm−2 was established for reaching the actuation temperature without surpassing 80 °C. This multi-stimulus functionality was achieved alongside real-time monitoring of the shape recovery ratio, enabled by the piezoresistive properties of LIG, which allowed for recording electrical resistance changes during recovery. This approach eliminates the need for external components and offers a straightforward fabrication process. The ability to actuate and sense deformation using a single, integrated LIG pattern opens new opportunities for developing advanced, multi-responsive, and self-sensing shape memory polymer composites.
1. Introduction
Shape memory polymers (SMPs) are a class of smart materials renowned for their ability to undergo programmed shape changes.1 This remarkable property allows SMPs to be deformed into a temporary shape under external force and subsequently recover their original, permanent form upon exposure to a specific external trigger,2 such as heat,3 electric,4 light,5,6 magnetic field,7 ultrasound,8 or pH.9 This inherent property has gained attention in material research, with vast potential applications in diverse fields including aerospace,10,11 soft-robotics,12,13 and medical devices.14,15 Among the various triggering mechanisms, thermally activated shape memory is particularly well-established. Programming for heat-responsive SMPs usually involves a two-step process, firstly, deformation above the glass transition temperature (Tg) with an external force, followed by cooling below Tg to “fix” the temporary shape. Upon heating above Tg again, this fixed shape returns to the original form. Therefore, achieving efficient, localized, and controllable heating becomes crucial for successful actuation of thermally responsive SMPs.While conventional external heating sources exist, alternative methods offer advantages when direct heating is impractical. These include light (IR radiation) and electric current (Joule heating). Electrically conductive nanofillers, such as carbon nanotubes (CNTs)16,17 or graphene nanoplatelets (GNPs),18 and conductive reinforcements like carbon fibers19 have been incorporated into SMPs to create shape memory polymer composites (SMPC) responsive to electrical actuation. These conductive materials allow internal heat generation through Joule heating when an electric current is applied. Similarly, light-responsive SMPCs utilize nanofillers with photothermal conversion capabilities, such as graphene,20,21 carbon black,22 CNT,23 or titanium nitride (TiN).24,25 These nanofillers enable contactless heat generation for triggering shape recovery of SMPCs. However, incorporating these conductive or photothermal fillers can impact the shape memory performance and other properties of the SMP nanocomposite, whether positive or negative. This necessitates additional experimentation and optimization for any new SMP-filler combination and application.
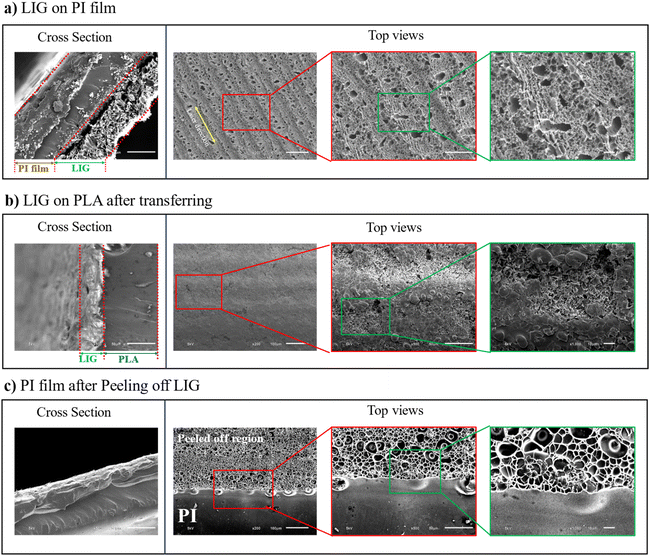
An ideal scenario would involve an integrated heating source within the SMP that minimally affects its shape memory performance and other physical properties. This is precisely where laser induced graphene (LIG) emerges as a potential solution. LIG is a three-dimensional porous network of graphene flakes exhibiting high electrical conductivity.26 It's fabricated through a direct-write laser scribing process using a CO2 laser cutter, commonly found in machine shops. Polyimide (PI) is the most widely used precursor material for LIG synthesis.27 This technique allows for precise patterning of desired geometries on the substrate. By optimizing laser parameters, researchers can control the formation of LIG with various morphologies and conductivities.28,29 The exceptional conductivity of LIG has been successfully used for applications requiring resistive Joule heating.30–32 Previous studies have also shown that LIG exhibits outstanding photothermal conversion capabilities.33–35 Interestingly, LIG patterns after engraving on PI film can be seamlessly transferred onto diverse polymer substrates.36,37 Therefore, this transferability suggests that by integrating an LIG pattern onto an SMP substrate, the resulting SMPC can have both resistive Joule heating and photothermal conversion functionalities and can be responsive to both electrical and IR light actuations. Additionally, LIG possesses remarkable piezoresistive properties due to its microporous, foam-like structure, making it suitable for strain sensing applications.38,39 Beyond triggering shape recovery through Joule heating or photothermal conversion, LIG's piezoresistive nature can add another exciting functionality which is real-time monitoring of the SMPC's deformation during recovery. Despite these compelling attributes, there appears to be a lack of existing research exploring the use of LIG as a multifunctional element for SMPC applications.
Motivated by the promising properties of LIG, this research investigates its potential as a multifunctional component for SMPCs. Polylactic acid (PLA), a well-known bio-based and biodegradable polymer with good shape memory properties,40 was chosen as the SMP substrate. To explore each LIG functionality, a LIG pattern was first designed. Following preparation through laser engraving on a PI film, the LIG pattern was then transferred onto the PLA substrate using a simple compression technique during hot compression molding to produce an LIG/PLA composite. The transferred LIG and LIG/PLA composite were characterized using various techniques, including Raman spectroscopy, sheet resistance measurements, morphological analysis, adhesion durability tests, and dynamic mechanical analysis (DMA). Subsequently, the Joule heating and photothermal conversion performance of the transferred LIG were systematically investigated to determine the optimal electric power and light intensity needed to achieve the desired actuation temperature of the LIG/PLA composite. Finally, the deformation self-sensing capability of the LIG/PLA composite during shape recovery, actuated by optimal Joule heating and IR light, was examined.
2. Materials and methods
2.1. Materials
The polylactic acid (PLA 4043D) used in the study as a substrate for the shape memory was obtained from Natureworks Co. Ltd and commercial polyimide Kapton® film (125 μm thick) was used for the production of the laser induced graphene (LIG).2.2. Production of the LIG with the U-shape pattern
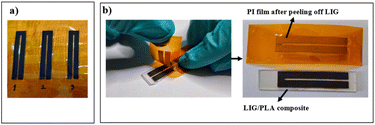
The U-shaped LIG pattern with dimensions as shown in Fig. 1(a) was engraved on a commercial grade polyimde (PI) film using a commercial CO2 laser machine (Trotec Speedy 100, 1.5′′ lens). The machine was operated at 4.8 W, 14.4 cm s−1, 500 DPI × 1000 PPI for the power, engraving speed, resolution, respectively, with a 3 mm defocusing distance below the focal plane.2.3. Transferring the produced U-shape patterned LIG on to a PLA substrate to form the composite
The PLA pellets were dried in an oven at 80 °C for 24 hours. Then, a metal mold was used for compression molding. First, PLA pellets were poured into the mold cavities (dimensions: 50 × 10 × 1 mm3) and melted in a vacuum oven at 180 °C to form a void-free PLA preform. The melted PLA preform was then taken out of the vacuum oven, and the PI/LIG film was placed on the top of the molten PLA preform and was then compressed using a hot compression molding machine at 180 °C for 1 minute (Fig. 1(b)). Afterward, the pressure was released, and the mold was allowed to cool down to room temperature. Finally, as shown in Fig. 1(c), the PI film was peeled off from the surface of the PLA transferring the LIG pattern onto the PLA surface to produce the LIG/PLA composite specimens.2.4. Characterization of the LIG/PLA composites
2.5. Evaluation of shape memory and self-sensing performance of LIG/PLA composite
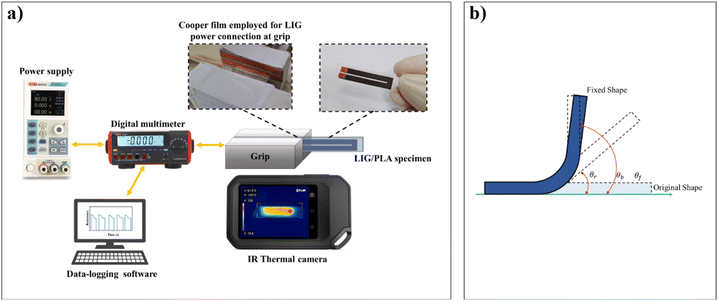 | ||
| Fig. 2 (a) Schematic of test setup used for shape memory performance experiments. (b) Schematic illustration of LIG/PLA specimen recovery process. | ||
The optimized electrical power was utilized to evaluate the shape recovery performance of the LIG/PLA composite actuated electrically. The existing test setup was maintained, incorporating a data-logging multimeter (UNI-T UT803) to monitor current and resistance in the LIG during recovery. The LIG/PLA sample was heated to 80 °C by applying voltage to the LIG pattern. A semi-circular bar (15 mm radius) then bent the sample to a 90° angle, placing the LIG pattern under tension on the convex side. The power was turned off for cooling and shape fixation. Eqn (1) was used to calculate the shape fixity ratio (Rf). Subsequently, power was turned on to induce recovery. Changes in resistance and temperature were recorded using a multimeter and thermal camera, respectively. The entire process was video recorded to measure angle change for calculating the recovery ratio (Rr) using eqn (2). A schematic representation of recovery process is depicted in Fig. 2(b).
 | (1) |
 | (2) |
The optimized IR light intensity was employed to evaluate the IR light actuated shape recovery performance of the LIG/PLA composite. The procedure for recording resistance and recovery ratio remained identical. However, instead of applying electric power to the LIG pattern, the IR bulb was employed to heat the LIG/PLA specimen. The same actuation procedure was repeated for pristine PLA specimens, which had previously been fixed at a 90° angle at 80 °C for comparison purposes.
3. Results and discussion
3.1. Produced LIG
The engraving conditions, described in Section 2.2, resulted a uniform LIG pattern on the PI film with the designed dimensions, as shown in Fig. 3(a).3.2. Fabricated LIG/PLA composite
The LIG pattern initially produced on the PI film by laser engraving was successfully transferred to a PLA substrate using the proposed hot compression transfer technique. This resulted in a LIG/PLA composite, which is shown in Fig. 3(b).3.3. Characteristics of the LIG/PLA composite
While the sheet resistance increased after transfer (40.3 ± 3.7 Ω sq−1), the resulting LIG still demonstrates adequate conductivity for applications requiring patterned conductivity, such as SMPCs applications. Obviously, this value can be further optimized by controlling laser scribing parameters and compression transferring condition in future works.
![[thin space (1/6-em)]](https://www.rsc.org/images/entities/char_2009.gif) δ curves of both pristine PLA and LIG/PLA composite are shown in Fig. 7(b) and (c). As can be seen, the incorporation of LIG on the PLA surface did not significantly affect the storage modulus at 30 °C, with only a reduction of less than 6%. The Tg value of PLA obtained from both tan
δ curves of both pristine PLA and LIG/PLA composite are shown in Fig. 7(b) and (c). As can be seen, the incorporation of LIG on the PLA surface did not significantly affect the storage modulus at 30 °C, with only a reduction of less than 6%. The Tg value of PLA obtained from both tan![[thin space (1/6-em)]](https://www.rsc.org/images/entities/char_2009.gif) δ and loss modulus curves was 66 °C and 60 °C, respectively, for both pristine PLA and LIG/PLA samples, demonstrating the independence of the SMP substrate's Tg from the incorporation of LIG onto the surface. This observation aligns well with one of the primary objectives of using LIG as a multifunctional component in SMPC applications.
δ and loss modulus curves was 66 °C and 60 °C, respectively, for both pristine PLA and LIG/PLA samples, demonstrating the independence of the SMP substrate's Tg from the incorporation of LIG onto the surface. This observation aligns well with one of the primary objectives of using LIG as a multifunctional component in SMPC applications.
The difference in Tg values obtained from the loss modulus curve and the tan![[thin space (1/6-em)]](https://www.rsc.org/images/entities/char_2009.gif) δ curve is attributed to the distinct aspects of viscoelastic behavior each curve characterizes. The loss modulus curve focuses on energy dissipation and the onset of viscous behavior, while the tan
δ curve is attributed to the distinct aspects of viscoelastic behavior each curve characterizes. The loss modulus curve focuses on energy dissipation and the onset of viscous behavior, while the tan![[thin space (1/6-em)]](https://www.rsc.org/images/entities/char_2009.gif) δ curve emphasizes the material's ability to dampen vibrations and dissipate energy.43 For the purpose of further shape memory experiments in this study, a Tg of 60 °C, obtained from the loss modulus curve, was assumed for both PLA and LIG/PLA composites. The only difference in viscoelastic behavior between PLA and LIG/PLA specimens is the height of the tan
δ curve emphasizes the material's ability to dampen vibrations and dissipate energy.43 For the purpose of further shape memory experiments in this study, a Tg of 60 °C, obtained from the loss modulus curve, was assumed for both PLA and LIG/PLA composites. The only difference in viscoelastic behavior between PLA and LIG/PLA specimens is the height of the tan![[thin space (1/6-em)]](https://www.rsc.org/images/entities/char_2009.gif) δ and loss modulus peaks. Notably, the peaks for the LIG/PLA specimen are smaller. This is likely because the presence of the LIG layer creates a stiffer interface that restricts the mobility of PLA chains. During the glass transition temperature (Tg), these chains normally undergo relaxation processes that contribute to the peak height in tan
δ and loss modulus peaks. Notably, the peaks for the LIG/PLA specimen are smaller. This is likely because the presence of the LIG layer creates a stiffer interface that restricts the mobility of PLA chains. During the glass transition temperature (Tg), these chains normally undergo relaxation processes that contribute to the peak height in tan![[thin space (1/6-em)]](https://www.rsc.org/images/entities/char_2009.gif) δ and loss modulus curves. The restricted mobility due to the interface hinders these relaxation processes, resulting in a smaller peak height for the LIG/PLA composite compared to pristine PLA.
δ and loss modulus curves. The restricted mobility due to the interface hinders these relaxation processes, resulting in a smaller peak height for the LIG/PLA composite compared to pristine PLA.
3.4. Shape memory and self-sensing performance of the LIG/PLA composite
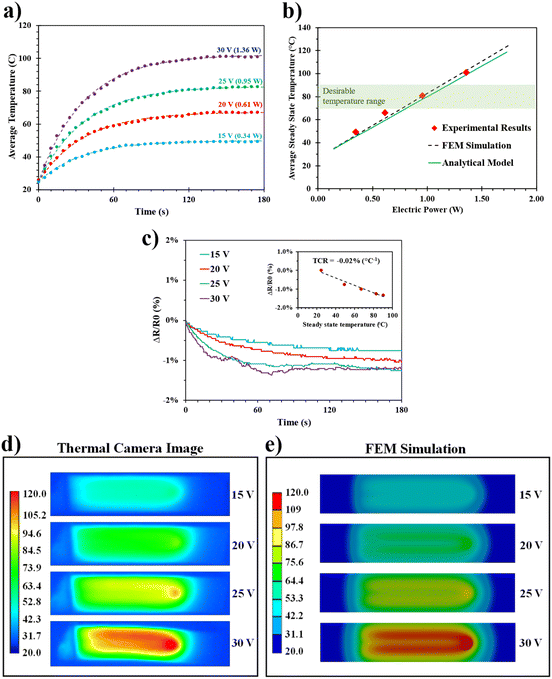
While achieving recovery temperatures rapidly is crucial for fast recovery of LIG/PLA composite, the maximum temperature reached by the SMP/LIG specimen is equally important. Ideally, this temperature should fall within a range close to the programming temperature (80 °C). Analytical models and finite element simulations estimated the steady-state temperature of the LIG/PLA specimens under various electrical powers, showing close agreement with experimental data, as shown in Fig. 8(b). Additionally, Fig. 8(d) and (e) show the steady-state temperature distributions on the back side of the LIG/PLA specimen, captured by a thermal camera and obtained from FEM simulations, respectively. The temperature distributions exhibit nearly identical profiles, reinforcing the validity of the FEM simulations. Subsequently, an optimum electrical power of 0.95 W was determined according to validated analytical equation (eqn S5†) to ensure having a maximum steady-state temperature of 80 °C during shape recovery in a 1 mm-thick LIG/PLA composite. This optimum value was used in subsequent electrically actuated shape recovery experiments.
In addition to the thermal response of the LIG pattern to different voltages, the variation in LIG resistance over time was recorded to investigate the dynamic change in electrical resistance. The resistance changes over time at different voltages are presented in Fig. 8(c). As shown, a slight decrease in resistance occurred at all voltages due to the corresponding increase in temperature (refer to Fig. 8(a)). Once the temperature reached a steady-state value, the resistance remained constant. An exception was observed at 30 V, where the resistance initially decreased but started to increase after 90 seconds. As mentioned earlier, at 30 V, the steady-state temperature reached 100 °C, causing a reduction in the stiffness of PLA and bending of the sample due to its weight. This led to the stretching of the LIG, which in turn resulted in an increase in resistance. This deformation and bending are also visible in the thermal images at 30 V (Fig. 8(d)). This clearly demonstrates the importance of optimizing the maximum achievable steady-state temperature to avoid undesirable stiffness reduction and deformations.
Additionally, the resistance at each steady-state temperature was used to calculate the temperature coefficient of resistance (TCR) of the transferred LIG. The inset plot in Fig. 8(c) presents the resistance change over temperature, with the slope of the fitted line corresponding to a TCR of −0.02% (°C−1) in the temperature range of 25 to 90 °C. This TCR resulted in a maximum reduction in resistance of around 1% for an optimum electric power of 0.95 W, which can be considered negligible during electrically actuated shape memory experiments.
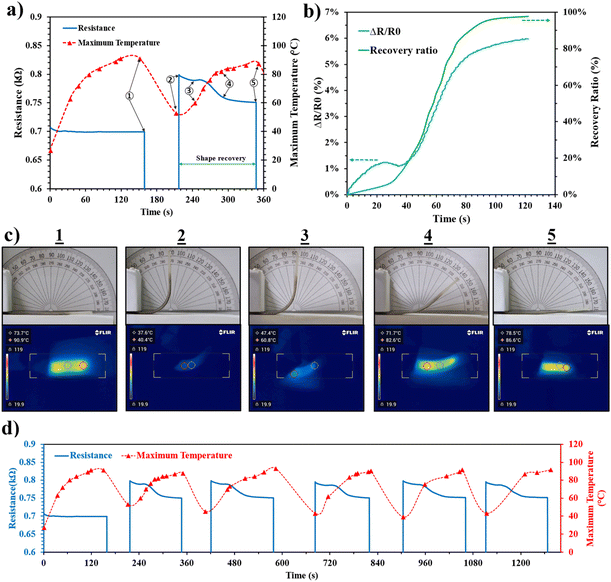
Fig. 9 presents the deformation sensing evaluation of the LIG/PLA composite during cyclic electrically actuated shape recovery experiments. Fig. 9(a) shows the piezoresistive response and maximum temperature, with key events annotated during the first cycle of shape fixation and recovery. Corresponding digital and thermal images for each labelled time point are shown in Fig. 9(c). Additionally, the shape recovery of LIG/PLA with electrical actuation is demonstrated in ESI Video 2.†
Initially, applying voltage to the LIG pattern resulted in a temperature rise until the programming temperature was reached at point 1. At this point, the current was turned off, and the specimen was bent to 90° and cooled to approximately 40 °C to fix its temporary shape (point 2). The resistance of the LIG pattern increased to around 800 Ω due to the applied tensile stress on LIG during bending, consistent with the piezoresistive nature of the LIG pattern. When the current was reapplied at point 2, a minor decrease in resistance was observed between points 2 and 3 due to the initial temperature difference and early-stage recovery. The main recovery process began when the temperature reached Tg (60 °C) at point 3, during which resistance decreased as the shape recovered. The recovery rate accelerated significantly when the temperature reached the programming temperature of 80 °C (point 4), continuing until complete recovery at point 5. Fig. 11(b) highlights this by plotting recovery ratio and resistance change ratio over time, showing a steeper slope in the recovery curve at the programming temperature, indicating faster recovery. Additionally, it shows how resistance variation was in a good harmony with recovery ratio, highlighting self-sensing capability of LIG/PLA composite.
Despite continuous resistance decrease during recovery, the initial pre-bending resistance was not fully recovered due to some irreversible breakage of conductive pathways within the LIG's microporous structure. However, this phenomenon was only noted during the first cycle. Subsequent cycles, as shown in Fig. 9(d), demonstrated complete resistance recovery to the pre-bending value, confirming the stability of the LIG pattern for deformation sensing after the first cycle. Additionally, Fig. 9(d) shows that the maximum temperature remained within the desired range throughout the cyclic recovery process, validating the effectiveness of the developed analytical equation for estimating the required electrical power.
As mentioned earlier, the system's time constant can limit the recovery time of the LIG/PLA composite, and reducing it can lead to faster recovery. Generally, the time constant depends on the characteristics of the LIG pattern, which can be optimized through laser engraving conditions or by adjusting the pattern geometry. It can also be reduced by minimizing heat loss from the LIG to the surroundings by integrating the pattern inside the PLA substrate to create a laminate. These optimizations were beyond the scope of this study and could be the subject of a future detailed investigation. Another strategy to decrease recovery time in practical applications is to employ a varying voltage to control the temperature. By initiating the cycle with a higher voltage and gradually reducing it, we can achieve the desired temperature without exceeding it.
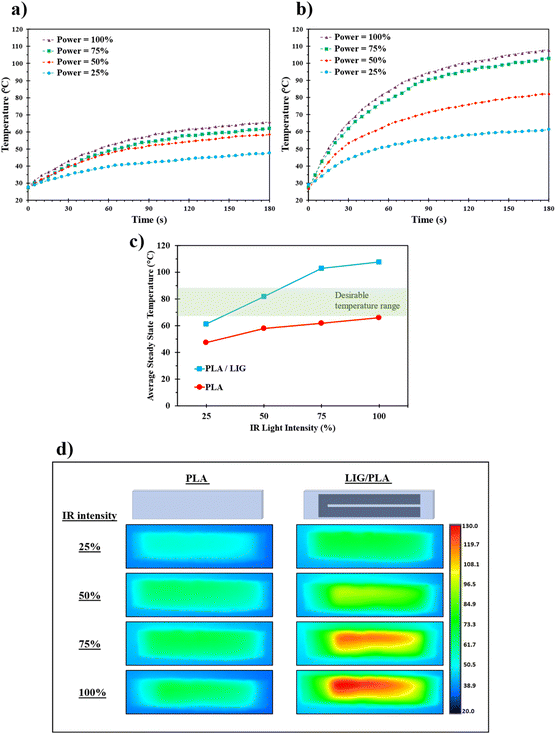
As previously mentioned, the final equilibrated temperature for heat-responsive SMPs is crucial to obtain a successful recovery of LIG/PLA specimen for ensuring successful recovery of the LIG/PLA specimen without exceeding the programming temperature value. This value should ideally lie around 80 °C. Therefore, an IR bulb power of 50% (85 mW cm−2) appeared to be the optimal setting for LIG/PLA actuation and this value was used for further IR light actuated shape recovery experiments.
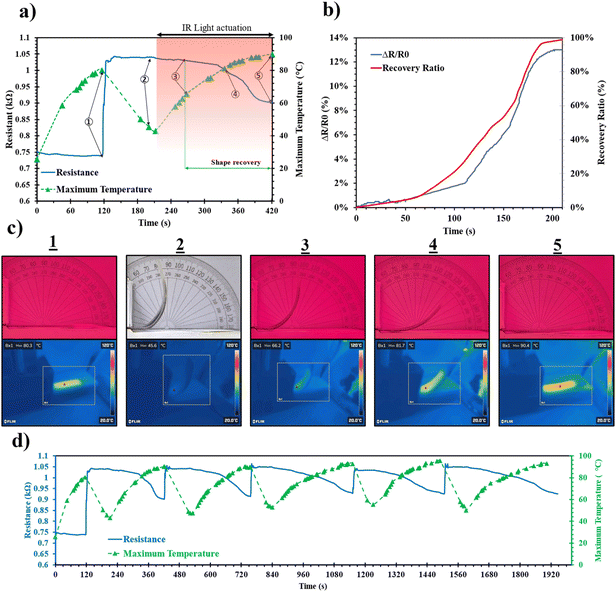
Fig. 11 presents the deformation sensing evaluation of the LIG/PLA composite during cyclic IR light actuated shape recovery experiments. Fig. 11(a) presents the piezoresistive response and temperature during the LIG/PLA shape fixation and recovery process, with key events marked. Corresponding digital and thermal images are presented in Fig. 11(c). Fig. 11(b) illustrates the correlation between recovery ratio and resistance change ratio during the IR light-actuated recovery experiment. Additionally, the shape recovery of LIG/PLA with IR light actuation is demonstrated in ESI Video 3.† The results obtained from the IR light actuated recovery experiments exhibited a remarkable degree of similarity in deformation sensing capability of LIG/PLA composite to those achieved with electrical actuated recovery (refer to Fig. 9 for comparison). This consistency reinforces the LIG pattern's suitability as a deformation sensor during shape memory recovery, independent of the heating mechanism.
However, a slight difference was observed in the shape memory performance of the LIG/PLA composite when actuated electrically or with IR light. Table 1 summarizes the key shape memory parameters for comparison, including shape fixity ratio, shape recovery ratio, and recovery time. Notably, the shape fixity and recovery ratios for the LIG/PLA composite were comparable for both actuation methods and favourably matched values reported for PLA in prior literature.40 However, the recovery time exhibited significant differences, with IR light actuation taking roughly twice as long as electrical actuation. This discrepancy can be attributed to the inherent heating mechanisms of each method. During electrical actuation, the applied voltage generates heat uniformly throughout the LIG pattern. Conversely, with IR actuation, the LIG pattern absorbs light and converts it into heat, leading to variations in heating rates across the material. Besides the contrasting heating rates and mechanisms, another factor comes into play. At a fixed 90° angle, some portions of the LIG/PLA specimen were parallel to the light direction. This configuration hindered uniform heat generation, resulting in a slower recovery process. However, Fig. 11(b) demonstrates that the recovery rate increases as the angle between the LIG/PLA composite and the light source changes, leading to more efficient heat generation within the LIG pattern.
| Sample | Shape fixity ratio (%) | Electrical actuation | IR light actuation | ||
|---|---|---|---|---|---|
| Recovery ratio (%) | Recovery time (s) | Recovery ratio (%) | Recovery time (s) | ||
| a Not available. b No shape recovery was observed after 3 min at 85 mW cm−2 IR exposure. | |||||
| PLA | 99.1 ± 0.3 | NAa | NA | 0b | NA |
| LIG/PLA | 98.9 ± 0.2 | 98.3 ± 0.47 | 145 ± 14 | 98.9 ± 0.35 | 245 ± 28 |
Furthermore, Table 1 clearly demonstrates the added functionalities imparted to PLA by integrating LIG. The LIG/PLA composite exhibits both electrical- and IR light-responsive shape memory performance, functionalities absent in pristine PLA.
4. Conclusions
This study demonstrates the successful integration of LIG pattern onto PLA substrate using a hot compression method. This method effectively transferred the LIG pattern, creating LIG/PLA composites with the pattern embedded on the PLA surface. The transferred LIG pattern functioned as both Joule heating and photothermal elements. This enabled the actuation of LIG/PLA composite using either electrical or IR light stimuli. Additionally, the LIG pattern exhibited piezoresistive behaviour. This enabled to track the recovery ratio of the LIG/PLA composite throughout the shape recovery process, while concurrently undergoing electrical or IR light actuation. These findings highlight the potential of LIG as a multifunctional component for SMPCs. By integrating LIG patterns, SMPCs gain multi-stimuli responsiveness and self-sensing functionalities. Furthermore, the ability to achieve actuation and deformation sensing using a single, integrated LIG pattern simplifies the fabrication process for developing advanced, multi-responsive SMPCs. These SMPCs have potential applications in various fields, such as self-deployable structures or adaptive materials. Future work can investigate the integration of LIG patterns with different SMP materials. This exploration could lead to a wider range of actuation responses and mechanical properties. Additionally, research can explore more complex LIG patterns and geometries to achieve more controlled and localized actuation within the SMPCs.Data availability
Data supporting this study are included within the article.Author contributions
Reza Gholami; conceptualization, methodology, formal analysis; writing & editing. Ibrahim Lawan; methodology, review and editing; Panuwat Luengrojanakul; methodology, review and editing, Sahar Ebrahimi; methodology, conceptualization. Cheol-Hee Ahn; supervision and result validation. Sarawut Rimdusit; supervision, resources, validation, review and editing.Conflicts of interest
There are no conflicts to declare.Acknowledgements
We gratefully acknowledge the support and funding provided by the Second Century Fund (C2F) at Chulalongkorn University, the National Research Council of Thailand (NRCT) and Chulalongkorn University (No. 42A660910), and the Thailand Science Research and Innovation Fund Chulalongkorn University (No. 6641/2566). Additionally, we wish to extend our thanks to Prof. Dr Sanong Ekgasit of Department of Chemistry, Faculty of Science, Chulalongkorn University for letting the team have access to the SEM.Notes and references
- H. Bhanushali, S. Amrutkar, S. Mestry and S. T. Mhaske, Polym. Bull., 2021, 79(6), 3437–3493 CrossRef.
- F. Zhang, Y. Xia, Y. Liu and J. Leng, Nanoscale Horiz., 2020, 5, 1155–1173 Search PubMed.
- S. Chen, J. Hu, H. Zhuo, C. Yuen and L. Chan, Polymer, 2010, 51, 240–248 CrossRef CAS.
- Y. Liu, H. Lv, X. Lan, J. Leng and S. Du, Compos. Sci. Technol., 2009, 69, 2064–2068 CrossRef CAS.
- A. Lendlein, H. Jiang, O. Jünger and R. Langer, Nature, 2005, 434(7035), 879–882 CrossRef CAS PubMed.
- W. Jamnongpak, S. Tiptipakorn, H. Arumugam, K. Charoensuk, P. Karagiannidis and S. Rimdusit, Nanoscale Adv., 2024, 6, 499–510 RSC.
- M. Y. Razzaq, M. Behl and A. Lendlein, Adv. Funct. Mater., 2012, 22, 184–191 CrossRef CAS.
- G. Li, G. Fei, H. Xia, J. Han and Y. Zhao, J. Mater. Chem., 2012, 22, 7692–7696 Search PubMed.
- X. J. Han, Z. Q. Dong, M. M. Fan, Y. Liu, J. H. Li, Y. F. Wang, Q. J. Yuan, B. J. Li and S. Zhang, Macromol. Rapid Commun., 2012, 33, 1055–1060 Search PubMed.
- Y. Liu, H. Du, L. Liu and J. Leng, Smart Mater. Struct., 2014, 23, 023001 Search PubMed.
- M. Singh, T. Gulamabbas, B. Ahumuza, N. P. Singh and V. Mishra, Aerospace Polymeric Materials, 2022, pp. 189–210 Search PubMed.
- Y. Chen, X. Zhao, Y. Li, Z. Y. Jin, Y. Yang, M. B. Yang and B. Yin, J. Mater. Chem. C, 2021, 9, 5515–5527 Search PubMed.
- J. A. C. Liu, J. H. Gillen, S. R. Mishra, B. A. Evans and J. B. Tracy, Sci. Adv., 2019, 5(8), eaaw2897 Search PubMed.
- J. Delaey, P. Dubruel, S. Van Vlierberghe, J. Delaey, P. Dubruel and S. Van Vlierberghe, Adv. Funct. Mater., 2020, 30, 1909047 CrossRef CAS.
- W. He, D. Zhou, H. Gu, R. Qu, C. Cui, Y. Zhou, Y. Wang, X. Zhang, Q. Wang, T. Wang and Y. Zhang, Macromol. Rapid Commun., 2023, 44, 2200553 CrossRef CAS PubMed.
- Y. Liu, F. Zhang, J. Leng, K. Fu, X. Lucas Lu, L. Wang, C. Cotton, B. Sun, B. Gu, T.-W. Chou, Y. Liu, B. Sun, B. Gu, K. Fu, X. L. Lu, L. Wang, T. Chou, F. Zhang and J. Leng, Adv. Mater. Technol., 2019, 4, 1900600 CrossRef CAS.
- Q. Peng, H. Wei, Y. Qin, Z. Lin, X. Zhao, F. Xu, J. Leng, X. He, A. Cao and Y. Li, Nanoscale, 2016, 8, 18042–18049 RSC.
- F. Guo, X. Zheng, C. Liang, Y. Jiang, Z. Xu, Z. Jiao, Y. Liu, H. T. Wang, H. Sun, L. Ma, W. Gao, A. Greiner, S. Agarwal and C. Gao, ACS Nano, 2019, 13, 5549–5558 CrossRef CAS PubMed.
- X. Gong, L. Liu, Y. Liu and J. Leng, Smart Mater. Struct., 2016, 25, 035036 Search PubMed.
- W. Jamnongpak, S. Tiptipakorn, H. Arumugam, K. Charoensuk, P. Karagiannidis and S. Rimdusit, Nanoscale Adv., 2024, 6, 499–510 RSC.
- C. Cai, Y. Zhang, M. Li, Y. Chen, R. Zhang, X. Wang, Q. Wu, T. Chen and P. Sun, RSC Adv., 2018, 8, 1225–1231 RSC.
- Y. Liu, G. Zhu, W. Liu, H. Liu, Y. Huo, T. Ren and X. Hou, Smart Mater. Struct., 2018, 27, 095008 Search PubMed.
- Z. Xu, C. Ding, D. W. Wei, R. Y. Bao, K. Ke, Z. Liu, M. B. Yang and W. Yang, ACS Appl. Mater. Interfaces, 2019, 11, 30332–30340 Search PubMed.
- G. Tian, G. Zhu, S. Xu and T. Ren, Smart Mater. Struct., 2019, 28, 105006 Search PubMed.
- S. Ishii, K. Uto, E. Niiyama, M. Ebara and T. Nagao, ACS Appl. Mater. Interfaces, 2016, 8, 5634–5640 CrossRef CAS PubMed.
- J. Lin, Z. Peng, Y. Liu, F. Ruiz-Zepeda, R. Ye, E. L. G. Samuel, M. J. Yacaman, B. I. Yakobson and J. M. Tour, Nat. Commun., 2014, 5(1), 1–8 Search PubMed.
- I. Lawan, P. Luengrojanakul, K. Charoensuk, H. Argunam, C. H. Ahn and S. Rimdusit, Nanoscale Adv., 2024, 6, 1556–1564 Search PubMed.
- K. K. Mentel, J. Manninen, V. M. Hiltunen, P. Myllyperkiö, A. Johansson and M. Pettersson, Nanoscale Adv., 2021, 3, 1431–1442 Search PubMed.
- J. Rodrigues, J. Zanoni, G. Gaspar, A. J. S. Fernandes, A. F. Carvalho, N. F. Santos, T. Monteiro and F. M. Costa, Nanoscale Adv., 2019, 1, 3252–3268 RSC.
- Y. Huang, L. Q. Tao, J. Yu, K. Zheng, G. Wang and X. Chen, IEEE Electron Device Lett., 2020, 41, 501–504 Search PubMed.
- I. Naseri, M. Ziaee, Z. N. Nilsson, D. R. Lustig and M. Yourdkhani, ACS Omega, 2022, 7, 3746–3757 CrossRef CAS PubMed.
- N. H. Barbhuiya, U. Misra and S. P. Singh, ACS Appl. Nano Mater., 2022, 5, 10991–11002 CrossRef CAS.
- Q. Wang, Y. C. Zhang, H. B. Sun, W. K. Zou, N. De Miao, S. L. Liu, Y. H. Jiao, Y. Q. Liu and D. D. Han, IEEE Photonics Technol. Lett., 2023, 35, 1167–1170 Search PubMed.
- Y. Peng, W. Zhao, F. Ni, W. Yu and X. Liu, ACS Nano, 2021, 15, 19490–19502 Search PubMed.
- H. Liu, K. Chen, R. Wu, S. Pan and C. Zhang, ACS Appl. Mater. Interfaces, 2023, 15, 46550–46558 Search PubMed.
- J. T. Li, M. G. Stanford, W. Chen, S. E. Presutti and J. M. Tour, ACS Nano, 2020, 14, 7911–7919 Search PubMed.
- T. Raza, M. K. Tufail, A. Ali, A. Boakye, X. Qi, Y. Ma, A. Ali, L. Qu and M. Tian, ACS Appl. Mater. Interfaces, 2022, 14, 54170–54181 Search PubMed.
- W. Wang, L. Lu, Z. Li, L. Lin, Z. Liang, X. Lu and Y. Xie, ACS Appl. Mater. Interfaces, 2022, 14, 1315–1325 CrossRef CAS PubMed.
- A. F. Carvalho, A. J. S Fernandes, C. Leitão, J. Deuermeier, A. C. Marques, R. Martins, E. Fortunato, F. M. Costa, A. F. Carvalho, A. J. S Fernandes, C. Leitão, F. M. Costa, J. Deuermeier, A. C. Marques, R. Martins and E. Fortunato, Adv. Funct. Mater., 2018, 28, 1805271 CrossRef.
- R. B. da Cunha, S. N. Cavalcanti, P. Agrawal, G. de Figueiredo Brito and T. J. A. de Mélo, J. Appl. Polym. Sci., 2023, 140, e54561 CrossRef CAS.
- T. Pinheiro, R. Correia, M. Morais, J. Coelho, E. Fortunato, M. G. F. Sales, A. C. Marques and R. Martins, ACS Nano, 2022, 16, 20633–20646 CrossRef CAS PubMed.
- E. R. Mamleyev, S. Heissler, A. Nefedov, P. G. Weidler, N. Nordin, V. V. Kudryashov, K. Länge, N. MacKinnon and S. Sharma, npj Flexible Electron., 2019, 3, 1–11 CrossRef CAS.
- J. D. Ferry, Viscoelastic Properties of Polymers, John Wiley & Sons, Canada, 1980 Search PubMed.
Footnote |
| † Electronic supplementary information (ESI) available. See DOI: https://doi.org/10.1039/d4na00450g |
| This journal is © The Royal Society of Chemistry 2024 |


