 Open Access Article
Bi-enzyme assay coupled with silver nanoplate transformation for insecticide detection†
Thitikan
Khampieng
a,
Kaneenard
Kewcharoen
a,
Tewarak
Parnklang
 b,
Sumana
Kladsomboon
c,
Orawon
Chailapakul
d and
Amara
Apilux
 *a
*a
aDepartment of Clinical Chemistry, Faculty of Medical Technology, Mahidol University,, 999 Phutthamonthon 4 Road, Salaya, Nakhon Pathom 73170, Thailand. E-mail: amara.apl@mahidol.ac.th
bDepartment of Industrial Chemistry, Faculty of Applied Science, King Mongkut's University of Technology North Bangkok, Bangkok 10800, Thailand
cDepartment of Radiological Technology, Faculty of Medical Technology, Mahidol University, 999 Phutthamonthon 4 Road, Salaya, Nakhon Pathom 73170, Thailand
dElectrochemistry and Optical Spectroscopy Center of Excellence, Department of Chemistry, Faculty of Science, Chulalongkorn University, Bangkok 10330, Thailand
First published on 14th October 2024
Abstract
A novel colorimetric method utilizing a bi-enzyme assay using silver nanoplates (AgNPls) as a direct signal source was developed to enable rapid insecticide detection. This innovative system leverages the in situ generated H2O2 from the consecutive enzyme-catalyzed reactions of acetylcholine hydrolysis and choline oxidation to introduce oxidative etching of AgNPls, transforming them into aggregated silver nanospheres (AgNSs). The morphological transformation of silver nanoparticles could be observed with the naked eye due to the solution's color shifts from pink-violet to blue-violet. The presence of insecticide, i.e., dichlorvos (DDVP), could inhibit acetylcholinesterase activity, thereby limiting H2O2 production and affecting the transformation of AgNPls into aggregated AgNSs. Furthermore, the extent of AgNPl-to-aggregated AgNS transformation and the subsequent solution's color change was inversely proportional to the amount of DDVP. Under optimal conditions, the developed bi-enzyme assay enables the quantification of DDVP within 5 minutes, achieving detection limits of 0.5 ppm and 0.1 ppm by naked-eye detection and UV-visible spectrophotometry, respectively. Furthermore, the practical application of this assay was validated for detecting insecticides in real vegetable samples, demonstrating both accuracy and reliability.
Introduction
Acetylcholine (ACh) is a key neurotransmitter involved in electrical signal transmission at nerve junctions and muscle contraction at neuromuscular junctions. It also plays a critical role in regulating the appropriate muscle functions throughout the body. Acetylcholinesterase (AChE) catalyzes the hydrolysis of ACh into the inactive metabolites, i.e., choline and acetate, within a microsecond following its action.1,2 However, in the presence of organophosphates (OP) and carbamates (CM) insecticides, i.e., specific inhibitors of AChE, the enzyme's catalytic activity is suppressed, inhibiting the hydrolysis of ACh.3,4 The accumulation of ACh in the synaptic space, known as a cholinergic crisis, triggers the continuous contraction of muscle, gland stimulation, and overaction of the central nervous system, potentially leading to paralysis and death due to respiratory failure.5–7 Dichlorvos (DDVP), a synthetic organophosphate AChE inhibitor, is widely used in household, industrial, and agricultural settings. DDVP is highly soluble in water and volatile. DDVP can enter the body through various routes including inhalation, skin contact, and ingestion.8 Given that DDVP exerts its toxic effects by irreversibly inhibiting neural acetylcholinesterase, stringent regulation of DDVP contamination is essential.9,10 Even trace levels of insecticides may lead to serious health issues, making the detection of insecticide residues critically important for food and environmental safety. Conventional techniques for detecting insecticide residues include gas/liquid chromatography-mass spectrometry (GC/LC-MS).11–13 While these methods offer high sensitivity and selectivity, they are time-consuming, require extensive sample pretreatment, and necessitate trained personnel and expensive equipment. Alternatively, numerous studies have leveraged the AChE inhibition by OP and CM insecticides as an analytical tool for screening insecticide residues in food and environment.14–18 The degree of AChE inactivation is directly proportional to the concentrations of these specific inhibitors, i.e., OP and CM insecticides.2,4,19–21A colorimetric method based on the principles of AChE enzymatic inhibition has been proposed as an alternative pesticide detection assay with the advantages of simplicity, rapidness, and cost-effectiveness.22–25 In comparison to other insecticide detection methods, including optical and electrochemical approaches, the colorimetric method offers significant advantages in ease of use and eliminating the need for complex platforms or multiple operational steps. Electrochemical methods, for instance, are often hindered by reagent instability and the requirement for sophisticated equipment, issues that the colorimetric approach successfully mitigates26,27 Recently, gold nanoparticles (AuNPs) and silver nanoparticles (AgNPs) have increasingly been employed in sensor applications due to their advantageous properties, including straightforward chemical fabrication, biocompatibility, stability, and high extinction coefficients.28–31 Recently, AuNPs and AgNPs have been applied to the detection of organophosphate and carbamate pesticides.32–39 The color changes associated with the morphological alterations of AuNPs and AgNPs caused by nanoparticle aggregation or oxidation could be distinguished by the naked eye. Additionally, the sensitivity and selectivity of organic compound detection could be amended by the surface functionalization of nanoparticles with specific ligands. Silver nanoplates (AgNPls) possess high extinction coefficients and could be readily oxidized and reduced at their surfaces.40–42 Moreover, the localized surface plasmon resonances (LSPRs) of AgNPls could be tuned across the visible spectrum by tailoring their morphology. Thus, AgNPls are proposed as appropriate nanomaterials for use in this study.
In the bi-enzyme assay, the performance of AChE-based colorimetric insecticide detection depends on the enzymatic activities of AChE and choline oxidase (ChO). ChO further oxidize choline in the presence of oxygen.43 AChE is preferentially inhibited by OP and CM insecticides. The by-product, i.e., hydrogen peroxide (H2O2) could be quantified indirectly via the redox reaction to determine AChE activity, which is inversely proportional to the insecticide concentration. At low concentrations of H2O2 and AgNPls, AgNPls could be disintegrated to silver nanospheres (AgNSs) through oxidative etching by H2O2.44 Additionally, at a low molar ratio of H2O2![[thin space (1/6-em)]](https://www.rsc.org/images/entities/char_2009.gif) :
:![[thin space (1/6-em)]](https://www.rsc.org/images/entities/char_2009.gif) AgNSs, H2O2 might also induce an aggregation of AgNSs.45 This study aimed to develop a simple and rapid colorimetric method for detecting OP and CM insecticides based on the inhibition of a bi-enzyme assay, coupled with H2O2-induced decomposition of AgNPls and subsequent H2O2-induced aggregation of AgNSs. The results demonstrated that, under the optimized detection conditions, the developed method could be employed for rapid, direct insecticide detection in vegetables.
AgNSs, H2O2 might also induce an aggregation of AgNSs.45 This study aimed to develop a simple and rapid colorimetric method for detecting OP and CM insecticides based on the inhibition of a bi-enzyme assay, coupled with H2O2-induced decomposition of AgNPls and subsequent H2O2-induced aggregation of AgNSs. The results demonstrated that, under the optimized detection conditions, the developed method could be employed for rapid, direct insecticide detection in vegetables.
Experimental
Chemical and reagents
AgNPls with average lateral lengths of 45 and 50 nm were synthesized following the procedure outlined in previous work.45 Briefly, silver nitrate (AgNO3) in a starch solution was injected into a NaBH4 solution and stirred vigorously until a bright yellow colloidal solution was obtained. Subsequently, H2O2 solution was introduced to generate AgNPls from AgNSs. Particle size was determined using transmission electron microscopy (TEM), with lateral length measured directly from TEM micrographs using ImageJ software. A minimum of 250 particles were selected from 10–30 representative TEM micrographs for analysis. The 45 nm AgNPls and 50 nm AgNPls exhibited average particle sizes of 45.0 ± 6.3 nm and 50.4 ± 6.4 nm, respectively. The size distribution for the 45 nm ranged from 24.5 to 60.6 nm, while that of the 50 nm AgNPls ranged from 39.9 to 66.3 nm.The stock solution of AgNPls was diluted with Milli-Q water to achieve concentrations of 50, 100, and 150 ppm. The diluted solutions were stored at room temperature and protected from light until use in subsequent experiments. AChE from Electrophorus electricus (electric eel) EC 3.1.1.7, ChO from Alcaligenes sp. (15 U mg−1 solid), acetylcholine chloride, and 30% (w/w) H2O2 solution were purchased from Sigma-Aldrich®. Sodium dihydrogen phosphate (NaH2PO4) was purchased from BDH Prolabo (Lutterworth, UK). All chemicals and reagents were analytical grade. Milli-Q water (18 MΩ cm) was used for the preparation of all solutions in this study.
Reagent preparations
The stock solution of AChE (5000 U mL−1) was diluted to prepare solutions with concentrations of 500, 1000, and 2500 U mL−1. ChO solutions with concentrations of 1, 5, 10, 20, and 40 U mL−1 were prepared from a stock ChO solution of 80 U mL−1. All Enzyme solutions were stored at −20 °C. Substrate solutions were prepared by diluting 500 mM ACh stock solution to final concentrations of 10, 25, 50, 75, 100, and 250 mM and were stored at 4 °C until use in experiments.Absorbance measurements
UV-visible spectra of the sample solutions were acquired using a Nanodrop 2000 spectrophotometer (Thermo Fisher Scientific Inc., USA).Effects of AgNPl sizes on H2O2 detection
Firstly, 5 μL of H2O2 solutions at concentrations of 0.5, 1.0, and 5.0 mM were injected into microtubes. Subsequently, 3 μL of 45 nm or 50 nm AgNPl solution at a fixed concentration of 150 ppm was introduced and thoroughly mixed. The reaction mixtures were then incubated for 5 minutes, after which the absorbance was measured.Optimization of bi-enzyme assay conditions
![[thin space (1/6-em)]](https://www.rsc.org/images/entities/char_2009.gif) :
:![[thin space (1/6-em)]](https://www.rsc.org/images/entities/char_2009.gif) 1 volume ratio. Then, 6 μL of 50 mM ACh was added to 6 μL of the bi-enzyme solution. The mixture was mixed until homogeneous and subsequently incubated at room temperature (RT) for 15 minutes. Following incubation, the solution was mixed with the AgNPl solution at the specified concentration and incubated for an additional 5 minutes. Finally, the absorbance of the final solution was measured.
1 volume ratio. Then, 6 μL of 50 mM ACh was added to 6 μL of the bi-enzyme solution. The mixture was mixed until homogeneous and subsequently incubated at room temperature (RT) for 15 minutes. Following incubation, the solution was mixed with the AgNPl solution at the specified concentration and incubated for an additional 5 minutes. Finally, the absorbance of the final solution was measured.
![[thin space (1/6-em)]](https://www.rsc.org/images/entities/char_2009.gif) :
:![[thin space (1/6-em)]](https://www.rsc.org/images/entities/char_2009.gif) 1. Typically, 6 μL of 50 mM ACh was added to 6 μL of the prepared bi-enzyme solution, thoroughly mixed, and incubated at RT for 15 minutes. Subsequently, the solution was combined with 150 ppm AgNPls and further incubated for an additional 5 minutes. Finally, the absorbance of the mixture was measured.
1. Typically, 6 μL of 50 mM ACh was added to 6 μL of the prepared bi-enzyme solution, thoroughly mixed, and incubated at RT for 15 minutes. Subsequently, the solution was combined with 150 ppm AgNPls and further incubated for an additional 5 minutes. Finally, the absorbance of the mixture was measured.
![[thin space (1/6-em)]](https://www.rsc.org/images/entities/char_2009.gif) :
:![[thin space (1/6-em)]](https://www.rsc.org/images/entities/char_2009.gif) 1 volume ratio. Then, 6 μL of 50 mM ACh was added to 6 μL of the bi-enzyme solution, thoroughly mixed, and incubated at RT for 15 minutes. The solution was then combined with 150 ppm AgNPls and incubated for an additional 5 minutes. Finally, the absorbance of the mixture was measured.
1 volume ratio. Then, 6 μL of 50 mM ACh was added to 6 μL of the bi-enzyme solution, thoroughly mixed, and incubated at RT for 15 minutes. The solution was then combined with 150 ppm AgNPls and incubated for an additional 5 minutes. Finally, the absorbance of the mixture was measured.
![[thin space (1/6-em)]](https://www.rsc.org/images/entities/char_2009.gif) :
:![[thin space (1/6-em)]](https://www.rsc.org/images/entities/char_2009.gif) 1 volume ratio) was mixed with 6 μL of ACh at varying concentrations of 0, 10, 25, 50, 75, 100, and 250 mM and incubated at RT for 15 minutes. The solution was subsequently combined with 150 ppm AgNPls and incubated for an additional 5 minutes. Finally, the absorbance of the mixture was measured.
1 volume ratio) was mixed with 6 μL of ACh at varying concentrations of 0, 10, 25, 50, 75, 100, and 250 mM and incubated at RT for 15 minutes. The solution was subsequently combined with 150 ppm AgNPls and incubated for an additional 5 minutes. Finally, the absorbance of the mixture was measured.
Bi-enzyme assay coupled with AgNPls for insecticide detection
Dichlorvos (DDVP) at concentrations of 0, 0.1, 0.5, 1, 2.5, 5, 7.5, and 10 ppm was employed as a model for insecticide detection. The detection was carried out under the optimized assay conditions. Six microliters of the bi-enzyme solution containing 500 U per mL AchE and 40 U per mL ChO (in a 1![[thin space (1/6-em)]](https://www.rsc.org/images/entities/char_2009.gif) :
:![[thin space (1/6-em)]](https://www.rsc.org/images/entities/char_2009.gif) 1 volume ratio) were pre-mixed with 3 μL of DDVP and incubated at RT for 15 minutes. Subsequently, 3 μL of 250 mM ACh was added as the substrate for the enzymatic reaction, and the solution was incubated at RT for an additional 5 minutes. Finally, 150 ppm AgNPls were added, and the absorbance of the final solution was measured after a further 5 minute incubation.
1 volume ratio) were pre-mixed with 3 μL of DDVP and incubated at RT for 15 minutes. Subsequently, 3 μL of 250 mM ACh was added as the substrate for the enzymatic reaction, and the solution was incubated at RT for an additional 5 minutes. Finally, 150 ppm AgNPls were added, and the absorbance of the final solution was measured after a further 5 minute incubation.
Detection of insecticide residues in real samples
To evaluate the feasibility of the assay, the optimized detection conditions were applied to real samples, including lettuce and choy. These vegetable samples were initially screened for insecticide residues by gas chromatography-tandem mass spectrometry (GC-MS/MS) (Bruker SCION Triple Quadrupole Detector, Germany) with the QuEChERS (Quick, Easy, Cheap, Effective, Rugged, and Safe) sample preparation method.46 The insecticide-free vegetables were then spiked with standard DDVP (at a ratio of 1 mL g−1) to achieve concentrations of 1 and 5 mg DDVP per kg sample. After 24 hours of incubation, 1 g of the DDVP-spiked lettuce and choy leaves were chopped and immersed in 20 mM PBS with 20% ethanol at pH 7.4. The supernatant was subsequently analyzed for insecticide residues as described in the previous section.Results and discussion
The effects of AgNPl sizes on H2O2 detection
A broad range of color changes could be observed in AgNPls due to simultaneous variations in size and shape.47 The initial particle size of AgNPls may also influence the sensitivity of H2O2 detection. Accordingly, the synthesized 45 nm and 50 nm AgNPls were first evaluated for H2O2 detection. The change in absorbance (ΔA) was employed to assess the effectiveness of H2O2 detection and was calculated using eqn (1):| ΔA = Atest − Ablank | (1) |
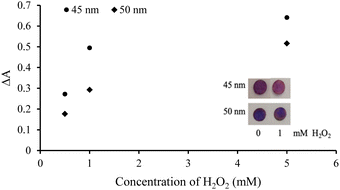
As the concentrations of H2O2 increased, the ΔA values for both AgNPls increased due to the oxidative etching of the nanoplates, as illustrated in Fig. 1. A greater ΔA was observed for the 45 nm AgNPls, likely attributable to their higher extinction coefficients and surface-to-volume ratio, which facilitate interactions with analyte molecules. H. Shim and M. H. Kim similarly reported the extinction of silver nanoprisms exposed to sodium bromide at different reaction intervals, finding that the extinction of etched silver nanoprisms with absorption maxima at 560–570 nm was lower than that of those with absorption maximum at 540–550 nm.48 Specifically, the 45 nm AgNPls may exhibit a higher extinction coefficient than the 50 nm AgNPls due to particle rounding. However, the optical properties of AgNPls are influenced by multiple factors, including size, shape, degree of tip snipping, aspect ratio, and dispersing medium. Consequently, the extinction coefficient of size- or shape-specific AgNPls has never been reported. Existing studies primarily focus on the extinction coefficients of spherical nanoparticles which can be synthesized with high uniformity.49
The results indicated that 45 nm AgNPls exhibited greater sensitivity for H2O2 detection compared to 50 nm AgNPls. Consequently, 45 nm AgNPls were selected for further experiments.
Optimization of bi-enzyme assay conditions
The bi-enzyme assay utilized consecutive enzymatic reactions: the ACh hydrolysis catalyzed by AChE and the choline oxidation catalyzed by ChO, as shown in eqn (2) and (3), respectively. | (2) |
 | (3) |
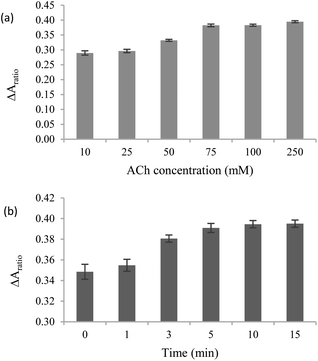
The in situ generated H2O2 could be utilized for successive AgNPl etching and AgNS aggregation. To maximize the efficiency of the proposed assay, several sensing parameters, including concentrations of AgNPls, AChE, ChO, and ACh were systematically optimized.
The assay principle is illustrated in Scheme 1. First, the in situ generated H2O2 from the bi-enzyme reaction was utilized to oxidatively etch AgNPls to AgNSs. Subsequently, H2O2-induced aggregation caused the AgNSs to recombine to a plate-like shape. In the presence of OP or CM insecticides, the AChE activity was suppressed, preventing the generation of H2O2, consequently, no morphological changes occurred in the AgNPls. The transformation of AgNPls in the bi-enzyme assay was confirmed by transmission electron micrographs, as shown in Fig. 2(a), which were transformed to Fig. 2(b). Partial etching of AgNPls occurred when insecticides were present in the bi-enzyme system, resulting in a mixture of etched AgNPls and AgNSs, as shown in Fig. 2(c). The effects of H2O2 were limited to the etching of AgNPls to small AgNSs without the dissolution of the generated nanospheres. From the TEM micrograph shown in Fig. 2(b), AgNSs aggregation could be observed on the surfaces of the AgNPls. This observation conveys a clue to the H2O2 etching on starch-stabilized AgNPls that it might preferentially occur on the [111] facets of AgNPls.
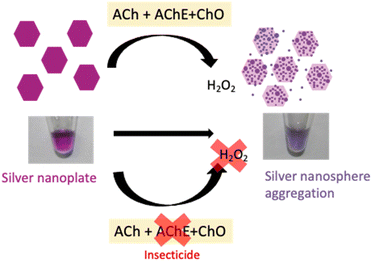 | ||
| Scheme 1 Illustration of the bi-enzyme assay for insecticide detection based on AgNPl transformation. | ||
 | ||
| Fig. 2 TEM images of (a) pristine AgNPls, (b) AgNPls after the bi-enzyme assay, and (c) AgNPls after the bi-enzyme assay with 5 ppm DDVP. | ||
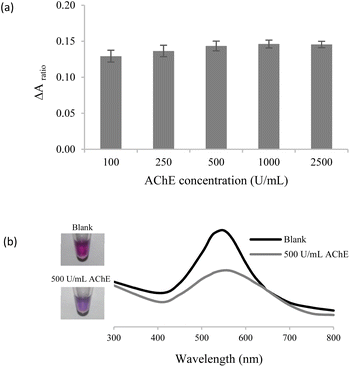
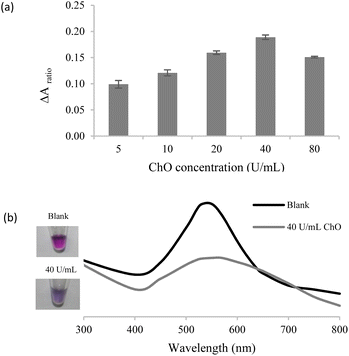
This is possible because starch molecules do not show preferential adsorption on specific silver crystal facets.49 The reduction in maximum extinction intensity at 550 nm for the initial AgNPls, following the bi-enzyme reaction, indicates that some AgNPls were completely etched into nanospheres during the reaction. Additionally, the redshift of the AgNPls to 570 nm after the bi-enzyme reaction may be attributed to an increase in the aspect ratio of the remaining AgNPls,50 due to a decrease in their thickness. Aggregation of the generated AgNSs post bi-enzyme reaction was observed from as a shoulder peak, corresponding to the multipolar plasmon resonance modes at 430–450 nm. Multiple transformations of AgNPl shapes have also been reported in the colorimetric detection of xanthine in human plasma and fish meat using AgNPls.51
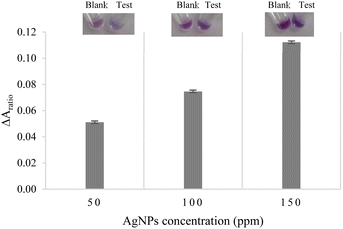
The digital photographs of the sensing solutions, as shown in the insets of Fig. 3, clearly demonstrate that the color of the control tube without ACh and the test tube with ACh was distinguishable when 150 ppm AgNPls was used. The effectiveness of the bi-enzyme assay was evaluated by the difference in the absorbance ratio, i.e., ΔAratio,as defined in eqn (4)
 | (4) |
Determination of insecticide residues using the optimized bi-enzyme assay
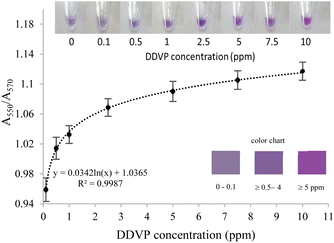
To evaluate the performance of the developed assay, dichlorvos or 2,2-dichlorovinyl dimethyl phosphate (DDVP) was used as a representative insecticide. The effects of DDVP on the bi-enzyme assay were examined at various concentrations, including 0, 0.1, 0.5, 1, 2.5, 5, and 10 ppm, as shown in Fig. 7. Under optimal conditions, DDVP concentration as low as 0.1 ppm induced a color shift in the sensing solution from pink-violet to blue-violet, which was clearly observable to the naked eye. When DDVP concentrations exceeded 5 ppm, the pink-violet color of the bi-enzyme solutions remained unchanged. This phenomenon could be attributed to AChE inhibition by DDVP, resulting in decreased H2O2 production and, consequently, suppressed oxidation of AgNPls. The lowest DDVP concentration detectable by the naked eye was 0.5 ppm.For quantitative analysis using UV-visible spectrophotometry, a standard curve was constructed between the A550/A570 ratio and the logarithmic concentration of DDVP in the range of 0.1–10 ppm (Fig. S1†). The limit of detection (LOD) was calculated as 0.1 ppm, using the formula LOD = 3SD/slope. This calculated LOD was sufficiently low for the screening of insecticide residues in contaminated agricultural products. The maximum residue limits for pesticides, as established by the governments of Thailand and Japan, are 0.2 ppm for citrus fruits, rice, and grains and 0.1 ppm for leafy vegetables.52,53
Detection of DDVP insecticide residues in real samples
The analytical and practical performance of the developed bi-enzyme assay for insecticide detection was further evaluated using lettuce and choy as representative vegetable samples. The insecticide-free samples were verified using GC-MS/MS. The confirmed DDVP-negative vegetables were spiked with DDVP at concentrations of 1 and 5 mg kg−1. The results are presented in Table 1. For naked-eye detection, the color of the sensing solution was compared to the color chart shown in the insets of Fig. 7. By visual observation, the DDVP residue levels in the lettuce and choy samples were estimated to be in range of ≥0.5–4 ppm and ≥5 ppm for the spiked concentrations of 1 and 5 ppm, respectively. Moreover, the short analysis time of approximately 5 minutes enhances its applicability for routine screening purposes.Using UV-visible spectrophotometric measurements, DDVP concentrations in lettuce samples spiked with 1 ppm and 5 ppm DDVP were quantified as 1.3 ppm and 4.1 ppm, respectively. For choy samples, DDVP levels were determined to be 1.2 ppm and 4.7 ppm for the respective spiked concentrations of 1 ppm and 5 ppm. The analytical recovery ranged from 82% to 120%, with relative standard deviation (RSD) values between 5.5% and 9.8%, confirming both accuracy and reliability. The developed bi-enzyme assay demonstrates significant potential for insecticide detection, offering simplicity and rapid results compared to previous enzyme-based colorimetric methods. Further verification across a wider range of insecticide residues and real-world samples would encourage broader applicability and robustness.
Conclusions
The bi-enzyme assay coupled with silver nanoplates (AgNPls) has demonstrated significant efficacy for the colorimetric detection of insecticide residues. AgNPls underwent the pink-violet to blue-violet color transition when reacted with the in situ generated H2O2 from the bi-enzyme reaction. The underlying sensing mechanism hinges on the unique morphological decomposition pathway of AgNPls characterized by the oxidation of AgNPls and the subsequent plate-like aggregation of generated silver nanospheres. Under the optimized conditions, this assay could detect the model DDVP insecticide residues at concentrations as low as 0.5 and 0.1 ppm by the naked eye and UV-visible spectrophotometry, respectively. The simplicity and practicality of this assay make it an affordable solution for on-site testing, with results readily observable within approximately 5 minutes.Moreover, the bi-enzyme assay has been successfully applied to real samples including lettuce and choy. The analytical recovery ranged from 82 to 120% and the relative standard deviations (RSD) between 5.5% and 9.8% were within the acceptable ranges. These results underscore the assay's reliability and accuracy. The developed bi-enzyme assay coupled with AgNPls presents a compelling, rapid, and cost-effective method for screening of insecticide residues in agricultural products.
Data availability
The data supporting this article have been included as part of the ESI.†Author contributions
Thitikan Khampieng: validation, formal analysis, writing – original draft, writing – review & editing. Kaneenard Kewcharoen: investigation, validation. Tewarak Parnklang: resources, writing – review & editing. Sumana Kladsomboon: writing – review & editing. Orawon Chailapakul: supervision. Amara Apilux: conceptualization, methodology, formal analysis, writing – original draft, project administration, supervision.Conflicts of interest
There are no conflicts to declare.Acknowledgements
This project is funded by National Research Council of Thailand (NRCT): No. N41A640073. The authors gratefully appreciate research project support by Mahidol University.References
- S. F. McHardy, H.-Y. L. Wang, S. V McCowen and M. C. Valdez, Expert Opin. Ther. Pat., 2017, 27, 455–476 CrossRef.
- V. Dhull, A. Gahlaut, N. Dilbaghi and V. Hooda, Biochem. Res. Int., 2013, 2013, 731501 CrossRef.
- W. N. Aldridge and A. N. Davison, Biochem. J., 1953, 55, 763 CrossRef PubMed.
- Y. Boublik, P. Saint-Aguet, A. Lougarre, M. Arnaud, F. Villatte, S. Estrada-Mondaca and D. Fournier, Protein Eng., 2002, 15, 43–50 CrossRef.
- J. Bajgar, Adv. Clin. Chem., 2004, 38, 151–216 Search PubMed.
- W. J. Donarski, D. P. Dumas, D. P. Heitmeyer, V. E. Lewis and F. M. Raushel, Biochemistry, 1989, 28, 4650–4655 CrossRef PubMed.
- S. Chapalamadugu and G. R. Chaudhry, Crit. Rev. Biotechnol., 1992, 12, 357–389 CrossRef PubMed.
- H. U. Okoroiwu and I. A. Iwara, Interdiscip. Toxicol., 2018, 11, 129–137 CrossRef.
- J. Wang, C. Timchalk and Y. Lin, Environ. Sci. Technol., 2008, 42, 2688–2693 CrossRef.
- H. Dvir, I. Silman, M. Harel, T. L. Rosenberry and J. L. Sussman, Chem. Biol. Interact., 2010, 187, 10–22 CrossRef PubMed.
- Y.-S. Su and J.-F. Jen, J. Chromatogr. A, 2010, 1217, 5043–5049 CrossRef PubMed.
- L.-J. Qu, H. Zhang, J.-H. Zhu, G.-S. Yang and H. Y. Aboul-Enein, Food Chem., 2010, 122, 327–332 CrossRef.
- M. Stoytcheva and R. Zlatev, Pestic. Mod. World-Trends Pestic. Anal., ed. M. Stoytcheva, InTech, Croacia, 2011, pp. 143–164 Search PubMed.
- A. Apilux, C. Isarankura-Na-Ayudhya, T. Tantimongcolwat and V. Prachayasittikul, EXCLI J., 2015, 14, 307 Search PubMed.
- M. E. I. Badawy and A. F. El-Aswad, Int. J. Anal. Chem., 2014, 1, 536823 Search PubMed.
- C. S. Pundir and N. Chauhan, Anal. Biochem., 2012, 429, 19–31 CrossRef PubMed.
- N. Nagatani, A. Takeuchi, M. A. Hossain, T. Yuhi, T. Endo, K. Kerman, Y. Takamura and E. Tamiya, Food Control, 2007, 18, 914–920 CrossRef.
- H.-Y. No, Y. A. Kim, Y. T. Lee and H.-S. Lee, Anal. Chim. Acta, 2007, 594, 37–43 CrossRef PubMed.
- G. L. Turdean, I. C. Popescu, L. Oniciu and D. R. Thevenot, J. Enzyme Inhib. Med. Chem., 2002, 17, 107–115 CrossRef PubMed.
- I. Palchetti, A. Cagnini, M. Del Carlo, C. Coppi, M. Mascini and A. P. F. Turner, Anal. Chim. Acta, 1997, 337, 315–321 CrossRef.
- P. Skládal, G. S. Nunes, H. Yamanaka and M. L. Ribeiro, Electroanalysis, 1997, 9, 1083–1087 CrossRef.
- I. S. Che Sulaiman, B. W. Chieng, M. J. Osman, K. K. Ong, J. I. A. Rashid, W. M. Z. Wan Yunus, S. A. M. Noor, N. A. M. Kasim, N. A. Halim and A. Mohamad, Microchim. Acta, 2020, 187, 1–22 CrossRef PubMed.
- R. Umapathi, S. Sonwal, M. J. Lee, G. M. Rani, E.-S. Lee, T.-J. Jeon, S.-M. Kang, M.-H. Oh and Y. S. Huh, Coord. Chem. Rev., 2021, 446, 214061 CrossRef CAS.
- J. Kaur, D. Bandyopadhyay and P. K. Singh, J. Mol. Liq., 2022, 347, 118258 CrossRef CAS.
- D.-M. Liu, B. Xu and C. Dong, Trac. Trends Anal. Chem., 2021, 142, 116320 CrossRef CAS.
- T. O. Hara and B. Singh, ACS ES&T Water, 2021, 1, 462–478 Search PubMed.
- N. I. M. Fauzi, Y. W. Fen, N. A. S. Omar and H. S. Hashim, Sensors, 2021, 21, 3856 CrossRef CAS PubMed.
- P. K. Jain, X. Huang, I. H. El-Sayed and M. A. El-Sayed, Plasmonics, 2007, 2, 107–118 CrossRef.
- Z. Wang and L. Ma, Coord. Chem. Rev., 2009, 253, 1607–1618 CrossRef.
- E. C. Le Ru, C. Galloway and P. G. Etchegoin, Phys. Chem. Chem. Phys., 2006, 8, 3083–3087 RSC.
- W. Zhao, M. A. Brook and Y. Li, ChemBioChem, 2008, 9, 2363–2371 CrossRef PubMed.
- M. Wang, X. Gu, G. Zhang, D. Zhang and D. Zhu, Langmuir, 2009, 25, 2504–2507 CrossRef PubMed.
- F. Bossler, L. Weyrauch, R. Schmidt and E. Koos, Colloids Surf., A, 2017, 518, 85–97 CrossRef PubMed.
- E. N. Esimbekova, V. P. Kalyabina, K. V Kopylova, I. G. Torgashina and V. A. Kratasyuk, Talanta, 2021, 233, 122509 CrossRef CAS PubMed.
- Z. Li, Y. Wang, Y. Ni and S. Kokot, Sensor. Actuator. B Chem., 2014, 193, 205–211 CrossRef CAS.
- S. Wu, D. Li, J. Wang, Y. Zhao, S. Dong and X. Wang, Sensor. Actuator. B Chem., 2017, 238, 427–433 CrossRef.
- R. Chadha, A. Das, J. Lobo, V. O. Meenu, A. Paul, A. Ballal and N. Maiti, Colloids Surf., A, 2022, 641, 128558 CrossRef.
- M. L. Satnami, J. Korram, R. Nagwanshi, S. K. Vaishanav, I. Karbhal, H. K. Dewangan and K. K. Ghosh, Sensor. Actuator. B Chem., 2018, 267, 155–164 CrossRef.
- T. Yaseen, H. Pu and D.-W. Sun, Talanta, 2019, 196, 537–545 CrossRef PubMed.
- N. Poosinuntakul, T. Parnklang, T. Sitiwed, S. Chaiyo, S. Kladsomboon, O. Chailapakul and A. Apilux, Microchem. J., 2020, 158, 105101 CrossRef.
- T. Parnklang, B. Lamlua, H. Gatemala, C. Thammacharoen, S. Kuimalee, B. Lohwongwatana and S. Ekgasit, Mater. Chem. Phys., 2015, 153, 127–134 CrossRef.
- E. Detsri, P. Seeharaj and C. Sriwong, Colloids Surf., A, 2018, 541, 36–42 CrossRef CAS.
- N. Xia, Q. Wang and L. Liu, Sensors, 2014, 15, 499–514 CrossRef PubMed.
- K. Nitinaivinij, T. Parnklang, C. Thammacharoen, S. Ekgasit and K. Wongravee, Anal. Methods, 2014, 6, 9816–9824 RSC.
- T. Parnklang, C. Lertvachirapaiboon, P. Pienpinijtham, K. Wongravee, C. Thammacharoen and S. Ekgasit, RSC Adv., 2013, 3, 12886–12894 RSC.
- S. Wanwimolruk, O. Kanchanamayoon, K. Phopin and V. Prachayasittikul, Sci. Total Environ., 2015, 532, 447–455 CrossRef CAS PubMed.
- A. Apilux, W. Siangproh, N. Praphairaksit and O. Chailapakul, Talanta, 2012, 97, 388–394 CrossRef CAS PubMed.
- H. Shim and M. H. Kim, Mol. Cryst. Liq. Cryst., 2023, 758, 135–139 CrossRef CAS.
- D. Paramelle, A. Sadovoy, S. Gorelik, P. Free, J. Hobley and D. G. Fernig, Analyst, 2014, 139, 4855–4861 RSC.
- P. Raveendran, J. Fu and S. L. Wallen, J. Am. Chem. Soc., 2003, 125, 13940–13941 CrossRef CAS PubMed.
- P. Yang, H. Portales and M.-P. Pileni, J. Phys. Chem. C, 2009, 113, 11597–11604 CrossRef CAS.
- Thai Agricultural Standard (TAS 9002-2013), Pesticide Residues: Maximum Residue Limits, National Bureau of Agricultural Commodity and Food Standards, Ministry of Agriculture and Cooperatives, Thailand, 2016, https://www.acfs.go.th/#/.
- The Japan Food Chemical Research Foundation, MRLs of agricultural chemicals, feed additives and veterinary drugs in food, https://www.ffcr.or.jp/en/zanryu/mrls-of-agricultural-chemicals-feed-additives-and-veterinary-drugs-in-food/-revision-of-mrls-of-agricultural-chemicals-feed-additives-and-veterinary-drugs-in-foods-september-1.html.
Footnote |
| † Electronic supplementary information (ESI) available: The logarithmic scale of DDVP standard curve. See DOI: https://doi.org/10.1039/d4na00585f |
| This journal is © The Royal Society of Chemistry 2024 |

