 Open Access Article
Chirality governs the structure and activity changes of Photinus pyralis firefly luciferase induced by carbon quantum dots†
Mehrnaz
Rad-Faraji‡
a,
Marziyeh
Mousazadeh‡
a,
Maryam
Nikkhah
 *a,
Sajad
Moradi
b,
Mohabbat
Ansari
c,
Klara
Cepe
d,
Saman
Hosseinkhani
 e and
Aram
Rezaei
 *b
*b
aDepartment of Nanobiotechnology, Faculty of Biological Sciences, Tarbiat Modares University, P. O. Box: 14115-154, Tehran, Iran. E-mail: m_nikkhah@modares.ac.ir
bNano Drug Delivery Research Center, Health Technology Institute, Kermanshah University of Medical Sciences, Kermanshah, Iran. E-mail: aram.rezaei@gmail.com; aram.rezaei@kums.ac.ir
cDepartment of Tissue Engineering and Applied Cell Science, School of Advanced Technologies in Medicine, Shahid Beheshti University of Medical Sciences, Tehran, Iran
dRegional Centre of Advanced Technologies and Materials, Palacký University, Olomouc, Czech Republic
eDepartment of Biochemistry, Faculty of Biological Sciences, Tarbiat Modares University, P. O. Box: 14115-154, Tehran, Iran
First published on 24th September 2024
Abstract
Nanobiocatalysis is a novel area integrating various advantages of nanotechnology and enzymatic catalysis. However, great efforts are still needed to fully understand the interactions between nanostructures and enzymes. The biological properties of nano-hybrid enzymes greatly depend on the size and chemical properties of their nano element. However, the impact of nanostructure chirality on the structure/function of the enzymes has not yet been fully investigated. In this study, using experimental and computational approaches, the interaction of Photinus pyralis firefly luciferase with chiral carbon quantum dots containing L and D-tryptophan constituent (L/D-Trp–CQDs) was investigated. Both the CQDs increased Km of the enzyme for luciferin and resulted in the loss of luciferase activity dose-dependently with more profound effects for D-Trp–CQDs. D-Trp–CQD treatment had significantly increased Km of the enzyme for ATP (3.5 fold) compared to the untreated enzyme. The changes in the secondary structure of luciferase upon interaction with D-Trp–CQDs were more drastic compared to L-Trp–CQDs, as determined by circular dichroism spectroscopy. Molecular dynamic simulation further confirmed higher conformational changes of luciferase induced by D-Trp–CQDs compared to L-Trp–CQDs. D-Trp–CQD has led to conformational changes of several amino acids involved in the active site, substrate binding site and the flexible loop of luciferase (352–359 residues) that governs the activity of luciferase.
Introduction
Chirality, the property of asymmetry, holds fascinating significance in the realm of biological molecules. It is a remarkable attribute that distinguishes mirror-image isomers, known as enantiomers, within a molecular structure.1 Chirality plays an indispensable role in various biological processes, including protein folding, enzyme catalysis, drug interactions, and molecular recognition.2 The exquisite three-dimensional arrangement of chiral molecules governs their specific interactions with other molecules, such as receptors, enzymes, and DNA.3 Understanding and harnessing the power of chirality opens vast opportunities for designing innovative drugs, developing new materials, and unraveling the mysteries of life's fundamental building blocks. Incorporating chirality into nanoscale materials represents a cutting-edge approach that enables precise control over the properties and functions of these materials.4,5Carbon quantum dots (CQDs) are nanomaterials composed of carbon atoms organized in a crystalline lattice structure.6–10 Chiral CQDs present a cutting-edge advancement in the field of nanomaterials with significant implications for biological applications. Chiral CQDs have demonstrated remarkable potential in areas such as chiral catalysts, chiral sensing, enantioselective drug delivery, and bioimaging with enhanced selectivity.11,12 Their ability to interact selectively with biomolecules and discriminate between enantiomers opens new avenues for targeted therapies, sensitive detection, and understanding of complex biological systems. Recent studies have uncovered a range of biological effects associated with the chirality of CQDs. For instance, Nie and colleagues conducted a successful synthesis of cysteine-based CQDs (L-/D-Cys–CQDs) to examine the influence of chirality on cellular energy metabolism. Their findings revealed that L-Cys–CQDs and D-Cys–CQDs differently regulated glycolysis in human bladder cancer T24 cells.13 Kang's group reported that D-Cys–CQDs exhibited greater efficacy in enhancing root vigor and the activity of the Rubisco enzyme in bean sprouts compared to L-Cys–CQDs. This suggests that the D-enantiomer has the potential to improve photosynthesis and glucose accumulation in mung bean plants, making it a viable candidate for agricultural fertilizers. Chiral CQDs derived from either L-lysine or D-lysine exhibit the ability to regulate the aggregation and cytotoxicity of amyloid beta-42 (Aβ42), the principal component found in amyloid plaques linked to Alzheimer's disease. Specifically, L-Lys–CQDs exert a profound influence on the secondary structure and fibril morphologies of Aβ42, resulting in significant remodeling.14 In this line, L-/D-aspartic acid, serving as a chiral carbon source, was employed to synthesize L-/D-Asp–CQDs using a microwave technique. Interestingly, D-Asp–CQDs exhibited a notable enhancement effect on the amyloid fibrillation of Bovine Serum Albumin (BSA) compared to L-Asp–CQDs.15 In a study by Ma et al.L-Asp–CDs were reported as a stronger inhibitor for tyrosinase enzyme compared to D-Asp–CDs16D-Cys–CDs have been reported to improve laccase activity while L-Cys–CDs had no effect on it.17 In another study done by Wang et al., L-Trp–CDs were shown to inhibit laccase activity significantly more than D-Trp–CDs.18
Recent investigations have provided compelling evidence regarding the ability of chiral CQDs to induce significant alterations in the secondary structure of proteins such as glucose oxidase (GOx). This phenomenon leads to enhanced activity of chiral CQDs–GOx nanoreactors known as LGOx and DGOx, which have demonstrated improved efficacy in delivering GOx to cancer cells. Notably, DGOx exhibits higher enzymatic activity compared to LGOx.19 In a separate study, chiral CQDs derived from citric acid exhibited different inhibition rates on laccase activity.20 Chiral CQDs synthesized using citric acid and L/D-aspartic acid demonstrated distinct behaviors. L-Asp–CQDs exerted an irreversible inhibitory effect on the active site of copper tyrosinase, whereas D-Asp–CQDs exhibited a reversible inhibitory effect on the same enzyme. Zhang's group synthesized chiral CQDs from glutamic acid using an electrolytic method and observed that D-Glu–CQDs exhibited higher inhibitory efficiency against maltase activity compared to L-Glu–CQDs.21
This study, by experimental and computational approaches, investigates the influence of chirality on the structure and activity changes of luciferase enzyme upon interaction with CQDs. The effect of different functional groups on the surface of CQDs on luciferase enzyme was reported earlier.22 Experimental findings indicated that chiral CQDs (L-Trp–CQDs and D-Trp–CQDs) have significantly different effects on enzyme activity. Molecular dynamics simulations demonstrated that the chirality of carbon-based nanomaterials profoundly influences the mechanism of the nanoparticle–protein interactions.
Materials and methods
Chemicals and materials
Tris–HCl, MgSO4, D-luciferin, ATP, and dialysis bags (MWCO 100 Da and 12![[thin space (1/6-em)]](https://www.rsc.org/images/entities/char_2009.gif) 000 Da) were obtained from Sigma-Aldrich (https://www.sigmaaldrich.com). Citric acid, L-tryptophan, and D-tryptophan were provided by Merck, Germany (https://www.merckmillipore.com). The Ni–NTA-Sepharose affinity column was from Qiagen (https://www.qiagen.com/us/). All the aqueous solutions were prepared using deionized water.
000 Da) were obtained from Sigma-Aldrich (https://www.sigmaaldrich.com). Citric acid, L-tryptophan, and D-tryptophan were provided by Merck, Germany (https://www.merckmillipore.com). The Ni–NTA-Sepharose affinity column was from Qiagen (https://www.qiagen.com/us/). All the aqueous solutions were prepared using deionized water.
CQD preparation
Citric acid as the source of carbon was used for the synthesis of CQDs through a one-pot hydrothermal method. At first, 0.1 mmol of citric acid monohydrate (CA) was dissolved in 15 ml of deionized water and the pH was set to 9. To prepare the water-soluble chiral CQDs, 20.4 mg (0.1 mmol) of L-tryptophan (for synthesizing L-Trp–CQDs) or 20.4 mg (0.1 mmol) of D-tryptophan (for synthesizing D-Trp–CQDs) were dissolved in the prepared citric acid solution and stirred for 2 h to obtain a transparent solution. Then the solution was degassed by nitrogen gas purging. Afterward, the mixture was sonicated for 10 minutes, and the mixture was placed in an electrical furnace for 5 h at 180 °C. After cooling to room temperature, the solution was filtered (0.22 μm) and dialyzed (100 Da) for 2 days against deionized water. Ultimately, CQD was freeze-dried and stored in the dark under ambient conditions.23–27 Characterization of the synthesized CQDs was done using Fourier transform infrared (FTIR) spectroscopy (PerkinElmer, Model PE-1600-FTIR), fluorescence emission spectroscopy (PerkinElmer LS45), 1H-NMR spectroscopy (Bruker Avance DPX-250 NMR spectrometer) using D2O as solvent and tetramethyl silane (TMS) as an internal standard, and ultraviolet-visible (UV-vis) absorption spectroscopy (PerkinElmer Lambda 25 UV/vis spectrometer). The morphology of the CQDs was investigated by performing transmission electron microscopy. The samples were sonicated and placed on holey carbon films on copper grids. Images were obtained using a high resolution transmission electron microscope (HR-TEM), Titan G2 60-300 (FEI), at an accelerating voltage of 300 kV. Images were captured with BM UltraScan CCD camera (Gatan).Recombinant luciferase expression and purification
The pET expression system in E. coli BL21 was used to express recombinant P. pyralis firefly luciferase. The produced luciferase was then purified using a Ni–NTA resin as reported earlier.28 SDS–PAGE was used to analyze the purity of the protein and the protein concentration was determined using Bradford assay.Luciferase activity assay
The bioluminescence of the purified luciferase was measured by using a Sirius-Single Tube Luminometer (Berthold Detection Systems, GmbH) that measures the total light emitted from the sample in 10 s. The samples were prepared by mixing 5 μl luciferase (0.25 μM) with 5 μl substrate solution containing ATP (2 mM), luciferin (1 mM), Tris–HCl (20 mM), and MgSO4 (10 mM), pH 7.8. To assess the luciferase activity in the presence of different concentrations of CQDs, luciferase (0.25 μM) was mixed with various concentrations of CQDs (200, 150, 100, 50, 25, 10, and 0 μg ml−1), incubated for 10 minutes at room temperature, the luciferase substrate was added and the activity was measured. The percentage of the measured luciferase activity in treated samples compared to untreated enzyme was considered as the relative activity.In another experiment, a mixture of CQDs (50 μg ml−1) and luciferase (0.25 μM) was incubated for 10 min at room temperature (25 °C) followed by substrate addition and activity measurement at different time intervals. The activity of the untreated enzyme at t = 0 was considered 100% and the enzyme activities of other samples were compared to it. Thermal inactivation of luciferase by CQDs was investigated by incubation of the mixture of luciferase (0.25 μM) and the CQDs (50 μg ml−1) at different temperatures (15, 25, 40 and 50 °C) in a water bath for 10 min. Samples were then cooled on ice and the luciferase activity was measured by the addition of substrate into the reaction at 25 °C. The activity of the luciferase without heat treatment was considered 100% and the activities of other samples were compared to it.
Conformational changes of firefly luciferase upon treatment with CQDs were analyzed by circular dichroism (CD) spectroscopy (JASCO-J715 spectropolarimeter) in the wavelength ranges of 200–250 nm and 250–320 nm for far- and near-UV CD, respectively. The luciferase enzyme (0.2 mg ml−1) was mixed with CQDs (200 μg ml−1) under ambient conditions followed by recording the CD spectra.
The effects of CQDs on luciferase kinetics
To measure the Km for luciferin, 600 μl of the assay reagent (MgSO4 (100 mM), ATP (40 mM), and Tris–HCl (50 mM) at pH 7.8) were mixed with 400 μl of various concentrations of luciferin (0.003–2 mM). The enzyme was mixed with CQDs and incubated for 10 min at room temperature. Then the mixture was added to 5 μl of the assay reagent followed by light emission measurement after 10 s. To measure Km for ATP, 900 μl of the assay reagent (MgSO4 (100 mM), luciferin (5 mM), and Tris–HCl (50 mM), at pH 7.8) was mixed with 100 μl of ATP at different concentrations (0.007–4 mM). The reaction started upon mixing 5 μl of the enzyme, which was mixed with CQDs and incubated for 10 min at room temperature, with 5 μl of the assay reagent. Light emission was recorded after 10 s. The OriginPro 2016 software was used for calculations and statistical analysis of the kinetic parameters.Molecular dynamics (MD) simulation
The three-dimensional structure of luciferase (PDB ID 1Lci) was obtained from a protein data bank (https://www.rcsb.org). CQD structures were simulated using the ChemSketch tool of the ACD/LAB package (https://www.acdlabs.com) using experimental data (NMR, XTD, and TEM). The Avogadro molecular package was used to optimize the three-dimensional structures of CQDs. Topological information for CDs was obtained from CGenFF (https://cgenff.silcsbio.com). A cubic box containing luciferase and eight randomly added CQDs were solvated using an extended simple point charge (SPC/E) model of water.29 Electrical neutralization was performed by adding the appropriate number of ions, followed by energy minimization using the steepest descent algorithm.30 Temperature and pressure were then maintained at 300 K and 1 bar respectively using a v-rescale thermostat31 and Parrinello–Rahman barostat.32 The measurement cut-off for both short range non-bonded Lennard-Jones and coulombic potentials was adjusted at 1.2 nm. Finally, 50 ns of molecular dynamics simulation was conducted using the leapfrog algorithm using the molecular simulation package of GROMACS (Version 2021).Results and discussion
CQD characterization
As shown in Fig. S1A,† the UV-vis spectra of the L/D-Trp–CQDs have two absorption peaks at 220 and 280 nm. The sharp peak at 220 nm is representative of the π–π* electronic transition of sp2 domains and the typical broad absorption shoulder at 280 nm shows the n–π* transition of C![[double bond, length as m-dash]](https://www.rsc.org/images/entities/char_e001.gif) O bonds.33–35
O bonds.33–35
The fluorescence spectra (Fig. S1B†) of CQDs upon excitation at 270 nm show that the emission of L/D-Trp–CQDs was centered at 350 nm.
The FT-IR spectrum of CQDs (Fig. S1C†) showed characteristic peaks for C![[double bond, length as m-dash]](https://www.rsc.org/images/entities/char_e001.gif) O and C
O and C![[double bond, length as m-dash]](https://www.rsc.org/images/entities/char_e001.gif) C bonds as well as N–H bending of residual N-acetyl groups at 1587 cm−1. The peaks at 1400 cm−1 and 1078 cm−1 represented N–H and C–O stretching vibrations. The FTIR spectrum, also, showed a band at 2926 cm−1 and 2854 cm−1 that is attributed to the CH2 and CH3 stretching. The bands at 3408 cm−1 and 3286 cm−1 are assigned to stretching of N–H, O–H and C–H of aromatic moieties, respectively.7,36
C bonds as well as N–H bending of residual N-acetyl groups at 1587 cm−1. The peaks at 1400 cm−1 and 1078 cm−1 represented N–H and C–O stretching vibrations. The FTIR spectrum, also, showed a band at 2926 cm−1 and 2854 cm−1 that is attributed to the CH2 and CH3 stretching. The bands at 3408 cm−1 and 3286 cm−1 are assigned to stretching of N–H, O–H and C–H of aromatic moieties, respectively.7,36
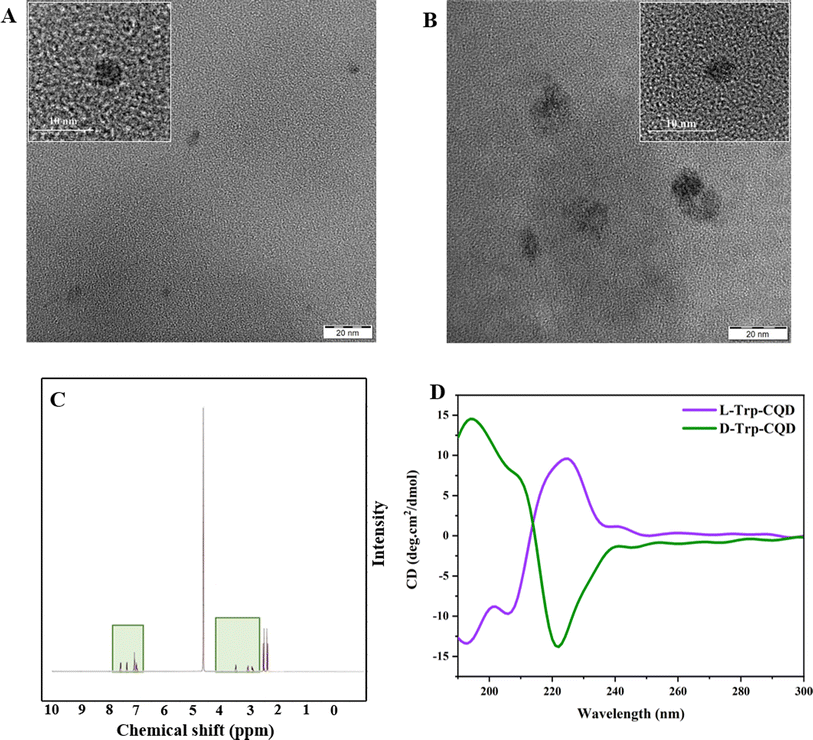
HR-TEM was performed to analyze the morphology of the CQDs. HR-TEM images in Fig. 1A and B indicate the spherical shape of CQDs. The average size of L-Trp–CQD and D-Trp–CQD is 3.1 ± 1.2 nm and 7.6 ± 1.5 nm, respectively.
The 1H-NMR spectra of the CQDs indicate the presence of different kinds of H atoms in various regions. The 3–4.5 ppm peaks are assigned to the protons connected to electron-withdrawing oxygen or nitrogen atoms, like C–O–H and C–N–H. Furthermore, the peaks in the range of 7–8 ppm are typically assigned to hydrogens of aromatic rings (Fig. 1C). 1H-NMR results provided another proof that both L/D-Trp–CQDs have the same chemical structure.37,38
The symmetric CD spectra of L/D-Trp–CQDs (Fig. 1D) validated the formation of CQDs with opposite chirality. The CD spectrum of L/D-Trp–CQDs indicates two opposite optical rotations at 195 and 225 nm. The opposite optical rotation of CD signals is due to the rigid structures generated by π conjugation of the carbon core of CQDs and the aromatic nucleus of the chiral source.39 The other new symmetrical broad CD signals emerge in the range from 240 to 290 nm, suggesting that a new chiral center has been formed.36,39
Luciferase activity measurement in the presence of CQDs
Firefly luciferase (EC 1.13.12.7) is responsible for catalyzing an oxidative decarboxylation reaction.40 In its excited state, this enzyme produces oxyluciferin when adenosine triphosphate (ATP), magnesium (Mg2+), and atomic oxygen are present. The process of light emission begins with the formation of the enzyme intermediate luciferyl adenylate, followed by the reaction between luciferyl adenylate and molecular oxygen. Ultimately, the excited product emits yellow-green light at 560 nm, returning to its ground state with a quantum yield of 0.44.41The P. pyralis firefly luciferase was expressed in the E. coli BL21 host and purified by affinity chromatography (Ni–NTA-Sepharose). Purified luciferase appeared as a single band of about 62 kDa on SDS–PAGE (Fig. S2†).
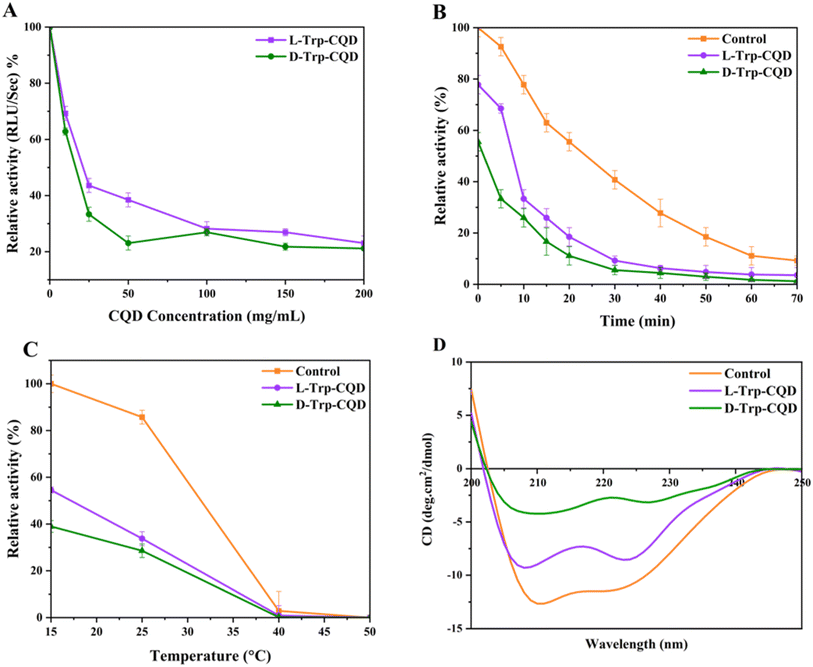
Treatment of the enzyme (0.25 μM) with CQDs (10, 25, 50, 100, 150, and 200 μg ml−1) resulted in loss of activity in a dose-dependent manner (Fig. 2A). The D-Trp–CQD had more effect on luciferase activity rather than the L-Trp–CQD. At the highest concentration (200 mg ml−1), all the samples lost at least 80% of their activities. In another experiment, luciferase (0.25 μM) and CQDs (50 μg ml−1) were mixed and incubated for 10 min at room temperature (25 °C) followed by luciferase substrate addition and activity measurements at different time intervals (Fig. 2B). It was shown that D-Trp–CQD had a larger reducing effect (44%) on the firefly luciferase activity than L-Trp–CQD (22%).
The thermal inactivation of P. pyralis luciferase in the presence of the CQDs (50 μg ml−1) was evaluated at various temperatures (15, 25, 40 and 50 °C). As shown in Fig. 2C, the rate of thermal inactivation of luciferase did not change in the presence of the CQDs. The differences in the activities of treated and untreated enzymes are due to the initial loss of activity of the treated enzymes compared to the control (untreated enzyme).
Far-UV circular dichroism analysis was used to track the changes in the secondary structure of firefly luciferase (0.2 mg ml−1) in the presence of chiral CQDs (200 μg ml−1) (Fig. 2D). Both CQDs significantly altered the luciferase secondary structures (Table S1†). D-Trp–CQD had a more profound effect on the secondary structure of luciferase than L-Trp–CQD. D-Trp–CQDs reduced the percentage of α-helices from 67.45% to 33.32% while increased the percentage of β-structures from 3.24% to 12.5%. This finding agrees with the higher impact of D-Trp–CQDs on luciferase activity.
Luciferase kinetic measurements in the presence of CQDs
The Lineweaver–Burk plot (Fig. S3†) shows the kinetic characteristics of the enzyme. The present study compares the kinetic values for enzyme substrates in the presence of chiral CQDs (Table 1). The findings demonstrated that both the L/D-Trp–CQDs increased luciferin-Km implicating a reduction in the affinity of the enzyme for luciferin by CQD treatment. D-Trp–CQD treatment had a higher effect on ATP-Km than L-Trp–CQD. Treatment of the luciferase with D-Trp–CQDs increased ATP-Km from 75 to 264 μM. The increased Km values could be due to either the conformational changes of the luciferase upon interaction with CQDs or the adsorption of the luciferin and ATP on the CQDs reducing the concentration of the free substrates.| Sample | K m (μM) luciferin | K m (μM) ATP | V max (RLU per mg per s) luciferin | V max (RLU per mg per s) ATP |
|---|---|---|---|---|
| a LUC: luciferase enzyme. | ||||
| CONTROL | 11 ± 1.2 | 75 ± 10 | 1.1 × 10⁴ ± 1178 | 2.5 × 10⁴ ± 4714 |
| LUCa + L-Trp–CQD | 30 ± 8.2 | 60 ± 8.7 | 104 ± 2020.3 | 104 ± 523.7 |
| LUC + D-Trp–CQD | 22 ± 4 | 264 ± 25 | 1.1 × 10⁴ ± 2020.3 | 3.3 × 10⁴ ± 2500 |
Molecular dynamics simulation of luciferase interacting with chiral CQDs
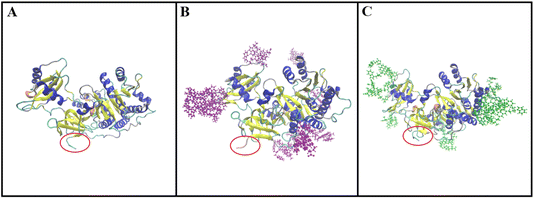
The simulated structures of the luciferase enzyme interacting with L/D-Trp–CQDs are presented in Fig. 3. L/D-Trp–CQDs are mainly attached to unstructured regions of luciferase but at different locations. Interestingly, D-Trp–CQDs and L-Trp–CQDs are attached to different sites of the luciferase. In addition, the structural changes from coil to turn in the N-terminal region of luciferase occurred upon interaction with L-Trp–CQDs. Fig. 4 represents every 10 ns snapshots of luciferase interacting with L/D-Trp–CQDs.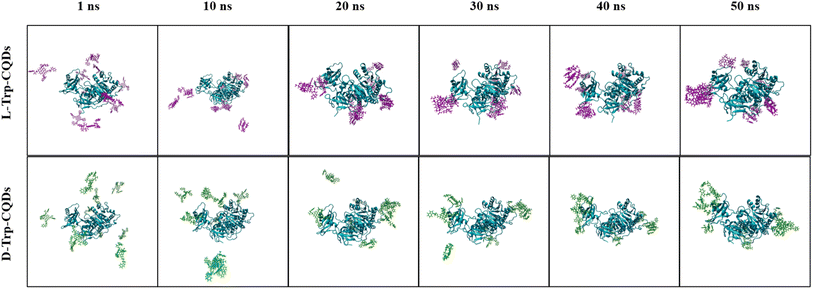 | ||
| Fig. 4 Snapshots of the three-dimensional structure of luciferase interacting with L-Trp–CQDs and D-Trp–CQDs at different time points during simulation. | ||
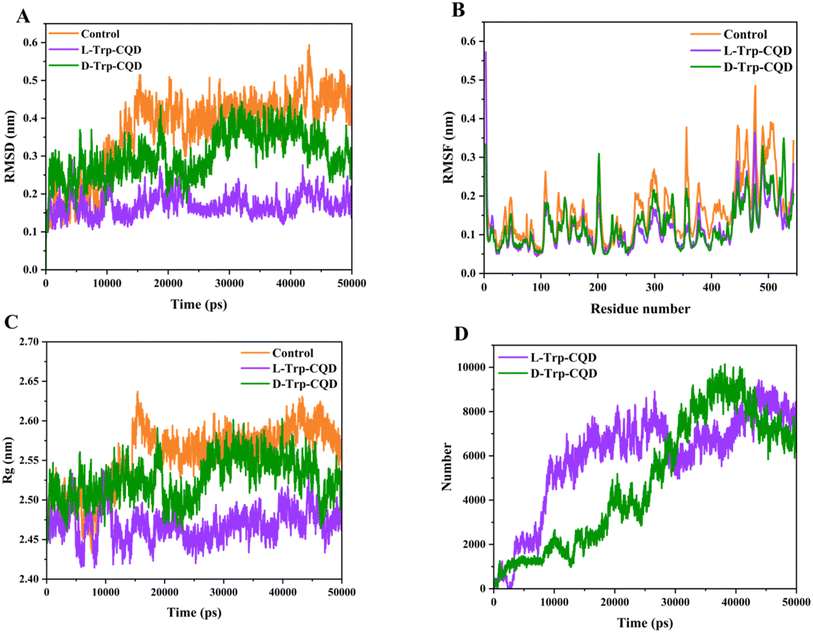
Root-mean-square-deviation (RMSD) which measures the average deviation of a set of particles from a reference position is commonly used in molecular dynamics simulations to investigate the accuracy of the simulation and the protein structure stability over time.42 The mean RMSD value for untreated luciferase, and luciferase interacting with L-Trp–CQD and D-Trp–CQD was 0.42 ± 0.04, 0.18 ± 0.02, and 0.32 ± 0.05 nm, respectively (Fig. 5A). The results clearly show that after the addition of the CQDs into the system, the mean value of RMSD is decreased with more decrement in the system containing L-Trp–CQD as a result of protein–CQD interaction. Fluctuations in the RMSD values are considered an important index of the structural changes in proteins during the MD simulations. The greater the fluctuation of the RMSD, the more changes in the protein structure are expected. Higher RMSD fluctuation in the luciferase occurs when it is treated with D-Trp–CQDs compared to L-Trp–CQDs.
Root-mean-square fluctuation (RMSF) is an indicator of the amino acid positional fluctuations in relation to their mean position during the simulation time. Higher RMSF values show more amino acid unsteadiness.42 Most of the luciferase amino acids interacting with L-Trp–CQDs represented lower RMSF values than untreated luciferase. However there were four main regions (200–210, 220–230, 330–340, and 520–530) in the luciferase interacting with D-Trp–CQDs which had higher RMSF values than the untreated enzyme indicating structural instability in these regions induced by D-Trp–CQDs (Fig. 5B). It is noteworthy that Lys529 as an active site amino acid is located in the 520–530 region.
The radius of gyration (Rg) represents the total protein dimension changes during simulation.42 The L-Trp–CQD treated enzyme had less Rg values in comparison with the D-Trp–CQD (Fig. 5C), indicating a higher impact of this CQD on the protein dimension and compactness which is in parallel with RMSD and RMSF results. D-Trp–CQD treated enzymes demonstrated higher fluctuations in Rg values which suggests more instability in the luciferase structure after interacting with D-Trp–CQDs compared to L-Trp–CQDs. The total number of contacts between L/D-Trp–CQD with luciferase was high and almost the same during the simulation time confirming molecular interactions and complex formation between CQDs and protein (Fig. 5D).
Principal component analysis (PCA) represents the main pattern of protein movement and dynamics.42 As shown in Fig. 6, untreated luciferase had several positional clusters on the PC1/PC2 planes in the range of −6, +6 (PC1) and −5, +5 (PC2); whereas L-Trp–CQD treated luciferase had these clusters in a narrower range which was −3, +3 (PC1), and −2.5, +3 (PC2). On the other hand, D-Trp–CQD treated luciferase showed a different pattern in the range of −3, +3 (PC1) and −2, +2 (PC2). PCA data show that both the L/D-Trp–CQDs reduced the spatial range of luciferase movements.
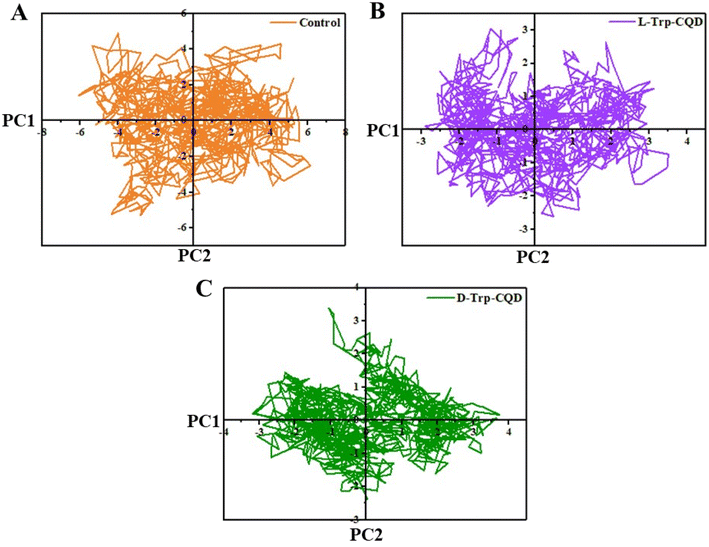 | ||
| Fig. 6 The PCA diagram of (A) untreated luciferase (control) and the luciferase interacting with (B) L-Trp–CQDs or (C) D-Trp–CQDs. | ||
DSSP (Definition of secondary structure of protein) data indicate the general secondary structural changes in the L/D-Trp–CQD treated luciferase during the simulation time.42 As represented in Table S2 and Fig. S5,†D-Trp–CQD induced more structural changes and deterioration than L-Trp–CQD in the luciferase structure. Seven luciferase active site amino acids including His245 and Phe247 (240–250 region, turn), Gly315 (310–320 region, turn), Tyr340 and Thr343 (340–350 region, coil), Ile351 (350–360 region, turn), and Lys529 (520–530 region, bend) were affected upon interaction of the enzyme with D-Trp–CQDs. On the other hand, L-Trp–CQDs only affected three active site amino acids including Gly315 (310–320 region, turn), Ile351 (350–360 region, turn), and Lys529 (520–530 region, bend) (Fig. S4†).
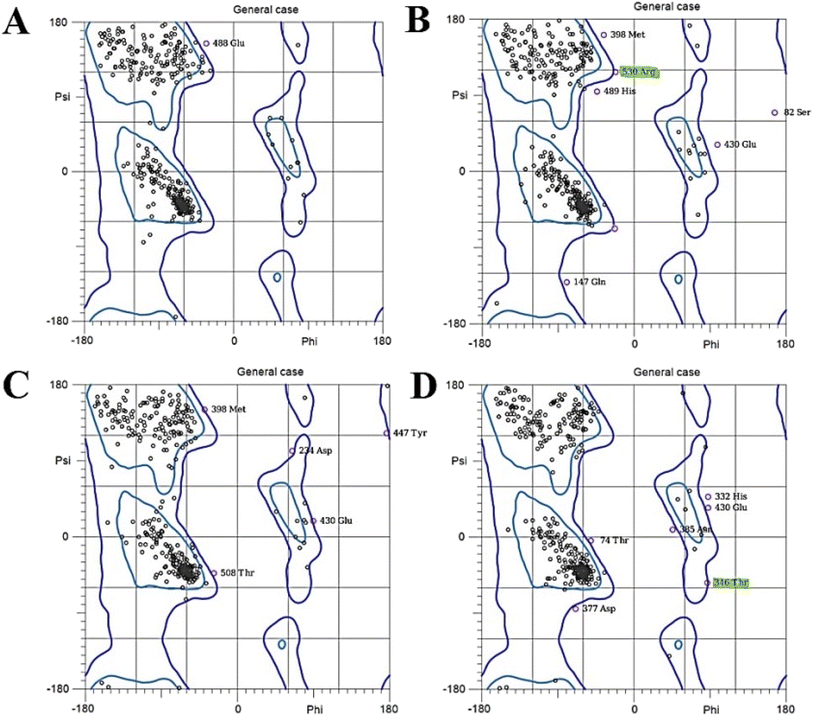
The Ramachandran plot of luciferase interacting with D-Trp–CQDs, exhibits significant changes compared to the untreated luciferase above the left-handed α-helix region [+90, +100] (Fig. 7). To have a deep view of Ramachandran's results, different simulation time frames were separately analyzed using the MolProbity online server (https://molprobity.biochem.duke.edu/) (Fig. 8). In the case of luciferase interacting with L/D-Trp–CQDs, the outlier amino acids or the amino acids located in not-allowed regions mainly appeared in the time frame of 30–40 ns. The changed amino acids in the active site or close to it, and activity related amino acids were carefully investigated and are presented in Tables 2 and S2.† In the case of luciferase interacting with L-Trp–CQD, five important amino acids were in the outlier region of the Ramachandran plot at 32 ns, 36 ns, and 38 ns time points. These amino acids include Ser320 which is close to Gly315 (active site amino acid); Pro318 which is close to Gly315 (active site) (Fig. S5†), Gly246 and Arg530 which are adjacent to His245 (located in ATP-binding site) and Lys529 (active site amino acid), respectively (Fig. 8A and B). In the case of D-Trp–CQD treated luciferase, there are several outlier amino acids that are involved in the ATP-binding site. This finding can explain the significant changes in Km of the enzyme for ATP (Table 3). In the case of D-Trp–CQD treated luciferase, at 30 ns of simulation, Pro242 which is close to His245 (ATP-binding site) and Phe247 (active site amino acid), Pro353 which is close to Ile351 (active site amino acid), Asp357 and Lys358 (hydrogen bond forming),43 and Pro523 which is in the vicinity of Lys529 (active site amino acid) were in the outlier region. At 32 ns of simulation, Thr346 which is close to Thr343 (ATP-binding site), Pro353 and Gly355 which is close to Ile351 (active site amino acid) were in the not allowed regions (Fig. 8C and D). The flexible loop encompassing the 352–359 residues has been reported to govern the activity of the luciferase. Conformational changes of this loop alter the solvent accessibility of the active site.44,45 DSSP results (Table S2†) demonstrated that the 350–360 region has been mainly changed upon interaction with D-Trp–CQDs. For D-Trp–CQD Pro353, which is located at this loop has been in the outlier region of the Ramachandran plot at 30 ns. Pro353, Gly355, and Pro359 (at 32 ns), Pro353 (at 34 ns), Glu354 and Asp356 (at 36 ns), Pro353 and Pro359 (at 38 ns) were in the outlier region of the Ramachandran plot. In the case of luciferase interacting with L-Trp–CQDs, only at 32 ns, the Glu354 was in the not-allowed region of the Ramachandran plot. It can be concluded that D-Trp–CQDs had a greater effect on the flexible loop and active site amino acids of luciferase than L-Trp–CQD.
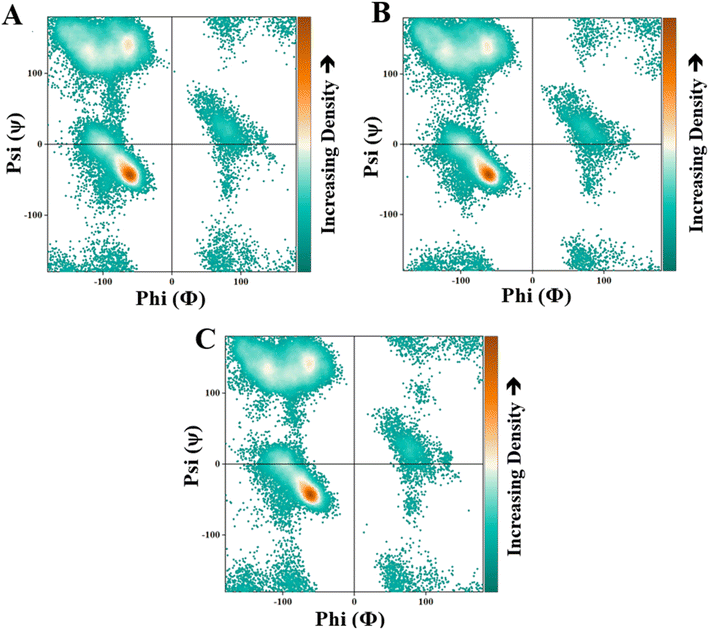 | ||
| Fig. 7 The Ramachandran plot of (A) untreated luciferase (control) and the luciferase interacting with (B) L-Trp–CQDs or (C) D-Trp–CQDs. | ||
| Changed amino acids in the active site | Changed amino acids in the vicinity of the active site | Changed amino acids involved in structure/activity | |
|---|---|---|---|
| D-Trp–CQD | Phe247 | -Pro242 close to His245 | -His332 close to Arg337 |
| -Pro353 close to Ile351 | -Thr346, Pro353, and Ser347 close to Ala348 | ||
| -Thr346 close to Thr343 | -Ser201 close to Asn197 and Ser199 | ||
| -Pro523 close to Lys529 | -Ser320 and Pro318 close to Ala317 | ||
| -Pro353 and Gly355 close to Ile351 | -Pro353 close to Asp357 and Lys358 | ||
| -Thr346 close to Thr343 | -Pro353 (the flexible loop) | ||
| -Ser347 close to Thr343 | -Gly354 (the flexible loop) | ||
| -Glu354 and Asp356 close to Ile351 | -Gly355 (the flexible loop) | ||
| -Pro359 close to Ile351 | -Asp356 (the flexible loop) | ||
| -Pro359 (the flexible loop) | |||
| L-Trp–CQD | — | -Ser320 close to Gly315 | -Ser201 close to Asn197 and Ser199 |
| -Gly246 close to His245 | -Ser320 and Pro318 close to Ala317 | ||
| -Arg530 close to Lys529 | -Glu354 (the flexible loop) | ||
| -Pro318 close to Gly315 |
| Lennard-Jones energy (kJ mol−1) | Coulomb energy (kJ mol−1) | Total energy (kJ mol−1) | H-bond (mean number) | |
|---|---|---|---|---|
| Luciferase & L-Trp–CQD | −406.167 | −693.137 | −1099.304 | 6.9 |
| Luciferase & D-Trp–CQD | −322.326 | −528.915 | −851.241 | 6.1 |
For further investigating the structure–activity relationship, the luciferase amino acids which are not located in the active site but play a critical role in the structure/activity of the enzyme were studied (Table 2). In the case of luciferase interacting with D-Trp–CQDs, Arg337 which participates in the formation of a hydrogen bond network between Glu311 and Ser284 (ref. 46 and 47) showed conformational changes as demonstrated by the DSSP and RMSF data and its adjacent amino acid (His332) has been moved to the outlier regions of the Ramachandran plot. Ser284 located in the close vicinity of the active site, is involved in hydrogen bodings that are critical for maintenance of active site conformation.46,47 Based on the DSSP data, Ala348 which is involved in luciferin-binding48 was conformationally changed in the case of luciferase interacting with D-Trp–CQDs.
Furthermore, Asn197, Ser199, and Ala317 reported that the ATP-binding-related structural amino acids in luciferase48 were changed in the DSSP results of luciferase interacting with both L/D-Trp–CQDs. Among them, Asn197 and Ser199 exhibited increased RMSF values in the luciferase interacting with D-Trp–CQDs. The significant changes in Km values of the enzyme for luciferin and ATP can be attributed to the conformational changes in the amino acids involved in the active site and substrate-binding regions of the luciferase enzyme.
Lennard-Jones (mathematical model of van der Waals) and coulombic binding energies and the mean total number of hydrogen bonds of the luciferase interacting with L/D-Trp–CQDs are presented in Table 3. The mean numbers of hydrogen bonds between L-Trp–CQDs and D-Trp–CQDs with luciferase were 6.9 and 6.1 respectively during the simulation (Fig. S6†). Both Lennard-Jones and coulombic energy of L-Trp–CQDs were almost 1.3 times more than those of D-Trp–CQDs. These data show that L-Trp–CQDs formed a stronger interaction with the luciferase enzyme rather than D-Trp–CQDs which is in parallel with both the RMSD and Rg results.
Conclusion
When contemplating the potential use of CQDs in biomedical applications, chirality is revealed as a critical and unaddressed factor which can significantly affect the performance of CQDs. In this research, the interaction of two chiral CQDs (L/D-Trp–CQDs) with luciferase enzyme was compared by experimental and computational methods. D-Trp–CQDs were shown to have significantly more effects on the structure/activity of luciferase than L-Trp–CQDs through binding to the areas that are involved in substrate binding and catalytic activity of the enzyme. These findings shed light on the critical role of CQD chirality in determining the fate of the proteins interacting with them.Data availability
All the generated and analyzed data are included in this published version or its ESI file.†Author contributions
Mehrnaz Rad-Faraji and Marziyeh Mousazadeh: investigation, methodology, visualization, writing – review & editing. Maryam Nikkhah: conceptualization, project administration, supervision, resources, writing – review & editing. Sajad Moradi and Mohabbat Ansari: investigation, methodology. K. C.: investigation, methodology. Saman Hosseinkhani methodology, resources. Aram Rezaei: conceptualization, resources, methodology, writing – review & editing.Conflicts of interest
The authors declare that they have no conflict of interest.Acknowledgements
This study was partially supported by the Research Council of Tarbiat Modares University (Grant No. 84905) and Kermanshah University of Medical Sciences (Grant No. 4020776).References
- F. Devínsky, Chirality and the origin of life, Symmetry, 2021, 13(12), 2277 CrossRef.
- N. H. Cho, et al., Bioinspired chiral inorganic nanomaterials, Nat. Rev. Bioeng., 2023, 1(2), 88–106 CrossRef.
- Y. Shao, et al., Shining light on chiral inorganic nanomaterials for biological issues, Theranostics, 2021, 11(19), 9262 CrossRef CAS.
- W. Chen, et al., Chiral supramolecular nanomaterials: from chirality transfer and amplification to regulation and applications, Interdiscip. Mater., 2023, 2(5), 689–713 Search PubMed.
- Y. Kapon, et al., Evidence for new enantiospecific interaction force in chiral biomolecules, Chem, 2021, 7(10), 2787–2799 CAS.
- A. Rezaei, et al., Toward chemical perfection of graphene-based gene carrier via Ugi multicomponent assembly process, Biomacromolecules, 2016, 17(9), 2963–2971 CrossRef CAS.
- A. Rezaei and E. Hashemi, A pseudohomogeneous nanocarrier based on carbon quantum dots decorated with arginine as an efficient gene delivery vehicle, Sci. Rep., 2021, 11(1), 13790 CrossRef CAS PubMed.
- N. Hadizadeh, et al., An overview on the reproductive toxicity of graphene derivatives: highlighting the importance, Nanotechnol. Rev., 2022, 11(1), 1076–1100 CrossRef CAS.
- B. Adibi-Motlagh, et al., Immobilization of modular peptides on graphene cocktail for differentiation of human mesenchymal stem cells to hepatic-like cells, Front. Chem., 2022, 10, 943003 CrossRef CAS.
- B. Adibi-Motlagh, et al., Cell attachment evaluation of the immobilized bioactive peptide on a nanographene oxide composite, Mater. Sci. Eng., C, 2018, 82, 323–329 CrossRef CAS.
- A. Rezaei, et al., Chiral Pseudohomogeneous Catalyst Based on Amphiphilic Carbon Quantum Dots for the Enantioselective Kharasch–Sosnovsky Reaction, ACS Appl. Mater. Interfaces, 2023, 15(47), 54373–54385 CrossRef CAS.
- C. Xia, et al., Evolution and synthesis of carbon dots: from carbon dots to carbonized polymer dots, Adv. Sci., 2019, 6(23), 1901316 CrossRef CAS.
- F. Li, et al., Highly fluorescent chiral N-S-doped carbon dots from cysteine: affecting cellular energy metabolism, Angew. Chem., 2018, 130(9), 2401–2406 CrossRef.
- R. Malishev, et al., Chiral modulation of amyloid beta fibrillation and cytotoxicity by enantiomeric carbon dots, Chem. Commun., 2018, 54(56), 7762–7765 RSC.
- J. Dong, et al., Synthesis of aspartic acid-derived chiral carbon dots and their effect on bovine serum albumin amyloid fibrillation by multispectral and molecular interaction studies, J. Mol. Struct., 2023, 136045 CrossRef CAS.
- Y. Ma, et al., Chiral carbon dots–a functional domain for tyrosinase Cu active site modulation via remote target interaction, Nanoscale, 2022, 14(4), 1202–1210 RSC.
- X. Wang, et al., Carbon Dots from d-Cysteine and Citric Acid Increase the Activity of the Enzyme Laccase, ACS Appl. Nano Mater., 2022, 5(11), 16812–16820 CrossRef CAS.
- X. Wang, et al., Carbon dots with chiral surface selectively inhibit the activity of laccase, Appl. Surf. Sci., 2022, 583, 152540 CrossRef CAS.
- P. Gao, et al., Chiral carbon dots-enzyme nanoreactors with enhanced catalytic activity for cancer therapy, ACS Appl. Mater. Interfaces, 2021, 13(47), 56456–56464 CrossRef CAS.
- M. Zhang, et al., Chiral control of carbon dots via surface modification for tuning the enzymatic activity of glucose oxidase, ACS Appl. Mater. Interfaces, 2021, 13(4), 5877–5886 CrossRef CAS.
- M. Zhang, et al., Maltase decorated by chiral carbon dots with inhibited enzyme activity for glucose level control, Small, 2019, 15(48), 1901512 CrossRef CAS PubMed.
- M. Rad-Faraji, et al., A comparative study of structural and catalytic activity alterations in firefly luciferase induced by carbon quantum dots containing amine and carboxyl functional groups, Int. J. Biol. Macromol., 2024, 260, 129503 CrossRef CAS PubMed.
- A. Rezaei, et al., Ultrasound-assisted pseudohomogeneous tungstate catalyst for selective oxidation of alcohols to aldehydes, Sci. Rep., 2022, 12(1), 3367 CrossRef CAS PubMed.
- A. Rezaei, et al., Pseudohomogeneous metallic catalyst based on tungstate-decorated amphiphilic carbon quantum dots for selective oxidative scission of alkenes to aldehyde, Sci. Rep., 2021, 11(1), 4411 CrossRef CAS.
- L. Hadian-Dehkordi, et al., Amphiphilic carbon quantum dots as a bridge to a pseudohomogeneous catalyst for selective oxidative cracking of alkenes to aldehydes: a nonmetallic oxidation system, ACS Appl. Mater. Interfaces, 2020, 12(28), 31360–31371 CrossRef CAS.
- M. Mohammadi, et al., Ionic-liquid-modified carbon quantum dots as a support for the immobilization of tungstate ions (WO42–): heterogeneous nanocatalysts for the oxidation of alcohols in water, ACS Sustain. Chem. Eng., 2019, 7(5), 5283–5291 CrossRef CAS.
- M. Mohammadi, et al., Targeted development of sustainable green catalysts for oxidation of alcohols via tungstate-decorated multifunctional amphiphilic carbon quantum dots, ACS Appl. Mater. Interfaces, 2019, 11(36), 33194–33206 CrossRef CAS PubMed.
- S. Rasouli, et al., Effects of sucrose and trehalose on stability, kinetic properties, and thermal aggregation of firefly luciferase, Appl. Biochem. Biotechnol., 2011, 165, 572–582 CrossRef CAS PubMed.
- P. Mark and L. Nilsson, Structure and dynamics of the TIP3P, SPC, and SPC/E water models at 298 K, J. Phys. Chem. A, 2001, 105(43), 9954–9960 CrossRef CAS.
- J. Fliege and B. F. Svaiter, Steepest descent methods for multicriteria optimization, Math. Methods Oper. Res., 2000, 51, 479–494 CrossRef.
- G. Bussi, D. Donadio and M. Parrinello, Canonical sampling through velocity rescaling, J. Chem. Phys., 2007, 126(1), 014101 CrossRef.
- M. Parrinello and A. Rahman, Strain fluctuations and elastic constants, J. Chem. Phys., 1982, 76(5), 2662–2666 CrossRef CAS.
- M. Liu, Optical properties of carbon dots: a review, Nanoarchitectonics, 2020, 1–12 CrossRef.
- M. Hassan, et al., Edge-enriched graphene quantum dots for enhanced photo-luminescence and supercapacitance, Nanoscale, 2014, 6(20), 11988–11994 RSC.
- C. M. Carbonaro, et al., On the emission properties of carbon dots: reviewing data and discussing models, C, 2019, 5(4), 60 CAS.
- Y. Wei, et al., Investigation on the chirality mechanism of chiral carbon quantum dots derived from tryptophan, RSC Adv., 2019, 9(6), 3208–3214 RSC.
- L. Song, et al., Structure observation of graphene quantum dots by single-layered formation in layered confinement space, Chem. Sci., 2015, 6(8), 4846–4850 RSC.
- A. Porfarzollah, R. Mohammad-Rezaei and M. Bagheri, Ionic liquid-functionalized graphene quantum dots as an efficient quasi-solid-state electrolyte for dye-sensitized solar cells, J. Mater. Sci.: Mater. Electron., 2020, 31(3), 2288–2297 CrossRef CAS.
- X. Liu, et al., Chiral self-assembly of porphyrins induced by chiral carbon dots, Front. Chem., 2020, 8, 670 CrossRef CAS PubMed.
- Y. Sefidbakht, et al., Effects of 940 MHz EMF on luciferase solution: structure, function, and dielectric studies, Bioelectromagnetics, 2013, 34(6), 489–498 CrossRef PubMed.
- A. Lohrasbi-Nejad, M. Torkzadeh-Mahani and S. Hosseinkhani, Hydrophobin-1 promotes thermostability of firefly luciferase, FEBS J., 2016, 283(13), 2494–2507 CrossRef CAS.
- K. S. Ebrahimi, et al., In silico investigation on the inhibitory effect of fungal secondary metabolites on RNA dependent RNA polymerase of SARS-CoV-II: a docking and molecular dynamic simulation study, Comput. Biol. Med., 2021, 135, 104613 CrossRef CAS.
- M. Nazari, S. Hosseinkhani and L. Hassani, Step-wise addition of disulfide bridge in firefly luciferase controls color shift through a flexible loop: a thermodynamic perspective, Photochem. Photobiol. Sci., 2013, 12(2), 298–308 CrossRef CAS PubMed.
- A. Moradi, et al., Effect of charge distribution in a flexible loop on the bioluminescence color of firefly luciferases, Biochemistry, 2009, 48(3), 575–582 CrossRef CAS.
- S. Hosseinkhani, Molecular enigma of multicolor bioluminescence of firefly luciferase, Cell. Mol. Life Sci., 2011, 68, 1167–1182 CrossRef CAS.
- B. R. Branchini, et al., The role of active site residue arginine 218 in firefly luciferase bioluminescence, Biochemistry, 2001, 40(8), 2410–2418 CrossRef CAS PubMed.
- N. Ugarova and L. Y. Brovko, Protein structure and bioluminescent spectra for firefly bioluminescence, Luminescence, 2002, 17(5), 321–330 CrossRef CAS.
- M. Mortazavi, et al., Spectroscopic and functional characterization of Lampyris turkestanicus luciferase: a comparative study, Acta Biochim. Biophys. Sin., 2008, 40(5), 365–374 CrossRef CAS.
Footnotes |
| † Electronic supplementary information (ESI) available. See DOI: https://doi.org/10.1039/d4na00621f |
| ‡ These authors contributed equally to this work. |
| This journal is © The Royal Society of Chemistry 2024 |

