Unlocking the secrets of porous silicon formation: insights into magnesiothermic reduction mechanism using in situ powder X-ray diffraction studies†
Sarah A.
Martell‡
 a,
Maximilian
Yan‡
ab,
Robert H.
Coridan
 c,
Kevin H.
Stone
 d,
Siddharth V.
Patwardhan
 *b and
Mita
Dasog
 *a
*a
aDepartment of Chemistry, Dalhousie University, 6274 Coburg Road, Halifax, NS B3H 4R2, Canada. E-mail: mita.dasog@dal.ca
bDepartment of Chemical and Biological Engineering, The University of Sheffield, Mappin Street, Sheffield S1 3JD, UK. E-mail: s.patwardhan@sheffield.ac.uk
cDepartment of Chemistry and Biochemistry, University of Arkansas, 119 Chemistry Building, 1 University of Arkansas, Fayetteville, AR 72701, USA
dSSRL Material Science Division, SLAC National Accelerator Laboratory, 2575 Sand Hill Road, Menlo Park, CA 94025, USA
First published on 19th August 2024
Abstract
The magnesiothermic reduction of SiO2 is an important reaction as it is a bulk method that produces porous Si for a wide range of applications directly from SiO2. While its main advantage is potential tunability, the reaction behavior and final product properties are heavily dependent on many parameters including feedstock type. However, a complete understanding of the reaction pathway has not yet been achieved. Here, using in situ X-ray diffraction analysis, for the first time, various pathways through which the magnesiothermic reduction reaction proceeds were mapped. Further, the key parameters and conditions that determine which pathways are favored were determined. It was discovered that the reaction onset temperatures can be as low as 348 ± 7 °C, which is significantly lower when compared to previously reported values. The onset temperature is dependent on the size of Mg particles used in the reaction. Further, Mg2Si was identified as a key intermediate rather than a reaction byproduct during the reduction process. Its rate of consumption is determined by the reaction temperature which needs to be >561 °C. These findings can enable process and product optimization of the magnesiothermic reduction process to manufacture and tune porous Si for a range of applications.
New conceptsThis study provides the first detailed mechanistic insights into the pathways through which the magnesiothermic reduction reaction of silica proceeds, using in situ X-ray diffraction analysis. The study revealed that the reaction onset temperatures can be significantly lower than previously reported and conclusively identified magnesium silicide as a key intermediate rather than a byproduct in the magnesiothermic reduction process. The magnesium particle size not only determines the reaction onset temperature but also influences the lifetime of reaction intermediates such as magnesium silicide. The magnesiothermic reduction is crucial due to its ability to produce high-purity nanoscale porous silicon in a cost-effective and potentially more environmentally friendly manner compared to traditional methods. This process is increasingly becoming a sought-after technique for producing materials used in green energy applications. The findings in this study offer a deeper understanding of the reduction process, enabling better optimization and tuning of porous silicon properties and yield. |
Introduction
Porous Si (p-Si) is a material with unique properties that are highly beneficial for various applications including chemical H2 storage,1 lithium-ion batteries,2 drug delivery,3 optics,4 sensors5 and photocatalysis.6 Since Si is highly abundant, non-toxic, and requires precursors that are well distributed around the globe, it is a favorable material to work with and has been investigated for various applications.7,8 Typically, the synthesis of p-Si starts with the generation of non-porous, metallurgical grade Si, made via carbothermal reduction method at temperatures >2000 °C and is extremely energy intensive.2,9,10 After the carbothermal reduction, Si may be further refined and processed through one of two routes: melt or chemical. The melt route involves liquification of metallurgical grade Si and its conversion to large single crystals, most commonly via the Czochralski method which requires temperatures >1414 °C. The large Si crystals are then cut into wafers and made porous using a sacrificial and toxic HF etching procedure.11,12 The chemical route involves the gasification of metallurgical Si to generate precursors such as SiHCl3 and SiCl4,9,13 which can then be used to make p-Si via chemical vapor deposition on a porous template or through molten salt templating.13–15 These additional steps to obtain p-Si are wasteful and energy intensive, making the entire process far from green.16 The dire need to decarbonize has increased the demand for p-Si, as it is a promising energy storage material.2,17 Therefore it is important to develop an efficient, low energy, and scalable p-Si production process to meet this demand in a sustainable way. The magnesiothermic reduction (MgTR) is a bulk process which can produce p-Si from a wide variety of waste, unprocessed, porous and non-porous feedstocks.2 In contrast to the carbothermal reduction, the MgTR reaction directly produces p-Si and does not require additional processing steps to render its porosity. The MgTR is typically carried out at temperatures between 500–950 °C which is significantly lower than the carbothermal reduction reaction.2,18Despite the increased adaptation of MgTR to produce p-Si, the mechanism of this reaction has been debated in the literature. The difficulty in elucidating this mechanism arises from two factors: (1) these reactions are difficult to probe in high resolution without expensive techniques and (2) the precursors and reaction conditions are presumed to influence the reaction pathway. Generally, the reaction mechanism is assumed to begin with the diffusion of Mg vapor into SiO2 particles (typically performed at 650 °C for 6 h), resulting in a well distributed matrix of MgO and Si in the product (eqn (1)).19 By treating the reaction products with an acid, MgO can be removed, resulting in a p-Si structure.
| 2Mg(g) + SiO2(s) → 2MgO(s) + Si(s) ΔH650 = −628.32 kJ mol−1 | (1) |
Along with this reaction, there are multiple side reactions that are known to occur depending on the choice of precursors and reaction parameters.20 The first is the formation of Mg2Si which is considered both an unwanted by-product as well as a possible intermediate in the MgTR.20,21 There have been three main mechanisms proposed in the literature on how this reaction proceeds. The first mechanism involves the production of Si directly (reaction (1)) and the formation of Mg2Si is a parasitic side reaction that proceeds via(2). In this mechanism, the unwanted silicide by-product can be avoided by using low Mg![[thin space (1/6-em)]](https://www.rsc.org/images/entities/char_2009.gif) :
:![[thin space (1/6-em)]](https://www.rsc.org/images/entities/char_2009.gif) SiO2 ratios.21,22 Mg2Si can further react with SiO2 to re-form Si and MgO through reaction (3) at high temperatures.2,20
SiO2 ratios.21,22 Mg2Si can further react with SiO2 to re-form Si and MgO through reaction (3) at high temperatures.2,20
| 2Mg(g) + Si(s) → Mg2Si(s) ΔH650 = −358.33 kJ mol−1 | (2) |
| Mg2Si(s) + SiO2(s) → 2MgO(s) + 2Si(s) ΔH650 = 60.01 kJ mol−1 | (3) |
| 4Mg(g) + SiO2(s) → Mg2Si(s) + 2MgO(s) ΔH650 = −1316.65 kJ mol−1 | (4) |
Lastly, it has been proposed that Si forms according to reaction (1) but is rapidly converted to Mg2Si viareaction (2) and the final Si product is then formed through (3). In this proposed mechanism, Mg2Si is an intermediate in the reaction that always forms.20,26
By investigating the mechanisms through ex situ studies, Yoo et al. concluded that Mg2Si was formed within the first 10–20 min from the direct reaction of Mg vapor with SiO2 as there was no evidence of reaction (1) occurring first from the powder XRD patterns.27 While it is possible for Mg2Si to form directly from SiO2viareaction (4), this is improbable based on the collision theory.24 Another ex situ study by Gutman et al. focused on the structural changes that occurred during the MgTR between 400–650 °C showing the formation of products in periodic layers (Si/MgO and Mg2Si) using a glass slide immersed within Mg.23 The growth rate of the product layers was inversely related to reaction time, and confirms that the MgTR reaction is a diffusion-controlled process.23 This study proposed that the periodic structure is formed from long-range diffusion of Mg atoms to the SiO2 surface, short range diffusion of Si atoms from SiO2 to the SiO2/MgO interface as well as the MgO/Mg2Si interface (to a lesser degree) and no diffusion of O atoms. However, it should be noted that this study used a large excess of Mg which is not reflective of typical MgTR reactions designed to produce p-Si. In addition to the reaction sequence and diffusion of atoms, researchers have also tried to understand the effect of Mg particle size on MgTR. For example, a study by Yang et al. used various Mg particle sizes to control the excess heat produced from the exothermic reaction (1).17 Their main findings were: as the Mg particle size increases, the reaction rate decreases which leads to smaller quantities of heat being generated in a given time interval, leading to less sintering in the final Si product.17
It is clear that the current understanding of the MgTR reaction mechanism is inconclusive and incomplete, especially during the ramping stage where the reactants are still heating up. In order to control and optimize the reaction and properties of p-Si formed, it is important to identify the MgTR reaction pathway. Herein, in situ powder X-ray diffraction (XRD) studies were performed to monitor the reaction sequence during the ramp up and hold times of MgTR reactions. Ex situ Raman and electron microscopy studies were performed to support the observations made during the in situ XRD studies. The influence of Mg particle size on the reduction mechanism was also investigated. This study sheds light on the reaction onset temperatures, diffusion of atoms, and the rate of formation and consumption of reaction intermediates as a function of Mg particle size.
Results and discussion
Reaction mechanism
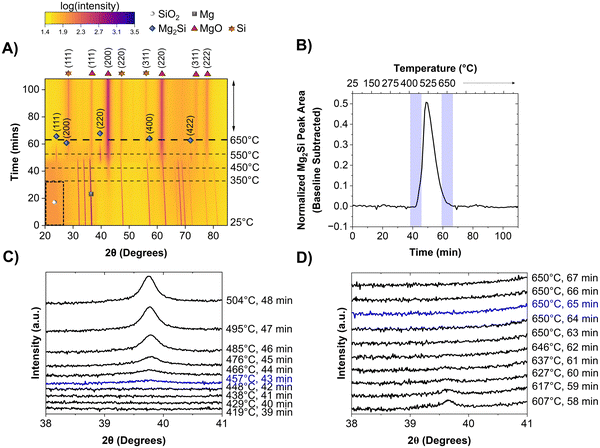
The MgTR is most commonly performed at 650 °C, which is the melting point of Mg, and held for 6 h. Before understanding the effect of Mg particle size on the reaction pathway, it is important to first describe how the MgTR progresses under “traditional conditions”, between room temperature and 650 °C. The mechanism was investigated using in situ powder XRD studies at beamline 2–1 at the Stanford Synchrotron Radiation Lightsource (SSRL) located at SLAC National Accelerator Laboratory and the experimental set-up is shown in Fig. S1 and S2 (ESI†). For the traditional reaction, Mg powder with an average particle size of 23 μm (−325 mesh) and 300 nm Stöber SiO2 particles were used (Fig. S3, ESI†).19 This Mg sample was labeled as sMg since it had smaller average particle size compared to the Mg powder used later in this study (size distribution of the sMg particles can be seen in Fig. S4, ESI†). Fig. 1A shows a heatmap generated from in situ powder XRD analysis of the reaction between sMg and SiO2, where reflection intensities are shown as color contrasts. All the reflections (i.e., vertical lines) observed at the beginning of the reaction correspond to crystalline Mg. The marked region from 20–30° 2θ at the beginning of the reaction corresponds to amorphous SiO2. Significant reaction events are described in chronological order as follows. The most intense reflection corresponding to MgO at 43° 2θ began to form at approximately 348 ± 7 °C (can be seen in greater detail in Fig. S5, ESI†). To the best of our knowledge, this is the lowest reaction onset temperature that has been reported to date. As a control, the onset of MgO is compared to heating sMg by itself in the absence of SiO2 is shown in Fig. S6 (ESI†).The appearance of MgO was followed by the formation of Mg2Si (2θ ∼ 39°) when the set temperature reached 457 ± 14 °C (seen in greater detail in Fig. 1B and C). Since MgO and Mg2Si reflections do not appear simultaneously, it is unlikely that reaction (4) occurs (formation of Mg2Si and MgO in one step). A reflection at 28° 2θ, corresponding to crystalline Si (c-Si) was first observed when the temperature reached ∼541 °C. Mg2Si persisted in the reaction mixture for 22 min, then the reflection at 39° 2θ disappeared (Fig. 1B and D).
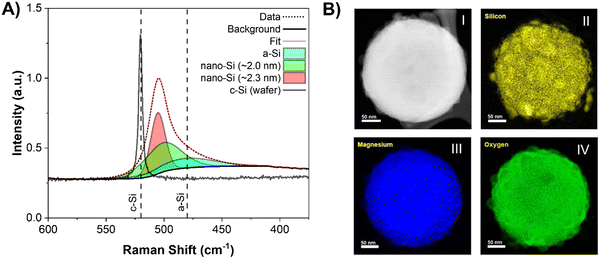
A reaction mechanism can now be formulated based on the reaction events described above. The formation of MgO at 348 ± 7 °C indicates that reaction between SiO2 and 2 molar equivalents of Mg had occurred, producing Si (as shown in equation 1). Since there were no reflections for c-Si in the XRD patterns, this suggests that it is likely amorphous (a-Si) in nature. The presence of elemental Si before Mg2Si formation was confirmed using Raman spectroscopy (Fig. 2A). By examining a representative Si sample prepared in the lab at this low temperature, the presence of a-Si (and no a-Mg2Si) was observed with a peak maximum centered at ∼480 cm−1.28 Additionally, peaks for nano-Si were observed at ∼501 cm−1 and ∼505 cm−1,29,30 which will eventually approach the shift for c-Si ∼520 cm−1 as the crystallite size grows.28 The approximate crystallite size for nano-Si with peak shifts at ∼501 and ∼505 cm−1 was calculated to be 2.0 and 2.3 nm, respectively. These sizes are too small to clearly observe a reflection in the XRD patterns but prove that Si is present in the reaction mixture before the formation of Mg2Si is observed. The presence of a-Si in MgTR reaction has also been previously observed by Lee et al. during the synthesis of Si@SiOx/C composite material for battery application.31
As previously mentioned, for reaction (1) to occur, Mg must be in its most mobile phase (vapor phase) for suitable diffusion.32 348 ± 7 °C is far below the melting point (650 °C) and boiling point (1091 °C) of bulk Mg, yet formation of Si still proceeds. Since surface atoms are less stable compared to bulk atoms due to their lower degree of coordination, surfaces will reach a point of instability well before the bulk, causing it to melt.33,34 This allows for the formation of liquid and likely critical vapor concentration of Mg at 348 ± 7 °C in order to react with SiO2. At this point, SiO2 is converted to a-Si, which then rapidly forms Mg2Si through reaction (2). Once the set temperature had reached ∼541 °C, formation of c-Si was observed and the reflection for Mg2Si at 43° 2θ began to decrease in intensity due to its consumption viareaction (3). Elemental maps of the reduced particle were obtained using electron energy loss spectroscopy (EELS) in a scanning transmission electron microscope (STEM). The maps showed Mg, Si, and O to be distributed throughout the nanoparticle indicating that the reduction predominantly occurs from the long-range diffusion of Mg atoms into the SiO2 structure (Fig. 2B). It is possible for Si and O atoms to diffuse over very short distances, but they do not migrate as much as the Mg atoms.
From these observations, the following can be concluded about the reaction pathway: (i) the production of Si and MgO (reaction (1)) occurs at temperatures much lower than the bulk melting point of Mg (650 °C). (ii) The Si formed is initially amorphous or has very small crystallites which is why it has not been detected in ex situ mechanistic studies. This indicates that the mechanism which involves the direct formation of Mg2Si viareaction (4) is unlikely at these SiO2![[thin space (1/6-em)]](https://www.rsc.org/images/entities/char_2009.gif) :
:![[thin space (1/6-em)]](https://www.rsc.org/images/entities/char_2009.gif) Mg ratios. (iii) The a-Si quickly reacts with Mg viareaction (2) to form Mg2Si, which in turn reacts with SiO2 through (3) to re-form c-Si. Mg2Si is a key intermediate in this mechanism as it fully reacts to form c-Si and is not a parasitic byproduct of a secondary reaction. Since the mechanism of the MgTR is directly related to Mg melting and evaporating, it can be hypothesized that there is a dependence of Mg particle size on the onset temperature and the rate of reactions (1), (2) and subsequently (3) would change. Therefore, further in situ XRD experiments were carried out with a different Mg particle size to study its effect on the reaction mechanism.
Mg ratios. (iii) The a-Si quickly reacts with Mg viareaction (2) to form Mg2Si, which in turn reacts with SiO2 through (3) to re-form c-Si. Mg2Si is a key intermediate in this mechanism as it fully reacts to form c-Si and is not a parasitic byproduct of a secondary reaction. Since the mechanism of the MgTR is directly related to Mg melting and evaporating, it can be hypothesized that there is a dependence of Mg particle size on the onset temperature and the rate of reactions (1), (2) and subsequently (3) would change. Therefore, further in situ XRD experiments were carried out with a different Mg particle size to study its effect on the reaction mechanism.
Effect of Mg particle size
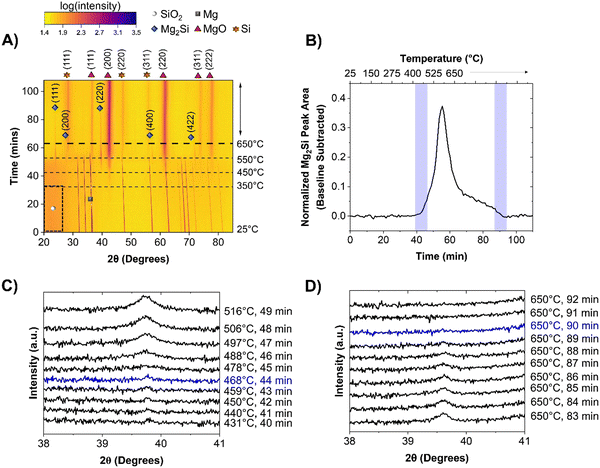
Mg is available in various forms such as ribbons, grains, and powder. It has previously been found through differential scanning calorimetry that when using a smaller Mg particle size (44 μm) compared to a larger particle size (800 μm), the reaction begins around 470 °C and 590 °C, respectively.17 As the sMg (∼23 μm) sample revealed evidence of reaction occurring at 348 ± 7 °C, it is clear that the reaction onset with small particles is actually lower than the previously reported temperatures. To understand the effect of Mg particle size, Mg powder (LMg) with an average particle size of ∼75 μm was chosen as the larger particle analogue (Fig. S3 and S4, ESI†) to compare its reactivity with sMg discussed in the previous section and the SiO2 particle was kept constant at 300 nm.As seen in Fig. 3A, the significant reaction events remain unchanged between the two Mg particle sizes. The Mg particle size therefore does not influence the reaction pathway of the MgTR. Rather, the key difference observed was that the reaction onset was later for most of the events when using LMg, as seen in Fig. 3A and Table 1. MgO began to form at 430 ± 14 °C (as seen in greater detail within Fig. S7, ESI†) which is higher than the reaction onset of 348 ± 7 °C observed with sMg. This difference in reactivity can be attributed to earlier surface melting of sMg compared to LMg, creating higher partial pressure of Mg vapor and subsequent reactivity at low temperatures. This is corroborated using a study performed by Ghildiyal et al., where Mg particle size was found to influence the temperature of vaporization, with smaller particles requiring less heat to evaporate.35 Despite the early onset for reaction (1) when using sMg, the reaction (2) to form Mg2Si was not as different. For the sMg and LMg samples, the formation of Mg2Si is observed at 447 ± 14 and 435 ± 20 °C, respectively (Fig. 1C and 3C). This is likely due to the large activation energy required for Mg2Si formation.36 While the formation of Mg2Si was comparable and within error between the two sizes of Mg particles used, the rate of consumption of Mg2Si was much faster in the sMg sample where it was present for 22 minutes and was completely consumed at 650 °C (Fig. 1B and D). In contrast, with the LMg mixture, the Mg2Si reflection lasted for 46 minutes (Fig. 3B and D). The surface of sMg is likely to be more reactive than LMg, leading to a higher rate of vaporization. This leads to an increase in the rate of reactions (1) and (2) and after Mg is completely consumed, the rates of a-Si and Mg2Si formation decreases, while the rate of c-Si production increases. The surface of LMg is less reactive than sMg and as a result slows down the rate of reactions (1) and (2), leading to Mg2Si persisting for a longer period in LMg than in sMg. Additionally, both reactions (1) and (3) require SiO2. Since reaction (1) involves Mg vapor, which is more mobile than Mg2Si, in a competition for SiO2, reaction (3) may be hindered.
| Reaction event | sMg | LMg | ||
|---|---|---|---|---|
| Time (min) | Temp. (°C) | Time (min) | Temp. (°C) | |
| 650 °C | ||||
| Formation of MgO | 33 | 353 | 42 | 440 |
| Formation of Mg2Si | 43 | 457 | 44 | 468 |
| Formation of c-Si | 52 | 541 | 57 | 591 |
| Disappearance of Mg2Si | 65 | 650 | 90 | 650 |
| Lifetime of Mg2Si | 22 | NA | 46 | NA |
| 450 °C | ||||
| Formation of MgO | 32 | 343 | 39 | 420 |
| Formation of Mg2Si | 41 | 437 | 41 | 439 |
| Formation of c-Si | 55 | 450 | Not observed | NA |
| Disappearance of Mg2Si | 92 | 450 | NA | 450 |
| Lifetime of Mg2Si | 51 | NA | Indefinite | NA |
| Reaction event | Average onset temperatures (events <450 °C) | |
|---|---|---|
| Temp. (°C) | Temp. (°C) | |
| Formation of MgO | 348 ± 7 | 430 ± 14 |
| Formation of Mg2Si | 447 ± 14 | 435 ± 20 |
The Gibbs free energy (ΔG) of the various reactions in relation to the temperature align with the chemical events summarized in Table 1. Both reactions (1) and (2) have negative ΔG values and occur at the beginning of the experiment as seen in Fig. 4. While reaction (1) is forming Si, reaction (2) consumes Si, hence, c-Si is not observed. Above 561 °C, reaction (3) which converts Mg2Si into Si becomes more favorable than reaction (2). However, it is important to note that while the thermodynamic calculations indicate the favorability of different reactions at a given temperature, ΔG is also dependent on other factors including the relative concentrations of reactants, which change throughout the experiment. Furthermore, due to the exothermic nature of reactions (1) and (2), the true temperature within the reactant mixture might be different than the values recorded externally. The sMg sample provides a good example of this as c-Si formation was observed before the set temperature reached 561 °C. This indicates that there is sufficient heat generated locally due to exothermic processes to drive reaction (3) at set temperature <561 °C.
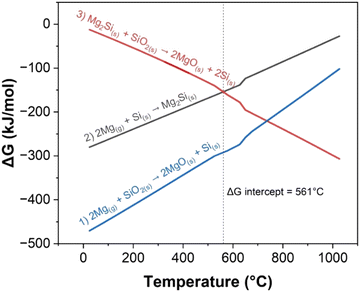 | ||
| Fig. 4 ΔG of reactions (1)–(3) at temperatures up to 1000 °C, calculated using the Shomate equation. At 561 °C the ΔG of reactions (2) and (3) are equal, and above this temperature, reaction (3) becomes more favorable than reaction (2). | ||
Transmission electron microscopy (TEM) images were obtained for acid washed reaction products that were collected at key temperatures for sMg and LMg reacted with SiO2 (Fig. S9, ESI†). The product obtained from sMg reaction showed formation for p-Si at ∼500 °C and significant loss of original SiO2 spherical morphology due to sintering at 650 °C. This further indicates the fast reaction kinetics and heat accumulation when using sMg as the reactant. Whereas reaction product obtained with LMg retained the original spherical morphology, however, complete formation of p-Si was only observed once the temperatures reached 650 °C.
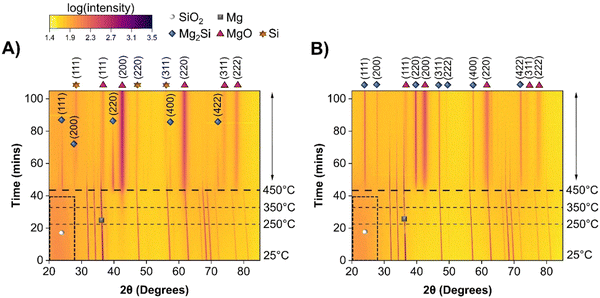
To further understand the role of heat released from the exothermic reactions, the MgTR was performed at a maximum temperature of 450 °C instead of 650 °C. The in situ powder XRD data for sMg and LMg are shown as heatmaps in Fig. 5A and B, respectively.
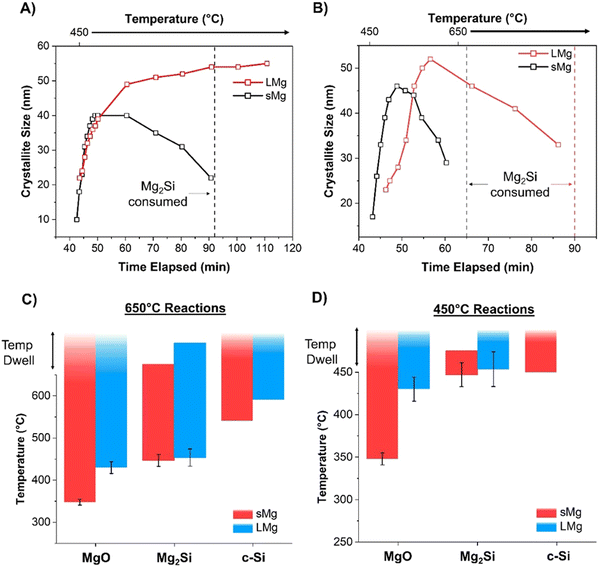
Similar to the 650 °C experiments, formation of MgO was observed at a lower temperature in sMg sample compared to the LMg as seen in Table 1. Once the Mg2Si started to form for each sample, it lasted indefinitely for the LMg sample, whereas Mg2Si reacted further to form c-Si in the sMg sample but after 92 minutes (Fig. S10, ESI†). We hypothesize this difference to be due to the reaction kinetics and amount of heat accumulated per unit time. At 450 °C the production of Mg2Si (reaction (2)) is more favorable than the consumption of Mg2Si (reaction (3)). However, due to the faster rates of exothermic reactions (1) and (2) in sMg sample, it likely results in larger amount of heat accumulated and high enough local temperature to initiate and propel the reaction between Mg2Si and SiO2. The consumption of Mg2Si in the sMg reaction can also be inferred from the reduction of the silicide crystallite size during the dwell period (Fig. 6A). Whereas the slower rate of vaporization when using LMg results in lower reaction rates and less heat being released in a given time frame. The rate of vaporization of Mg leads to significant differences in Mg vapor availability, thus impacting reactions (1) and (2), and subsequently (3) as shown is Scheme 1. It is important to note here that reaction (3) is endothermic at all temperatures considered in this study (Fig. S11A, ESI†), hence it is propelled by the addition of heat. This is why an increase in the yield of Si is seen when the reduction occurs at higher temperatures. While the Mg2Si persisted in the LMg sample at 450 °C, it was noted that the average Mg2Si crystallite size increased over time when dwelling at 450 °C, as seen in Fig. 6A whereas at 650 °C it decreases due its consumption (Fig. 6B). The lifetime of all species involved in the reactions at 650 and 450 °C for sMg and LMg can be seen in Fig. 6C and D, respectively.
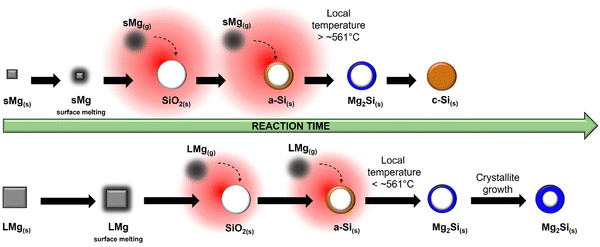 | ||
| Scheme 1 Differences in reactivity with LMg and sMg at 450 °C with depiction of local heat buildup (red halos). | ||
Conclusions
The MgTR reaction mechanisms and pathways have been shown in depth for the first time including the onset of key reactions and the factors controlling them. The reduction begins with the production of a-Si and MgO through reaction (1) at 348 ± 7 °C, which is a lower value than what has been previously reported. The next step was the production of Mg2Si viareaction (2) which is an intermediate that forms at the beginning of the reaction and is then converted to c-Si viareaction (3) if sufficient energy is supplied. The Mg particle size was found to affect the reaction onset temperatures, rates and the final temperature required to form c-Si. Since sMg (∼23 μm) has a relatively higher surface area, the enhanced surface melting leads to sufficient partial pressures of Mg vapor to initiate reaction (1) at low temperatures (348 ± 7 °C). However, due to the large activation barrier for Mg2Si formation, no significant differences in the onset temperature were observed for reaction (2) when comparing Mg particle sizes in this study. Thermodynamic calculations were performed over the temperature range of the MgTR which revealed that the conversion of Mg2Si into Si viareaction (3) was thermodynamically favorable >561 °C. As the small Mg particles vaporize and are consumed quickly, the exothermic reactions can generate enough energy to propel reaction (3) at set temperatures <561 °C. This study highlights that if Mg2Si is being observed in the final product when using Mg![[thin space (1/6-em)]](https://www.rsc.org/images/entities/char_2009.gif) :
:![[thin space (1/6-em)]](https://www.rsc.org/images/entities/char_2009.gif) SiO2 ratios below 3
SiO2 ratios below 3![[thin space (1/6-em)]](https://www.rsc.org/images/entities/char_2009.gif) :
:![[thin space (1/6-em)]](https://www.rsc.org/images/entities/char_2009.gif) 1, the yield of c-Si can be improved by either increasing the reaction temperature or the time (for smaller particles). There is potential to synthesize c-Si at set temperatures lower than 450 °C by using Mg particles smaller than ∼23 μm. If the exothermic reactions occur at fast enough rates, then the accumulated heat can propel c-Si formation. This will have a big impact on the energy footprint of p-Si production via MgTR.
1, the yield of c-Si can be improved by either increasing the reaction temperature or the time (for smaller particles). There is potential to synthesize c-Si at set temperatures lower than 450 °C by using Mg particles smaller than ∼23 μm. If the exothermic reactions occur at fast enough rates, then the accumulated heat can propel c-Si formation. This will have a big impact on the energy footprint of p-Si production via MgTR.
Methods
Materials
Tetraethoxysilane (TEOS, 99.9%) and ammonium hydroxide (NH4OH, 28%) were purchased from Alfa Aesar. Mg powder (−325 mesh powder, 99%) was purchased from Oakwood Chemicals. Mg powder (<0.1 mm, >97.0%), and ethanol (EtOH, 95% solution) were purchased from Sigma-Aldrich. Hydrochloric acid (HCl, 36.5–38.0%) was purchased from Anachemia. All the reagents were used as received without further purification.Synthesis of Stöber SiO2 NPs
Tetraethyl orthosilicate (TEOS, 99.9%, 30 mL) was added to 95% ethanol (EtOH, 700 mL) while stirring at 400 rpm followed by 28% ammonium hydroxide (NH4OH, 60 mL). The reaction vessel was sealed with parafilm and left to stir for 18 h. The reaction mixture was centrifuged at 3300 rpm for 25 min to collect the white solid which consists of SiO2 NPs and the supernatant consisting of reaction by-products was discarded. The NPs were then washed twice by re-dispersing them in EtOH and centrifuging for 15 min at 3300 rpm. The resulting white solid was dried overnight in an oven at 100 °C. The average reaction yield was 89% (7.16 g, 0.118 mol).In situ XRD sample preparation
A mixture of Mg powder (0.18 g, 7.3 mmol) and SiO2 (0.20 g, 3.33 mmol) of various sizes at a 2.2![[thin space (1/6-em)]](https://www.rsc.org/images/entities/char_2009.gif) :
:![[thin space (1/6-em)]](https://www.rsc.org/images/entities/char_2009.gif) 1 molar ratio was ground with a mortar and pestle. The powder mixture was lightly packed into the center of a sapphire capillary tube (1.6 mm OD, 1.4 ID, Saint Gobain). The capillary was secured onto the custom heating stage and connected to a gas line of Ar(g) to maintain an inert atmosphere. A K-type thermocouple (Omega) was placed in the capillary tube, beside the lightly packed powder mixture but not in contact with the reactants (Fig. S1, ESI†). The error associated with the K-type thermocouple was 0.75% of the temperature it was reading. The capillary and thermocouple were sealed using graphite ferrules. Ceramic bars wrapped in nichrome wires were placed 2 mm above and below the capillary to heat the sample. The temperature was controlled using a Cryocon 24 °C temperature controller and the custom heating profiles were controlled through a SPEC interface. The mixtures of Mg and SiO2 were heated from room temperature at a ramp rate of 10 °C min−1 and held at 450 and 650 °C for multiple hours. The heating stage setup can be seen in Fig. S1 (ESI†).
1 molar ratio was ground with a mortar and pestle. The powder mixture was lightly packed into the center of a sapphire capillary tube (1.6 mm OD, 1.4 ID, Saint Gobain). The capillary was secured onto the custom heating stage and connected to a gas line of Ar(g) to maintain an inert atmosphere. A K-type thermocouple (Omega) was placed in the capillary tube, beside the lightly packed powder mixture but not in contact with the reactants (Fig. S1, ESI†). The error associated with the K-type thermocouple was 0.75% of the temperature it was reading. The capillary and thermocouple were sealed using graphite ferrules. Ceramic bars wrapped in nichrome wires were placed 2 mm above and below the capillary to heat the sample. The temperature was controlled using a Cryocon 24 °C temperature controller and the custom heating profiles were controlled through a SPEC interface. The mixtures of Mg and SiO2 were heated from room temperature at a ramp rate of 10 °C min−1 and held at 450 and 650 °C for multiple hours. The heating stage setup can be seen in Fig. S1 (ESI†).
In situ XRD experiment design
In situ analysis was performed at the SLAC National Accelerator Laboratory at SSRL Beamline 2-1. The X-ray beam size was 500 μm (horizontal) by 750 μm (vertical). The beam was not attenuated, and the energy was ≈17.3 keV. Data were collected with a Pilatus 100 K small area detector, with a pixel size of 172 μm, located approximately 700 mm from the sample position. The detector was scanned in steps of 5° with a counting time of 2 seconds per point to cover a range of 10–40° 2θ (21–84° 2θ, Cu Kα). The data was then integrated to linear XRD patterns and converted to Cu Kα for easy comparison. A schematic of the set-up of the beamline can be seen in Fig. S2 (ESI†). The crystallite sizes of Mg2Si were calculated using the Scherrer equation (eqn (5)) shown below where D is the crystallite size, K is the shape factor which depends on the crystallite shape (1.0), λ is the X-ray wavelength, β is the full width at half max (FWHM) of the reflection of interest and θ is the Bragg angle. The FWHM of the Mg2Si reflections were measured through peak fitting with the Proto AXRD Benchtop software. | (5) |
Material characterization
The SEM images were collected on a Hitachi S-4700 electron microscope in secondary electron mode with accelerating voltages of 5 kV and an emission current of 15–20 nA. The samples were prepared by drop-casting ethanolic suspensions of the material of interest onto a Si wafer which was mounted on an aluminum stub. The average sizes of the particles imaged via SEM were determined using ImageJ (version 1.52a). Bright-field TEM images were collected by using a FEI Tecnai-12 at an accelerating voltage of 80 kV and a magnification of 135k×. The powdered samples were dispersed ultrasonically in EtOH for 15 min, and the resulting suspension was drop-cast onto Cu grids with a holey carbon support film by using a micro-pipette. Scanning transmission electron microscopy (STEM) images and EELS measurements were performed on an FEI Titan 80–300 cubed TEM, operated at 300 kV, equipped with CEOS image and probe correctors to give a resolution of 1.2 angstroms. EELS mapping was performed using a Gatan Quantum ER energy filter and a CCD detector, 0.01 s exposure time per pixel, ∼250 pA beam, dispersion 1 eV per channel. Raman spectroscopy was conducted on the Si reaction mixture using a Bruker Senterra II Raman system with a 532 nm laser excitation and CCD detector. The Raman fitting was performed in CasaXPS with GL(30) line shape. The approximate nano-Si crystallite size was calculated viaeqn (6), where, d is the average crystallite size, B is a constant (2.0 cm−1 nm2) and Δw is the difference between the observed shift and the shift for c-Si at 520 cm−1.37,38 | (6) |
Data availability
All the data that support this study are included in this article and its supplementary information files. The source data can be accessed free of charge from https://doi.org/10.15131/shef.data.25342525.v1.Conflicts of interest
The authors declare the following financial interests/personal relationships which may be considered as potential competing interests: Drs. Siddharth Patwardhan and Max Yan have patent pending to be filed. Drs. Mita Dasog, Sarah Martell and Max Yan have filed a provisional patent (US Provisional Application No. 63/537,679).Acknowledgements
SP and MY thank the following funders for supporting this research: EPSRC (EP/P006892/1 and EP/R025983/1), the CDT for Energy Storage and its Applications (EP/L016818/1), the Faraday Institution (Seed Project and Industry Sprint) and UKRI-Mitacs Globalink Doctoral Exchange (NE/V02129X/1). MD thanks Natural Sciences and Engineering Research Council of Canada (NSERC) Discovery Grant and Killam Trusts for the research funding. SM thanks NSERC for graduate fellowship. Patricia Scallion and Isabel Curtis are thanked for their assistance with the SEM analysis. Canadian Centre for Electron Microscopy and Dr Carmen Andrei are thanked for EELS and STEM analysis. Dr Yue Wu from SLAC is thanked for his advice during data collection and Dr Clive Brigden is thanked for the many useful discussions. We thank Dr Daniel A. Geddes from the University of Sheffield for the Raman Spectroscopy measurements. R. H. C. acknowledges support from the U.S. Department of Energy, Office of Science, Office of Basic Energy Sciences under Award Number DE-SC-0020301. Use of the Stanford Synchrotron Radiation Lightsource, SLAC National Accelerator Laboratory, is supported by the U.S. Department of Energy, Office of Science, Office of Basic Energy Sciences under Contract No. DE-AC02-76SF00515.References
- F. Erogbogbo, T. Lin, P. M. Tucciarone, K. M. LaJoie, L. Lai, G. D. Patki, P. N. Prasad and M. T. Swihart, Nano Lett., 2013, 13, 451–456 CrossRef CAS.
- J. Entwistle, A. Rennie and S. Patwardhan, J. Mater. Chem. A, 2018, 6, 18344–18356 RSC.
- E. J. Anglin, L. Cheng, W. R. Freeman and M. J. Sailor, Adv. Drug Delivery Rev., 2008, 60, 1266–1277 CrossRef CAS.
- V. Torres-Costa and R. J. Martín-Palma, J. Mater. Sci., 2010, 45, 2823–2838 CrossRef CAS.
- F. A. Harraz, Sens. Actuators, B, 2014, 202, 897–912 CrossRef CAS.
- S. Putwa, I. S. Curtis and M. Dasog, iScience, 2023, 26, 106317 CrossRef CAS PubMed.
- M. G. Voronkov, Russ. J. Appl. Chem., 2007, 80, 2190–2196 CrossRef CAS.
- H. Song, D. Liu, J. Yang, L. Wang, H. Xu and Y. Xiong, ChemNanoMat, 2017, 3, 22–26 CrossRef CAS.
- W. Simmler, Silicon. In Ullman's Encyclopedia of Industrial Chemistry, Wiley VCH, Weinheim, Germany, 2011, pp. 1–29 Search PubMed.
- S. G. Hutchison, L. S. Richardson and C. M. Wai, Metall. Mater. Trans. B, 1988, 19, 249–253 CrossRef.
- A. Santos and T. Kumeria, Electrochemical Etching Methods for Producing Porous Silicon. In Electrochemically Engineered Nanoporous, Materials: Methods, Properties and Applications, ed. D. Losic and A. Santos, Springer Series in Materials Science, Springer International Publishing, Cham, 2015, pp. 1–36 Search PubMed.
- K. W. Kolasinski, Porous Silicon Formation by Stain Etching, in Handbook of Porous Silicon, ed. L. Canham, Springer International Publishing, Cham, 2017, pp. 1–21 Search PubMed.
- W. Simmler, Silicon Compounds, Inorganic, in Ullman's Encyclopedia of Industrial Chemistry, Wiley VCH, Weinheim, Germany, 2011, pp 1–17 Search PubMed.
- F. Dai, J. Zai, R. Yi, M. L. Gordin, H. Sohn, S. Chen and D. Wang, Nat. Commun., 2014, 5, 3605 CrossRef PubMed.
- N. Harpak, G. Davidi, D. Schneier, S. Menkin, E. Mados, D. Golodnitsky, E. Peled and F. Patolsky, Nano Lett., 2019, 19, 1944–1954 CrossRef CAS.
- S. Maldonado, ACS Energy Lett., 2020, 5, 3628–3632 CrossRef CAS.
- Z. Yang, Y. Du, G. Hou, Y. Ouyang, F. Ding and F. Yuan, Electrochim. Acta, 2020, 329, 135141 CrossRef CAS.
- M. Yan, S. Martell, M. Dasog, S. Brown and S. V. Patwardhan, J. Power Sources, 2023, 588, 233720 CrossRef CAS.
- I. S. Curtis, Mesoporous Silicon Nanoparticles for Solar-Driven Hydrogen Generation from Water, Master's thesis, Dalhousie University, 2021 Search PubMed.
- J. E. Entwistle, G. Beaucage and S. V. Patwardhan, J. Mater. Chem. A, 2020, 8, 4938–4949 RSC.
- N. Liu, K. Huo, M. T. McDowell, J. Zhao and Y. Cui, Sci. Rep., 2013, 3, 1–7 Search PubMed.
- W. Luo, X. Wang, C. Meyers, N. Wannenmacher, W. Sirisaksoontorn, M. M. Lerner and X. Ji, Sci. Rep., 2013, 3, 1–7 Search PubMed.
- I. Gutman, I. Gotman and M. Shapiro, Acta Mater., 2006, 54, 4677–4684 CrossRef CAS.
- I. Gutman, L. Klinger, I. Gotman and M. Shapiro, Solid State Ion., 2009, 180, 1350–1355 CrossRef CAS.
- Q. Liu, Y. Ji, X. Yin, J. Li, Y. Liu, X. Hu and Z. Wen, Energy Storage Mater., 2022, 46, 384–393 CrossRef.
- M. Barati, S. Sarder, A. McLean and R. Roy, J. Non-Cryst. Solids, 2011, 357, 18–23 CrossRef CAS.
- J.-K. Yoo, J. Kim, M.-J. Choi, Y.-U. Park, J. Hong, K. M. Baek, K. Kang and Y. S. Jung, Adv. Energy Mater., 2014, 4, 1400622 CrossRef.
- I. S. Curtis, R. J. Wills and M. Dasog, Nanoscale, 2021, 13, 2685–2692 RSC.
- Z. Iqbal, S. Vepřek, A. P. Webb and P. Capezzuto, Solid State Commun., 1981, 37, 993–996 CrossRef CAS.
- P. Wong, D. Lien, H.-T. Chen, Y.-T. Chen and K.-H. Chen, Green Chem., 2012, 14, 896–900 RSC.
- J. Lee, J. Moon, S. A. Han, J. Kim, V. Malgras, Y.-U. Heo, H. Kim, S.-M. Lee, H. K. Liu, S. X. Dou, Y. Yamauchi, M.-S. Park and J. H. Kim, ACS Nano, 2019, 13, 9607–9619 CrossRef CAS PubMed.
- Z. Bao, M. R. Weatherspoon, S. Shian, Y. Cai, P. D. Graham, S. M. Allan, G. Ahmad, M. B. Dickerson, B. C. Church, Z. Kang, H. W. A. Iii, C. J. Summers, M. Liu and K. H. Sandhage, Nature, 2007, 446, 172–175 CrossRef CAS PubMed.
- S. Sarkar, C. Jana and B. Bagchi, J. Chem. Sci., 2017, 129, 833–840 CrossRef CAS.
- C. Chakravarty, P. G. Debenedetti and F. H. Stillinger, J. Chem. Phys., 2007, 126, 204508 CrossRef PubMed.
- B. Wagner, P. Ghildiyal, P. Biswas, M. Chowdhury, M. R. Zachariah and L. Mangolini, Adv. Funct. Mater., 2023, 33, 2212805 CrossRef CAS.
- B. Sun, S. Li, H. Imai, J. Umeda and K. Kondoh, Powder Technol., 2012, 217, 157–162 CrossRef CAS.
- Z. Li, W. Li, Y. Jiang, H. Cai, Y. Gong and J. He, J. Raman Spectrosc., 2011, 42, 415–421 CrossRef CAS.
- Y. He, C. Yin, G. Cheng, L. Wang, X. Liu and G. Y. Hu, J. Appl. Phys., 1994, 75, 797–803 CrossRef CAS.
Footnotes |
| † Electronic supplementary information (ESI) available. See DOI: https://doi.org/10.1039/d4nh00244j |
| ‡ These authors contributed equally to the work and their names can be listed in any order. |
| This journal is © The Royal Society of Chemistry 2024 |

