Xuan
Zheng
a,
Jiace
Hao
a,
Zechao
Zhuang
b,
Qi
Kang
c,
Xiaofan
Wang
a,
Shuanglong
Lu
a,
Fang
Duan
a,
Mingliang
Du
*a and
Han
Zhu
*a
aKey Laboratory of Synthetic and Biological Colloids, Ministry of Education, School of Chemical and Material Engineering, Jiangnan University, Wuxi 214122, China. E-mail: zhysw@jiangnan.edu.cn; du@jiangnan.edu.cn
bDepartment of Chemical Engineering, Columbia University, New York, NY 10027, USA
cInstitute of New Energy for Vehicles, School of Materials Science and Engineering, Tongji University, Shanghai, 201804, China
First published on 31st January 2024
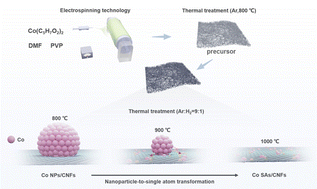
The rising top-down synthetic methodologies for transition metal single-atom catalysts (SACs) require controlled movement of metal atoms through the substrates; however, their direct transportation towards the ideal carrier remains a huge challenge. Herein, we showed a “top down” strategy for Co nanoparticles (NPs) to Co SA transformation by employing electrospun carbon nanofibers (CNFs) as atom carriers. Under high-temperature conditions, the Co atoms migrate from the surfaces of Co NPs and are then anchored by the surrounding carbon to form a Co-C3O1 coordination structure. The synthesized Co SAs/CNF electrocatalyst exhibits excellent electrocatalytic nitrate reduction reaction (NO3RR) activity with an NH3 yield of 0.79 mmol h−1 cm−2 and Faraday efficiency (FE) of 91.3% at −0.7 V vs. RHE in 0.1 M KNO3 and 0.1 M K2SO4 electrolytes. The in situ electrochemical characterization suggests that the NOH pathway is preferred by Co SAs/CNFs, and *NO hydrogenation and deoxygenation easily occur on Co SAs due to the small adsorption energy between Co SAs and *NO, as calculated by theoretical calculations. It is revealed that a small energy barrier (0.45 eV) for the rate determining step (RDS) ranges from *NO to *NOH and a strong capability for inhibiting hydrogen evolution (HER) significantly promotes the NH3 selectivity and activity of Co SAs/CNFs.
In recent years, single-atom catalysts (SACs) have attracted widespread attention in the electrocatalysis field owing to their excellent catalytic activities.10–12 “Top down” and “bottom up” are two general strategies for the synthesis of SACs. In “bottom up” strategies, metal−organic frameworks (MOFs) are the widely used substrates for anchoring the SA under high temperatures.13,14 However, owing to their high surface energy and low coordination numbers, the synthesis of stable SA still suffers from the aggregation trend into larger nanoparticles (NPs) during the following thermal process at high temperatures, which may reduce their catalytic performance.15–17 For the “top down” strategies, the MOF-derived carbon has limited vacant sites for metal atom confinement, which leads to a mixed existence of SA and NP and small metal loading of SA.15 Accordingly, developing novel strategies to overcome these limitations in the synthesis of SACs is highly desirable. However, controlling the movement of metal atoms through the substrates and directly transporting them towards the ideal carrier remain huge challenges in the field of SAC preparation.
Herein, we used electrospun nanofiber as an atom carrier to control the transformation from Co NPs to Co SAs. Under high-temperature treatment, the Co atoms migrate from the surfaces of preformed Co NPs in carbon nanofibers (Co NPs/CNFs), and the Co atoms are further coordinated by the surrounding carbon to form a Co-C3O1 coordination structure, suggesting controlled NP-to-SA transformation. The synthesized Co SA/CNF electrocatalyst exhibits excellent NO3RR activity with an NH3 yield of 0.79 mmol h−1 cm−2 and an FE of 91.3% at −0.7 V vs. RHE in 0.1 M KNO3 and 0.1 M K2SO4 electrolytes, respectively. In situ electrochemical characterization verified the formation of critical reaction intermediates during the reaction, that is, Co SAs/CNFs preferred to react in the reaction pathway of *NO3− → *NO2− → *NO → *NOH → *N → *NH → *NH2 → *NH3. Theoretical calculations reveal that Co SAs show a smaller energy barrier for the RDS step of *NO to *NOH when compared with Co NPs, leading to superior selectivity in ammonia synthesis.
As depicted in Fig. 1a and S1,† densely and uniformly Co NPs with sizes ranging from 7.48 ± 4.5 nm were in situ synthesized in CNFs at 800 °C under Ar atmosphere. The Co NPs were completely encapsulated in graphitized carbon shells via the self-catalyzed conversion of amorphous carbon by the Co NPs (Fig. 1b). The interplanar spacing of 0.18 nm corresponds to the (200) planes of the Co NPs. Scanning transmission electron microscopy energy-dispersive spectroscopy (STEM-EDS) mapping images of Co NPs/CNFs show a uniform distribution of C and O elements, which can be attributed to the PVP-derived CNFs (Fig. 1c). The Co element distribution was according to the Co NP morphology, which can also be verified by the corresponding line scan EDS spectra (Fig. S2†). The initial near-spherical Co NPs turned to irregularity with decreased size (3–5 nm) when the Co NPs/CNFs were heated to 900 °C.
Meanwhile, the atomically dispersed Co atoms emerged around the Co NPs, suggesting the cleavage of Co–Co bonds from the Co NPs triggered by the elevated temperature, as revealed by the HAADF-STEM image (Fig. S3†) and STEM-EDS mapping images (Fig. S4†) of Co NPs-Co SAs/CNFs (900 °C). Atomical-resolution high-angle annular dark-field STEM image (Fig. 1d and e) indicates that the Co NPs completely vanished when the Co NPs/CNFs were further heated to 1000 °C. Abundant atomically dispersed Co atoms identified as bright spots were observed on the CNF substrates. Meanwhile, Fig. S5† illustrates the disappearance of Co NPs, suggesting the successful transformation from Co NPs to Co SAs. STEM-EDS mapping images confirm the homogeneous distribution of Co across the entire CNFs without any aggregation of Co elements (Fig. 1f). Inductively coupled plasma-atomic emission spectrometry (ICP-AES) shows that the Co content in Co SAs/CNFs was 0.37 wt%, which was similar to that of Co NPs/CNFs (0.32 wt%, Table S1†). The atomical transformation from Co NPs to Co SAs was further investigated using X-ray diffraction (XRD). As shown in Fig. 1g, the broad bands located at 44.0° correspond to the (101) planes of graphite carbon,18 which were observed in CNFs, Co NP/CNFs and Co SA/CNFs. The Co NPs/CNFs show typical diffraction peaks assigned to the (111) and (200) planes of the face-centered cubic (fcc) cobalt phase. However, no characteristic peak was detected for the Co crystals in the Co SA/CNFs, which is consistent with the STEM results. Raman spectra (Fig. 1h) further confirmed the relatively higher degree of defected carbon structures in Co SAs/CNFs with a higher ID/IG value (1.33),19 which is beneficial for the trapping and anchoring of Co SAs.
The chemical states and coordination environments of Co SAs/CNFs were investigated using X-ray absorption spectroscopy (XAS). As shown in Fig. 2a, the Co K-edge X-ray absorption near-edge structure (XANES) of Co SAs/CNFs shows a white line peak between the Co foil and CoO, indicating that the Co SAs carry a positive charge and show the 0 to +2 oxidation state of Co. The corresponding Fourier-transformed (FT) k3-weighted extended X-ray absorption fine structure (EXAFS) spectra (Fig. 2b) suggested that no Co–Co bonds were observed in the Co SAs/CNFs, suggesting that the Co NPs were completely transformed into Co SAs in the CNF matrix. This suggested that there were no Co NPs or clusters in Co SAs/CNF, which were consistent with the STEM and XRD results. The broad and asymmetric peaks located at ∼1.8 Å were ascribed to the Co–C or Co–O coordination. X-ray photoelectron spectroscopy (XPS) of Co SAs/CNFs and Co NPs/CNFs is shown in Fig. 2c and Fig. S6, S7.† The binding energies (BEs) for Co–O and Co–C bonds in Co SAs/CNFs emerged at 780.0 eV and 782.5 eV, respectively, suggesting the coordination of Co with C and O.20–22 The binding energies at 778.6 eV and 793.6 eV observed in the Co 2p XPS spectra provided evidence for the presence of metallic cobalt (Co0) in the Co NPs/CNFs, while these characteristic peaks were absent in the Co SAs/CNFs, which are consistent with our previous findings from XRD and TEM results. The high-resolution O 1s XPS spectra (Fig. S7†) of Co SAs/CNFs and Co NPs/CNFs both show two peaks attributed to Co–O and C–O bonds, again proving the existence of coordination.22,23
Quantitative analysis of EXAFs at the Co K-edge was performed by fitting theoretical EXAF spectra to experimental data in R-space and K-space (Fig. S8†) to further understand the Co coordination environment. It was observed that the fitting curves matched quite well with the experimental spectra. Each Co central atom in the first shell has a coordination number of four and is directly connected by three C atoms and one O atom, with average bond lengths of 2.07 Å and 1.96 Å, respectively (Table S2†). Meanwhile, owing to the powerful resolution in both K and R spaces, the Co K edge wavelet transform (WT)-EXAFS was applied to investigate the atomic configuration of the Co SAs/CNFs. The wavelet transform (WT) plots of Co SA/CNFs further reveal the maximum peak at 6.0 Å−1 attributed to the Co–C3O1 bonds (Fig. 2d–f).
The electrocatalytic NO3RR performance of Co NPs/CNFs and Co SAs/CNFs was investigated in H-type cells with Ar-saturated aqueous electrolyte containing 0.5 M K2SO4 and 0.1 M KNO3 (Fig. S9†). Fig. S10† shows the linear sweep voltammetry (LSV) curves of the Co SAs/CNFs, indicating higher current density in the presence of NO3− from 0 to −1.10 V vs. RHE than that without NO3− conditions, suggesting the participation of NO3− in the NO3RR process. As shown in Fig. 3a, the current density of Co SAs/CNFs can reach −74 mA cm−2 at −0.7 V vs. RHE, which is significantly higher than that of Co NPs/CNFs (−32 mA cm−2), indicating that Co SAs/CNFs could significantly enhance the NO3RR activity. The chronoamperometry curves of Co SAs/CNFs, Co NPs/CNFs and pure CNFs were measured at various potentials (−0.4 ∼ −0.8 V vs. RHE) to quantify the NO3RR performance with FEs and yields of different products, including nitrite (NO2−), H2 and NH3 (Fig. S11–S13†). The liquid products (NH4+, NO2− and N2H4) were detected by ultraviolet–visible spectroscopy (UV-Vis) (Fig. S14–S16†), while the gas product (H2) was detected by online gas chromatography (GC). As expected, the Co SAs/CNFs show the NH4+ FE (FENH4+) of 91.3% at −0.7 V vs. RHE, which is higher than that of Co NPs/CNFs (FENH4+ of 61.5%) and pure CNFs (FENH4+ of 27.5%) at −0.7 V vs. RHE (Fig. 3b and S17†). Both of the FENH4+ and NH4+ yield rates (YNH4+) for Co SAs/CNFs exhibit volcano curves ranging from −0.4 to −0.8 V vs. RHE. The Co SAs/CNFs display the YNH4+ of 0.79 mmol h−1 cm−2 at −0.7 V vs. RHE, which is 2.5 times higher than those of Co NPs/CNFs (YNH4+ = 0.31 μmol h−1 cm−2) at 0.5 V vs RHE, suggesting the key role of Co SAs in the NO3RR (Fig. 3c). In addition, the possible N2H4 byproducts were not detected in the electrolyte after testing (Fig. S11–S13†). To confirm the ammonia product that comes from NO3RR catalyzed by Co SAs/CNFs, several tests are performed to eliminate the disturbance of environmental contamination. We further used ethylene diamine tetraacetic acid (EDTA) as a chelating agent to reveal the origin of NO3RR activity. As shown in Fig. S18,† when EDTA was added into the electrolyte during the i–t curves, the current density decreased immediately, indicating that the Co SAs were the real active sites for NO3RR.
The isotope labeling was used to trace the N source in NH3 production. The 14NO3− and 15NO3− were used as the feeding nitrogen sources, and the NH3 products were determined by 1H nuclear magnetic resonance (NMR) measurements. As shown in Fig. S19,† the doublet peaks of 15NH4+ were observed when 15NO3− was used as a source, while the detected triplet peaks of 14NH4+ were ascribed to the 14NO3− source. Fig. 3d depicts that the peak area of 1H NMR is directly proportional to the NH3 content using 14NO3− and 15NO3− as the feeding nitrogen sources. The FENH4+ and YNH4+ calculated by 1H NMR using 14NO3− and 15NO3− as sources agreed with those determined by UV-vis spectroscopy (Fig. 3e). The results demonstrate that the NH3 products are produced by the NO3RR. The electrochemical impedance spectroscopy of Co SAs/CNFs (Fig. S20 and Table S3†) exhibits the smallest charge transfer impendence of ∼18 Ω when compared with those of the Co NPs/CNFs (∼27 Ω), and CNFs (∼37 Ω), suggesting the fastest NO3RR kinetics of Co SAs/CNFs. In addition, the double-layer capacity (Cdl) of Co SAs/CNFs is 28.3 mF cm−2, which is significantly higher than that of Co NPs/CNFs (20.1 mF cm−2), which can provide a larger electrochemical active surface area (ECSA) and thus promote the synthesis of ammonia (Fig. 3f and S21†). Interestingly, the LSV curves normalized by ECSA display that the Co SAs/CNFs still exhibit a higher current density when compared with Co NPs/CNFs, demonstrating the intrinsic activity of Co SAs/CNFs (Fig. S22†). In addition, the stability of electrocatalysts is critical in industrial applications. The NO3RR on Co SAs/CNFs performed at −0.7 V vs. RHE for 15 consecutive cycles indicated no significant attenuation, and the FENH4+ was also maintained around 90%, thus confirming its excellent stability (Fig. 3g). The atomic-scale HAADF-STEM images (Fig. S23†) of Co SAs/CNFs further confirm that the monoatomic morphology of Co is well maintained after long-term NO3RR electrocatalytic experiments, demonstrating that the stability of coordinated Co-C3O1 favors efficient NO3− electrolysis into NH4+. Furthermore, the CV stability (Fig. S24†) test shows that the current density barely changes after the long-term stability test, which further demonstrates the excellent long-term stability of Co SAs. Finally, the electrocatalytic NO3RR capability of Co SAs/CNFs was compared with other reported cobalt-containing catalysts or single-atom catalysis. As shown in Fig. 3h and ESI Table S4,† the Co SAs/CNFs demonstrate superior NO3RR performance in terms of the YNH4+ and FENH4+ compared with the recently reported Co-based electrocatalyst.24–37
In situ characterization was further used to investigate the reaction pathways over Co SAs/CNFs by directly identifying the reaction intermediates. The identification of potential intermediates generated during the NO3RR was explored by online differential electrochemical mass spectrometry (DEMS, Fig. 4a). The DEMS signals recorded at −0.7 V vs. RHE show that m/z = 31, 30, 17, 16, 15, and 14, which were ascribed to the NOH, NO, NH3, NH2, NH, and N intermediates, respectively. Notably, the key intermediate of *NH2OH for the NHO pathway was not detected. This observation suggests that the NOH pathway is the main pathway preferred by Co SAs/CNFs, which involves the following steps: *NO → *NOH → *N → *NH → *NH2 → *NH3. In situ Raman spectroscopy recorded on Co SAs/CNFs during the NO3RR electrolysis is shown in Fig. 4b† and S25.† The peak that emerged at 1080 cm−1 was attributed to the absorbed NO3− on Co SAs/CNFs and with a more negative potential ranging from 0 to −1.1 V vs. RHE; the peak intensity for NO3− continuously decreased, suggesting the NO3− consumption for NO3RR over Co SAs/CNFs.38,40 In addition, the Raman peak at 982 cm−1 was identified as an adsorbed sulfate species (SO42−) on the catalyst surface. The above results demonstrate the NO3RR reaction pathways on Co SAs/CNFs.39,40
Density functional theory (DFT) calculations were further used to explore the mechanism of Co SAs. The STEM and EXAFS results were used to construct the Co SAs/CNFs model, and details can be found in the ESI.† According to the HRTEM analysis, the (200) crystal plane is the main exposed facet in the Co NPs; therefore, the Co (100) surface was used as the model for the calculations. Based on the detected intermediates, the reaction pathway was simulated via DFT calculations, as presented in Fig. S26† and Fig. 4c. First, the NO3− ions were adsorbed on catalyst surfaces to form *NO3, and the decreased total energy indicated a spontaneous reaction. Then, the N–O bond is continuously cleaved through proton-coupled electron transfer to form *NO2 and *NO. Subsequently, under hydrogenation conditions, the *NO intermediate is gradually transformed into *HOH, *N, *NH, and *NH2 and is finally converted to *NH3. The hydrogenation from *NO to *NOH over Co SAs and Co NPs is the rate-determining step (RDS). The Co SAs exhibit Gibbs free energy (ΔG) for an RDS step of 0.45 eV, which is smaller than that of Co NPs (ΔG = 0.78 eV), highlighting the critical role of Co SAs in facilitating the kinetics of NO3RR. The results demonstrate the superior NO3RR activity of Co SAs compared to Co NPs. As shown in Fig. 4d, the charge transfer between Co NPs and *NO was 0.49 eV, which was higher than that between Co SAs and *NO (0.25 eV). This indicates that the excessive charge transfer results in a strong adsorption energy between Co NPs and *NO, which could affect *NO hydrogenation and subsequent deoxygenation. Therefore, the *NO hydrogenation and deoxygenation easily occurred on Co SAs. In addition, the density of states (DOS) in relation to the electronic structure and the corresponding d-band center of Co SAs/CNFs (−0.8 eV) and Co NPs/CNFs (−1.4 eV) were also calculated. The lower d-band center for Co SAs/CNFs demonstrates that the distribution of d-band electrons is closer to the Fermi level, resulting in strong absorption for key intermediates of *NOH (Fig. S27†). In addition, the energy barrier for the generation of byproduct H2 by Co SAs/CNFs is 0.25 eV, which is significantly higher than that of Co NPs/CNFs (0.18 eV), indicating an inhibitory effect of Co SAs/CNFs on H2 generation (Fig. 4e). The results demonstrate that the Co SAs could significantly reduce the energy barrier of the RDS steps (*NO → *NOH) and suppress the competing HER, thus leading to remarkable electrocatalytic activity.
Footnote |
† Electronic supplementary information (ESI) available. See DOI: https://doi.org/10.1039/d3nr05331h |
This journal is © The Royal Society of Chemistry 2024 |