Interfacial electric field construction of hollow PdS QDs/Zn1−xCdxS solid solution with enhanced photocatalytic hydrogen evolution†
Cheng
Guo‡
a,
Zongyi
Huang‡
b,
Xinrui
Long
a,
Yuchen
Sun
a,
Pengfei
Ma
c,
Quanxing
Zheng
c,
Hongliang
Lu
c,
Xiaodong
Yi
 b and
Zhou
Chen
 *a
*a
aCollege of Materials, Key Laboratory of High Performance Ceramics Fibers (Xiamen University), Ministry of Education, Xiamen University, Xiamen 361005, China. E-mail: zhouchen@xmu.edu.cn
bState Key Laboratory of Physical Chemistry of Solid Surfaces, College of Chemistry and Chemical Engineering, Xiamen University, Xiamen 361005, China
cTechnology Center, China Tobacco Fujian Industrial Co., Ltd, Xiamen 361021, China
First published on 22nd December 2023
Abstract
The regulation of hollow morphology, band structure modulation of solid solution, and introduction of cocatalysts greatly promote the separation of electron–hole pairs in photocatalytic processes, which is of great significance for the process of photocatalytic hydrogen evolution (PHE). In this study, we constructed Zn1−xCdxS hollow solid solution photocatalysts using template and ion exchange methods, and successfully loaded PdS quantum dots (PdS QDs) onto the solid solution through in situ sulfidation. Significantly, the 0.5 wt% PdS QDs/Zn0.6Cd0.4S composite material achieved a H2 production rate of 27.63 mmol g−1 h−1 in the PHE process. The hollow structure of the composite material enhances processes such as light reflection and scattering, the band structure modulation of the solid solution enables the electron–hole pairs to reach an optimal exciton recombination balance, and the modification of PdS QDs provides abundant sites for oxidation, thereby promoting the proton reduction and hydrogen evolution rate. This work provides valuable guidance for the rational design of efficient composite PHE catalysts with strong internal electric field.
1. Introduction
In recent years, there has been a growing recognition of the detrimental environmental impact and energy crisis resulting from the combustion of fossil fuels.1–3 As a response, renewable energy sources have gained significant importance, especially in the pursuit of carbon peaking and carbon neutrality goals. Consequently, the demand for renewable energy supply has substantially increased. Photocatalytic hydrogen evolution (PHE) has emerged as a promising alternative to traditional fossil fuels.4,5 It harnesses clean solar energy and utilizes water as the primary resource, thereby avoiding any secondary energy consumption.6 Furthermore, PHE does not produce hazardous by-products or pollutants.7,8 The hydrogen produced through this process serves as an energy carrier that, when combined with oxygen from the air, produces pollution-free water through a fuel cell device.9,10 As a results, the development of nano-materials with modified structure of catalysts could regulate the catalytic reaction pathways for efficient hydrogen production, which has garnered significant attention.11,12 This innovative approach of storing solar energy as chemical energy exhibits immense potential for industrial applications.13,14 By capitalizing on this method, solar energy can be effectively converted into a sustainable and accessible form of energy, contributing to the advancement of a greener and more sustainable future.Sulfide metal semiconductors have gained prominence due to their excellent reduction performance and visible light response, attributed to their high potential and relatively narrow bandgap in the conduction band. For examples, CdS,15–18 ZnIn2S4,19–23 and ZnS24,25 have been extensively employed in water splitting to produce hydrogen energy. CdS, a representative catalyst for PHE, necessitates sacrificial agents due to its low valence band position, resulting in wastage. Moreover, CdS is susceptible to photo-corrosion during photocatalysis, compromising its stability. To overcome these challenges, ZnS, with its wide bandgap, can form a solid solution with CdS in any ratio, creating Zn1−xCdxS. This composite allows for the adjustment of the CdS bandgap by varying the Zn/Cd ratio. As a result, the stability and hydrogen production performance of CdS have been significantly enhanced without requiring co-catalysts. However, the industrial application of Zn1−xCdxS is not yet fully realized, and several methods have been explored to improve its performance, including co-catalysts doping,26 vacancy formation,27 morphology engineering28 and heterojunction engineering.29 Nevertheless, these approaches are complex and costly in terms of preparation.
Within the catalytic reaction system of solar-driven water splitting, incorporating a hollow morphology in the catalyst can effectively enhance the utilization of visible light and improve the performance of the hydrogen evolution reaction (HER). The preparation of hollow structure catalyst yields a larger specific surface area, exposed more active site,15 and enhanced light absorption through reflective and scattering effect.30 Consequently, the efficiency of photocatalysis is greatly enhanced. Furthermore, the well-defined separation space within the hollow catalyst minimizes side reactions during the photocatalytic process, thereby enhancing the overall stability of the photocatalytic reaction.
Quantum dots have garnered significant attention in the field of PHE due to their remarkable photophysical and photochemical properties. These nanoscale semiconductor particles exhibit a wide light response range, enabling them to convert near-infrared light into short-wavelength light, effectively exciting valence band electrons in luminescent catalysts and facilitating the efficient utilization of visible light.31 The ability of quantum dots to undergo multi-exciton generation is particularly advantageous, as it greatly enhances the quantum efficiency of photocatalysis.32 Furthermore, quantum dots possess small particle size and large specific surface area, providing a wealth of active sites for catalytic reactions. Many common photocatalysts have been modified with quantum dots with different morphology33 and electronic structure34,35 to achieve a good photocatalytic performance. This approach aims to achieve a synergistic effect, leveraging the strengths of both materials and enabling the attainment of higher efficiency in the HER. These advancements hold promise for further advancements in the field of PHE.
Based on the aforementioned research, we have successfully developed a novel photocatalyst, namely a hollow hexagonal prism-shaped PdS QDs/Zn1−xCdxS composite, employing a series of processes including sulfidation, ion exchange, and in situ sulfidation, starting from a hexagonal prism ZnO. By creating a solid solution, we have effectively controlled the band gap of ZnS, which is too wide, and CdS, which is too narrow. This approach not only reduces the energy required for electron transitions in the valence band but also mitigates the recombination of electron–hole pairs, thereby enhancing the overall efficiency of the photocatalytic process. The unique hollow structure of the catalyst provides a larger surface area and increased number of active sites, further promoting efficient photocatalytic reactions. Additionally, through the introduction of PdS quantum dots, we have significantly improved the photocatalytic performance of Zn1−xCdxS. This modification facilitates the rapid separation of electron–hole pairs, thus accelerating the kinetic process of photocatalytic reactions. The results of our study demonstrate remarkable outcomes. Under visible light conditions (with a wavelength of 420 nm < λ < 800 nm), the PHE activity of the 0.5 wt% PdS QDs/Zn0.6Cd0.4S photocatalyst reached an impressive value of 27.63 mmol g−1 h−1, which is 6 and 963 times higher than that of ZnS and Zn0.6Cd0.4S, respectively. Furthermore, the stability of the photocatalyst has also been improved, adding to its practical viability. These findings of this research highlight the significant potential of utilizing adjustable band gap solid solutions, as well as the construction of hollow structures and incorporation of quantum dots, to synergistically enhance the photocatalytic activity of PHE. These advancements pave the way for the development of more efficient and sustainable photocatalytic systems in the future.
2. Results and discussion
2.1 The structure of synthesized solid solution materials
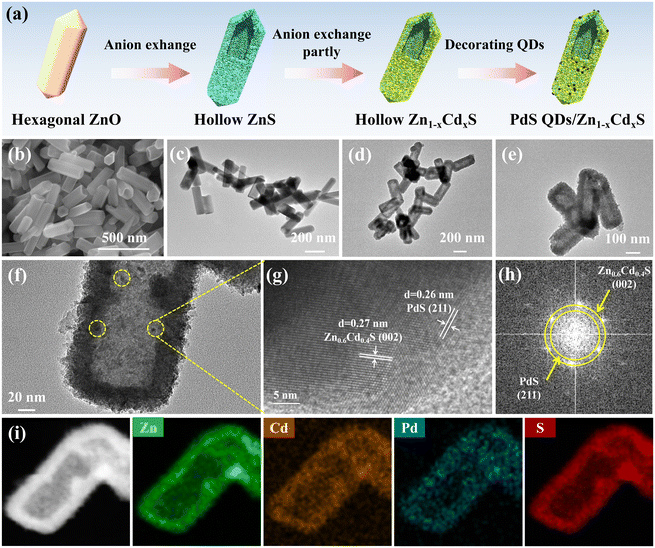
Herein, we demonstrate a template-based and ion exchange approaches to synthesize hollow Zn1−xCdxS solid solution, and then decorated the PdS quantum dots on its surface to form composite nanomaterials (Fig. 1a). Firstly, hexagonal ZnO template was synthesized successfully and we can observe that these nanoparticles’ particle size were approximately near 500 nm (Fig. 1b). Then hollow ZnS was obtained by anion exchange in the presence of sulfur source under hydrothermal condition. Obviously, the hollow morphology of ZnS was maintained and the particle size decreased fractionally (Fig. 1c). By controlling the ratio of Zn and Cd sources, we can get the hollow Zn0.6Cd0.4S solid solution by anion exchange (Fig. 1d). We then decorated PdS QDs on the surface of Zn0.6Cd0.4S solid solution (Fig. 1e). As showed in Fig. 1f, some black dots can be easily observed which were PdS QDs. These QDs were approximately 3 nm, which confirmed the quantum dots morphology of PdS.Nevertheless, to further examine the microstructure of 0.5 wt% PdS QDs/Zn0.6Cd0.4S, high-resolution TEM (HRTEM) was employed. As shown in Fig. 1g, the lattice spacing of 0.27 nm corresponds to the (002) plane of Zn0.6Cd0.4S, which existed lattice distortion after Cd2+ ion was mixed no ZnS lattices. And the lattice spacing of 0.26 nm corresponds to the (211) plane of PdS (PDF#25-1234). Subsequently, the corresponding selected area electron diffraction (SAED) pattern in displays two sets of diffraction fringes, proving more evidence about two phases of Zn0.6Cd0.4S and the decorated PdS (Fig. 1h). Additionally, element mappings spectroscopy (EDX) result confirmed that Cd, Zn, S signals were distributed evenly on the surface of Zn0.6Cd0.4S solid solution (Fig. S1†). As show in Fig. 1i, Pd signal was also detected which confirmed PdS QDs were decorated successfully and the hollow morphology was not destroyed.
In addition, the actual ratio of Zn and Cd in Zn1−xCdxS were measured utilizing energy dispersive X-ray (EDX) analysis and the results were showed in Table S1.† It can be seen that the ratio was close to the theoretical results.
The XRD pattern of the ZnO sample displays typical diffraction peaks, confirming the successful preparation of hexagonal prism-shaped ZnO crystals with high crystallinity (Fig. S2†). The primary peaks of hexagonal ZnO (PDF#36-1451) are situated at approximately 31.7°, 34.4°, and 36.2°, which correspond to the (100), (002), and (101) crystal planes, respectively. In Fig. 2a, three sharp diffraction peaks at 28.5° (111), 47.5° (220), and 56.3° (311) can be attributed to ZnS (PDF#99-0097) with no other diffraction peaks observed after vulcanization, indicating the product is pure ZnS. As the Cd2+ ions continuously exchanged with Zn2+, the intensities of these three diffraction peaks in Zn0.6Cd0.4S gradually weaken, while the appearance of three new diffraction peaks at 26.507° (002), 47.839° (103), and 51.824° (112) can be attributed to CdS (PDF#41-1049). This also indicates the successful synthesis of Zn1−xCdxS solid solution through Cd2+ and Zn2+ exchange, rather than simple physical mixing. The slight shift of the 28.5° (111) diffraction peak can be attributed to lattice distortion caused by the incorporation of Cd2+ into the ZnS lattice. Further, PdS QDs were loaded onto the surface of Zn0.6Cd0.4S, and their X-ray diffraction was almost unaffected by the amount of PdS QDs loaded (Fig. S3†), indicating that the PdS QDs loading did not alter the phase structure of Zn0.6Cd0.4S.
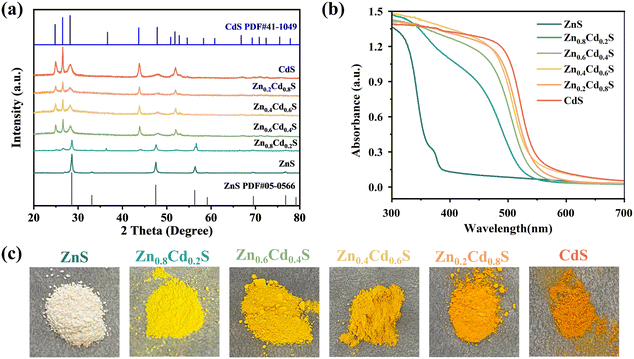 | ||
| Fig. 2 (a) XRD patterns (b) UV–vis DRS absorption plots of Zn1−xCdxS solid solution samples. (c) Digital photographs of Zn1−xCdxS solid solution samples. | ||
The response of Zn1−xCdxS to light of different wavelengths was detected by UV-vis-DRS spectroscopy. In Fig. 2b, except for ZnS which shows the strongest light response near 300 nm, all other samples exhibit the strongest light response at around 500 nm, and the absorption band shifted towards the infrared region with the increase of Cd2+ ions. From Fig. 2c, it is clearly observed that the color transformation of Zn1−xCdxS samples from white to orange as the content of Cd2+ increased, which confirmed that the introduction of Cd2+ in the solid solution structure enhanced the photonic response to visible light.
Besides, X-ray photoelectron spectroscopy (XPS) was applied to investigate the chemical states and elemental chemical composition of these samples further. From Fig. 3a, it's easily to be seen that the full scan spectrum of 0.5 wt% PdS QDs/Zn0.6Cd0.4S had contained the characteristic peaks of Zn, Cd and S elements. The Zn 3d spectra of ZnS (Fig. 3b) exhibit two peaks at 1046.37 and 1023.43 eV, corresponding to Zn 2p1/2 and Zn 2p3/2 respectively.36 Cd 3d spectra of CdS (Fig. 3c) showed two peaks with binding energy at 405.15 and 411.87 eV, which attributed to Cd 3d3/2 and Cd 3d5/2 individually.37 And S 2p spectra (Fig. 3d) can be fitted to two peaks whose binding energy is 162.52 and 161.34 eV, which corresponded to S 2p1/2 and S 2p3/2.38 It's obviously that the bind energy of Cd 3d3/2 and Cd 3d5/2 of Zn0.6Cd0.4S solid solution shifted to higher binding energy. Similarly, the binding energy of Zn 3d5/2 and Zn 3d3/2 still shifted towards higher. These changes of binding energy meant that electron transfer from S to Zn and Cd sites due to the solid solution formed. After the Zn0.6Cd0.4S was loaded by PdS QDs, the spectra of element Pd was detected (Fig. 3e) which identified the presence of PdS. Two peaks of Pd are situated at 341.93 and 336.66 eV, which corresponded to Pd 2p3/2 and Pd 2p1/2, respectively.39 The Cd characteristic peaks shifted towards higher binding energy while other elements’ characteristic peaks showed a very slightly changes, which indicated that PdS was successfully loaded and modified the electron structure of Zn0.6Cd0.4S.
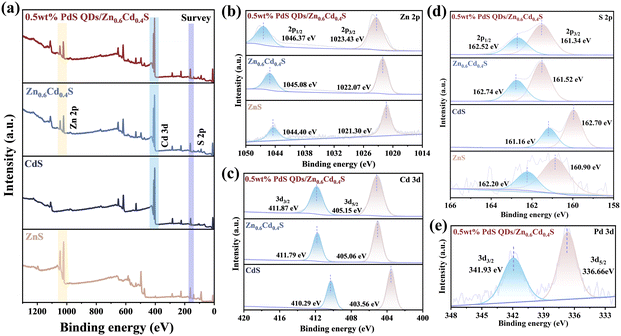 | ||
| Fig. 3 XPS spectra of (a) full spectrum, (b) Zn 2p, (c) Cd 3d, (d) S 2p and (e) Pd 3d in ZnS, CdS, Zn0.6Cd0.4S and 0.5 wt% PdS QDs/Zn0.6Cd0.4S (these details of binding energy are shown in Table S2†). | ||
2.2 Photocatalytic performance
These samples were subjected to PHE performance test under visible light (420 nm < λ < 800 nm) irradiation with lactic acid as the sacrificial agent. Fig. 4a showed that hollow ZnS nanoparticles exhibited the worst PHE activity, which is due to the wider band gap of ZnS and the difficulty of electron–hole separation. For Zn0.8Cd0.2S and Zn0.6Cd0.4S solid solutions, the PHE performance is improved because the band gap was reduced and the electron–hole separation efficiency was improved. Zn0.6Cd0.4S has the highest PHE performance, and the hydrogen evolution rate is 4.38 mmol g−1 h−1. With the increase of CdS content, the PHE performance of Zn1−xCdxS solid solution decrease, because the band gap width of the solid solution decreased gradually, and the electron hole tended to recombine after photoexcited separation. Subsequently, PdS QDs were loaded on the surface of Zn0.6Cd0.4S solid solution, which further enhanced the photocatalytic activity of Zn0.6Cd0.4S. As shown in Fig. 4b. The sample with 0.5 wt% PdS QDs loading has the highest activity, and the hydrogen evolution rate reached 27.63 mmol g−1 h−1. The obvious reason for the significant increase of PHE activity is that PdS QDs increased the electron hole transport rate and hindered the photoetching. With the increase of PdS QDs loading, the hydrogen evolution rate began to decrease, which was mainly due to the excessive loading of PdS QDs covering the active sites of proton reduction, resulting in the decrease of the oxidation reaction rate and the hydrogen evolution rate. The hydrogen evolution rate of 0.5 wt% PdS QDs/Zn0.6Cd0.4S is 6 times of that of Zn0.6Cd0.4S without loading and 963 times of that of pure ZnS, which proved the effectiveness of the band gap control and quantum dot loading photocatalyst strategy. Furthermore, we compared the hydrogen evolution performance of 0.5 wt% PdS QDs/Zn0.6Cd0.4S with other sulfide based photocatalysts and found it to be at an advanced level (as shown in Fig. 4c and Table S3†).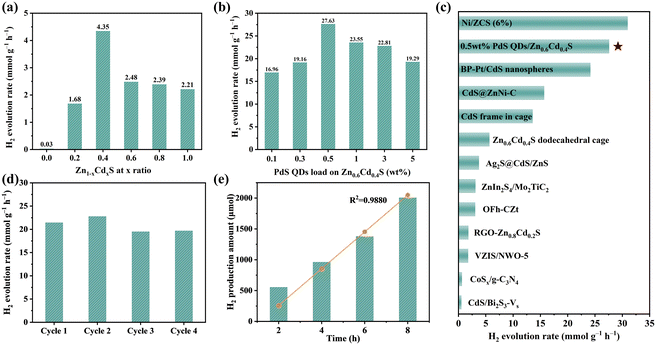 | ||
| Fig. 4 H2 evolution for the samples (a) with different ratios of Zn1−xCdxS and (b) different PdS QDs ratios loading on Zn0.6Cd0.4S. (c) Comparison of different sulfides of H2 evolution rate by photocatalysis (see ESI Table S3† for details). (d) Photocatalytic stability of the 0.5 wt% PdS QDs/Zn0.6Cd0.4S sample for H2 evolution. (e) Generation of H2 photocatalyzed by 0.5 wt% PdS QDs/Zn0.6Cd0.4S as a function of reaction time (The yellow line represents the univariate linear regression results of hydrogen production at different reaction times for comparation of authentic results). | ||
The cyclic stability test of 0.5 wt% PdS QDs/Zn0.6Cd0.4S catalyst proved that the catalyst had good reusability while maintaining the original PHE performance. As shown in Fig. 4d, under the same PHE test conditions as the above samples, the hydrogen evolution rate of the four cycles test was maintained at about 22 mmol g−1 h−1, showing a slight decrease, which is mainly due to the consumption of lactic acid sacrificial agent during the reaction process, the concentration decreases, and the oxidation end reaction rate decreases. The XPS spectrum (Fig. S4†) of the photocatalyst collected after 4 cycles of testing did not change in chemical state significantly, indicating that the photocatalytic stability was good. Finally, we conducted reaction kinetics tests on 0.5 wt% PdS QDs/Zn0.6Cd0.4S, and Fig. 4e showed that the hydrogen production showed a linear relationship over a period of up to 8 hours, and univariate linear regression analysis was performed to fit the actual hydrogen gas production. It was observed that the fitted values closely approximated the actual values, with a coefficient of determination (R2) of 0.9880, confirming that the catalyst can be applied to long-term photocatalytic processes.
2.3 Photocatalytic mechanism
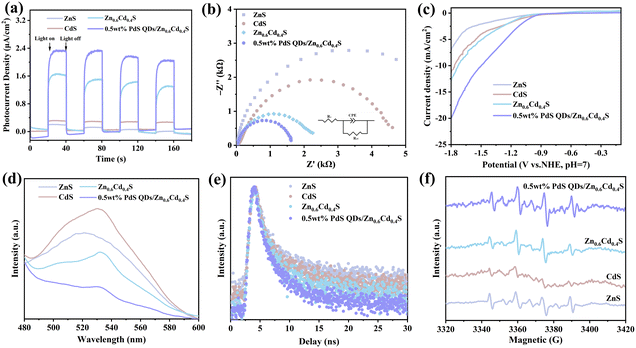
The optical and electrochemical properties of the samples were characterized to further confirm the influence of Zn1−xCdxS solid solution and PdS QDs cocatalyst on the separation and transfer of photogenerated carriers in PdS QDs/Zn1−xCdxS. The interfacial charge transfer behavior was studied by electrochemical characterization. Fig. 5a indicated that the photocurrent density of all four samples experiences a sharp increase and decrease under periodic visible light irradiation conditions, highlighting that these catalysts possess stable photo-induced carrier separation characteristics. As expected, Zn0.6Cd0.4S exhibited improved photoresponse after bandgap tuning, while 0.5 wt% PdS QDs/Zn0.6Cd0.4S can be attributed to the higher photocurrent density achieved by PdS QDs loading on Zn0.6Cd0.4S, which captured more photons and accelerates charge transfer. Furthermore, EIS measurements were conducted to observe the interface carrier transfer behavior and efficiency. As presented in Fig. 5b, the size relationship of the arc radius of the EIS Nyquist curve of the sample followed this order: ZnS > CdS > Zn0.6Cd0.4S > 0.5 wt% PdS QDs/Zn0.6Cd0.4S (the value of Rct was displayed in Table S4†). This indicated that the formation of a solid solution of 0.5 wt% PdS QDs/Zn0.6Cd0.4S in ZnS and CdS altered the electron transfer channel, and the modification of PdS QDs significantly reduced the charge transfer resistance. The electron transfer ability of the four samples was evaluated through linear scanning voltammetry (LSV) (Fig. 5c). Zn0.6Cd0.4S required far less overpotential than ZnS and CdS to achieve the same current density. This indicated that the construction of the Zn1−xCdxS solid solution enhances the charge transfer rate of the photocatalyst and promotes the transfer of holes and photogenerated electrons as compared to pure monobasic sulfide. Additionally, we observed that the overpotential required for 0.5 wt% PdS QDs/Zn0.6Cd0.4S was smaller, suggesting that PdS quantum dots as co-catalysts can effectively open up the charge transfer channel and achieve high PHE activity.In the PL spectrum (Fig. 5d), the photocatalysts exhibited strong PL signals around 535 nm under the excitation of 380 nm UV light. Among them, ZnS showed the strongest PL signal, indicating that ZnS had the highest rate of photoinduced electron–hole recombination. However, in Zn0.6Cd0.4S and 0.5 wt% PdS QDs/Zn0.6Cd0.4S, the PL signals decrease, suggesting that bandgap tuning and the introduction of co-catalysts improved the efficiency of charge separation and transfer. To better analyze the electron transfer kinetics quantitatively, we conducted time-resolved photoluminescence (TRPL) characterization for better comparison, as shown in Fig. 5e. The average PL lifetime (τavg) of ZnS was the maximum at 29.01 ns, while Zn0.6Cd0.4S and 0.5 wt% PdS QDs/Zn0.6Cd0.4S reached lower values of 17.00 ns and 14.04 ns, respectively, indicating that bandgap tuning and the introduction of co-catalysts facilitate the transport of electron–hole pairs.40 This conclusion was consistent with the PL results.
In order to investigate the photocatalytic hydrogen evolution process of PdS QDs/Zn1−xCdxS, the electron spin resonance (ESR) technique was used with DMPO as a radical scavenger to detect reaction intermediates. In Fig. 5f, after 5 minutes of visible light irradiation, the signal of •OH was detected in all samples of DMPO–water solution.41 It is worth noting that both Zn0.6Cd0.4S and 0.5 wt% PdS QDs/Zn0.6Cd0.4S generated significant •OH signals, indicating that they can produce photo-generated holes capable of oxidizing •OH.
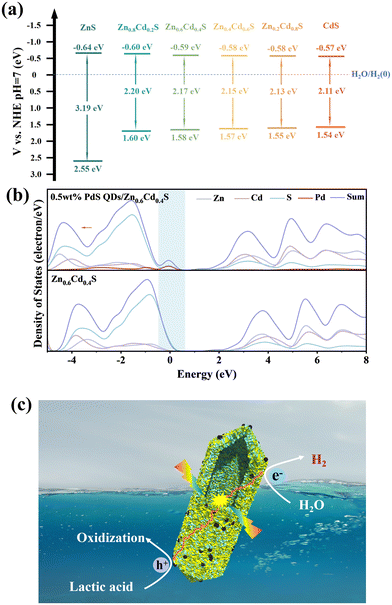
According to the Kubelka–Munk (KM) equation,42 the band gap energy of Zn1−xCdxS was calculated (Fig. S5a and 5b†), and it was found that the band gap energy of Zn1−xCdxS gradually decreased with the increase of Cd2+ ions and affected fractionally by decorating PdS QDs (Fig. S5c†). To further characterize the band structure of Zn1−xCdxS, the valence band (VB) spectra of Zn1−xCdxS obtained from XPS were used to calculate the VB position (Fig. S5d†), and it was observed that the valence band of Zn1−xCdxS became more negative with the increase of Cd2+ ions, approaching that of pure CdS. Based on the equation: EVB = ECB + Eg,43 the conduction band energy of Zn1−xCdxS was obtained and these energies were summarized in Fig. 6a, revealing a transition in the band structure of Zn1−xCdxS from ZnS-type to CdS-type. The band structure data of 0.5 wt% PdS QDs/Zn0.6Cd0.4S were also measured (Fig. S5e†), and compared with Zn0.6Cd0.4S, it can be concluded that the presence of a small amount of PdS QDs did not significantly affect the band structure of Zn0.6Cd0.4S.
In order to analyze the influence of PdS modification on the band structure of Zn0.6Cd0.4S in more depth, density functional theory (DFT) calculations were used to analyze the density of states (DOS) and partial density of states (PDOS) of 0.5 wt% PdS QDs/Zn0.6Cd0.4S and Zn0.6Cd0.4S. In Fig. 6b, it can be clearly observed that there was a band gap between the energy levels of the two samples, and the electron density of states at the Fermi level was positive, indicating that both samples exhibited semiconductor properties. From 0.5 wt% PdS QDs/Zn0.6Cd0.4S, a small peak appears at 0 eV, which is mainly contributed by the Pd orbitals, which introduced an occupied state above the valence band of Zn0.6Cd0.4S with an additional contribution from S orbitals,44 indicating that the introduction of PdS is conducive to the generation of more electrons. After PdS modification, the overall curve shifted to the left, which was beneficial for enhancing the reduction potential and thus enhancing the hydrogen evolution capability. As a result, a strong internal electric field will be formed between the PdS and the Zn1−xCdxS solid solution, which can enhance the dynamic transfer ability of photogenerated electron and hole pairs. Therefore, the PdS acted as a hole scavenger to facilitate the transfer of holes to the surface of PdS, thereby enhancing the oxidation rate of lactic acid in photocatalysis. On the other hand, this accelerates the migration of photo-generated electrons to the surface of Zn0.6Cd0.4S, resulting in an increased hydrogen evolution rate (Fig. 6c).
3. Conclusions
In summary, a PdS QDs/Zn1−xCdxS solid solution photocatalyst had been constructed by combining ion exchange and in situ sulfidation methods. This structure had been proven to be an intermediate phase in the transformation from ZnS to CdS, and it possessed an optimal band structure for efficient electron–hole pair separation and suppression of recombination. A series of catalysts which had different ratio of Zn/Cd and amount of PdS QDs were tested for photocatalytic hydrogen evolution, and the results showed that 0.5 wt% PdS QDs/Zn0.6Cd0.4S exhibited the best photocatalytic hydrogen evolution performance, which was 6 times higher than Zn0.6Cd0.4S and 963 times higher than ZnS. Through a series of optical and electrochemical characterizations, it was demonstrated that the formation of the Zn0.6Cd0.4S solid solution effectively enhanced the separation of photogenerated charge carrier. PdS QDs acted as a co-catalyst with an internal electric field that facilitated the migration of photogenerated holes from Zn0.6Cd0.4S to PdS QDs and accelerated electron transfer rate and hydrogen evolution rate. The synthetic route provided a theoretical basis for the further development of solid solution materials with hollow structures as photocatalysts and sulfur-based co-catalyst modifications.Author contributions
Cheng Guo: conceptualization, data curation, formal analysis, methodology, investigation, writing – original draft. Zongyi Huang: conceptualization, data curation, formal analysis, methodology, investigation, writing – original draft. Xinrui Long: visualization. Yuchen Sun: investigation. Pengfei Ma: investigation. Quanxing Zheng: methodology. Hongliang Lu: methodology. Xiaodong Yi: project administration, funding acquisition, supervision. Zhou Chen: project administration, funding acquisition, writing – review & editing, conceptualization, supervision.Conflicts of interest
The authors declare no competing financial interests.Acknowledgements
This work was supported by the National Key R&D Program of China (No. 2022YFB1903200), the National Natural Science Foundation of China (No. 22102136, 22372137, 22072057, 22227802, 22172126 and U23A2087), the Key Research and Development Program of Guangxi (GUIKE AB23026116), the Fundamental Research Funds for the Central Universities (No. 20720220105, 20720232005), and the XMU Training Program of Innovation and Enterpreneurship for Undergraduates (2022Y1132, 202310384027, 202310384029).References
- D. Shindell and C. J. Smith, Nature, 2019, 573, 408–411 CrossRef CAS PubMed.
- D. Chen, T. Li, Q. Chen, J. Gao, B. Fan, J. Li, X. Li, R. Zhang, J. Sun and L. Gao, Nanoscale, 2012, 4, 5431–5439 RSC.
- F. Zhao, Y. L. Law, N. Zhang, X. Wang, W. Wu, Z. Luo and Y. Wang, Small, 2023, 19, 2208266 CrossRef CAS PubMed.
- Y. Guo, J. Sun, Y. Tang, X. Jia, Y. Nie, Z. Geng, C. Wang, J. Zhang, X. Tan, D. Zhong, J. Ye and T. Yu, Energy Environ. Sci., 2023, 16, 3462–3473 RSC.
- X. Zhou, L. Peng, L. Xu, J. Luo, X. Ning, X. Zhou, F. Peng and X. Zhou, Chem. Eng. J., 2023, 474, 145967 CrossRef CAS.
- E. Borgarello, J. Kiwi, M. Graetzel, E. Pelizzetti and M. Visca, J. Am. Chem. Soc., 1982, 104, 2996–3002 CrossRef CAS.
- J. Kosco, M. Bidwell, H. Cha, T. Martin, C. T. Howells, M. Sachs, D. H. Anjum, S. Gonzalez Lopez, L. Zou, A. Wadsworth, W. Zhang, L. Zhang, J. Tellam, R. Sougrat, F. Laquai, D. M. DeLongchamp, J. R. Durrant and I. McCulloch, Nat. Mater., 2020, 19, 559–565 CrossRef CAS PubMed.
- H. Wang, J. Jiang, L. Yu, J. Peng, Z. Song, Z. Xiong, N. Li, K. Xiang, J. Zou, J.-P. Hsu and T. Zhai, Small, 2023, 19, 2301116 CrossRef CAS PubMed.
- M. K. Debe, Nature, 2012, 486, 43–51 CrossRef CAS PubMed.
- J. Szczesny, J. A. Birrell, F. Conzuelo, W. Lubitz, A. Ruff and W. Schuhmann, Angew. Chem., Int. Ed., 2020, 59, 16506–16510 CrossRef CAS PubMed.
- D. Ma, Z. Zhang, Y. Zou, J. Chen and J.-W. Shi, Coord. Chem. Rev., 2024, 500, 215489 CrossRef CAS.
- J. Yu, X. Ton, P. Su, S. Wang, D. Zhang, B. Ge and X. Pu, J. Liaocheng Univ.: Nat. Sci. Ed., 2024 DOI:10.19728/j.issn1672-6634.2023090011.
- Q. Wang and K. Domen, Chem. Rev., 2020, 120, 919–985 CrossRef CAS PubMed.
- H. Nishiyama, T. Yamada, M. Nakabayashi, Y. Maehara, M. Yamaguchi, Y. Kuromiya, Y. Nagatsuma, H. Tokudome, S. Akiyama, T. Watanabe, R. Narushima, S. Okunaka, N. Shibata, T. Takata, T. Hisatomi and K. Domen, Nature, 2021, 598, 304–307 CrossRef CAS PubMed.
- P. Zhang, D. Luan and X. W. Lou, Adv. Mater., 2020, 32, 2004561 CrossRef CAS PubMed.
- L. Xue, Y. Shi, C. Huang, Q. Wu, B. Chen and W. Yao, J. Colloid Interface Sci., 2023, 635, 72–82 CrossRef CAS PubMed.
- J. Tang, B. Gao, J. Pan, L. Chen, Z. Zhao, S. Shen, J.-K. Guo, C.-T. Au and S.-F. Yin, Appl. Catal., A, 2019, 588, 117281 CrossRef CAS.
- X. Meng, S. Wang, C. Zhang, C. Dong, R. Li, B. Li, Q. Wang and Y. Ding, ACS Catal., 2022, 12, 10115–10126 CrossRef CAS.
- S. Zhang, Z. Zhang, Y. Si, B. Li, F. Deng, L. Yang, X. Liu, W. Dai and S. Luo, ACS Nano, 2021, 15, 15238–15248 CrossRef CAS PubMed.
- X. Shi, C. Dai, X. Wang, J. Hu, J. Zhang, L. Zheng, L. Mao, H. Zheng and M. Zhu, Nat. Commun., 2022, 13, 1287 CrossRef CAS PubMed.
- C. Liu, Q. Zhang and Z. Zou, J. Mater. Sci. Technol., 2023, 139, 167–188 CrossRef CAS.
- X. Jia, Y. Lu, K. Du, H. Zheng, L. Mao, H. Li, Z. Ma, R. Wang and J. Zhang, Adv. Funct. Mater., 2023, 33, 2304072 CrossRef CAS.
- P. Su, D. Kong, H. Zhao, S. Li, D. Zhang, X. Pu, C. Su and P. Cai, J. Adv. Ceram., 2023, 12, 1685–1700 CrossRef CAS.
- W. Feng, J. Yuan, L. Zhang, W. Hu, Z. Wu, X. Wang, X. Huang, P. Liu and S. Zhang, Appl. Catal., B, 2020, 277, 119250 CrossRef CAS.
- Y. Zhi, Y. Yi, C. Deng, Q. Zhang, S. Yang and F. Peng, ChemSusChem, 2022, 15, e202200860 CrossRef CAS PubMed.
- Q. Zhu, Z. Xu, Q. Yi, M. Nasir, M. Xing, B. Qiu and J. Zhang, Mater. Chem. Front., 2020, 4, 3234–3239 RSC.
- E. Ha, S. Ruan, D. Li, Y. Zhu, Y. Chen, J. Qiu, Z. Chen, T. Xu, J. Su, L. Wang and J. Hu, Nano Res., 2022, 15, 996–1002 CrossRef CAS.
- W. Xue, X. Bai, J. Tian, X. Ma, X. Hu, J. Fan and E. Liu, Chem. Eng. J., 2022, 428, 132608 CrossRef CAS.
- H. Yang, J. Tang, Y. Luo, X. Zhan, Z. Liang, L. Jiang, H. Hou and W. Yang, Small, 2021, 17, 2102307 CrossRef CAS.
- E. Zhang, Q. Zhu, J. Huang, J. Liu, G. Tan, C. Sun, T. Li, S. Liu, Y. Li, H. Wang, X. Wan, Z. Wen, F. Fan, J. Zhang and K. Ariga, Appl. Catal., B, 2021, 293, 120213 CrossRef CAS.
- H. Su, W. Wang, R. Shi, H. Tang, L. Sun, L. Wang, Q. Liu and T. Zhang, Carbon Energy, 2023, 5, e280 CrossRef CAS.
- Y. Yan, R. W. Crisp, J. Gu, B. D. Chernomordik, G. F. Pach, A. R. Marshall, J. A. Turner and M. C. Beard, Nat. Energy, 2017, 2, 17052 CrossRef CAS.
- D. Prusty, L. Paramanik and K. Parida, Energy Fuels, 2021, 35, 4670–4686 CrossRef CAS.
- S.-W. Cao, Y.-P. Yuan, J. Fang, M. M. Shahjamali, F. Y. C. Boey, J. Barber, S. C. Joachim Loo and C. Xue, Int. J. Hydrogen Energy, 2013, 38, 1258–1266 CrossRef CAS.
- S. Mao, J.-W. Shi, G. Sun, Y. Zhang, D. Ma, K. Song, Y. Lv, J. Zhou, H. Wang and Y. Cheng, ACS Appl. Mater. Interfaces, 2022, 14, 48770–48779 CrossRef CAS.
- Y. Zhang, Y. Wu, L. Wan, H. Ding, H. Li, X. Wang and W. Zhang, Appl. Catal., B, 2022, 311, 121255 CrossRef CAS.
- Z. Xu, W. Yue, C. Li, L. Wang, Y. Xu, Z. Ye and J. Zhang, ACS Nano, 2023, 17, 11655–11664 CrossRef CAS PubMed.
- X. Guo, X. Liu, J. Yan and S. F. Liu, Chem. – Eur. J., 2022, 28, e202202662 CrossRef CAS PubMed.
- Y. Akinaga, T. Kawawaki, H. Kameko, Y. Yamazaki, K. Yamazaki, Y. Nakayasu, K. Kato, Y. Tanaka, A. T. Hanindriyo, M. Takagi, T. Shimazaki, M. Tachikawa, A. Yamakata and Y. Negishi, Adv. Funct. Mater., 2023, 33, 2303321 CrossRef CAS.
- Z. Huang, Q. Zhang, X. Ma, B. Chen, T. Fan, Z. Zhang, S. Zhang, Y. Dong, J. Li, Z. Chen and X. Yi, Mater. Today Chem., 2023, 29, 101475 CrossRef CAS.
- Y. Yang, Z. Xing, W. Kong, C. Wu, H. Peng, Z. Li and W. Zhou, Nanoscale, 2022, 14, 14741–14749 RSC.
- J. Huang, Z. Huang, S. Xu, F. Tingting, X. Yi and Z. Chen, Energy Technol., 2022, 10, 2200362 CrossRef CAS.
- M. Yang, Y. Li, T. Yan and Z. Jin, Nanoscale, 2021, 13, 13858–13872 RSC.
- H. Pang, X. Meng, H. Song, W. Zhou, G. Yang, H. Zhang, Y. Izumi, T. Takei, W. Jewasuwan, N. Fukata and J. Ye, Appl. Catal., B, 2019, 244, 1013–1020 CrossRef CAS.
Footnotes |
| † Electronic supplementary information (ESI) available. See DOI: https://doi.org/10.1039/d3nr05518c |
| ‡ These authors are contributed equally to this work. |
| This journal is © The Royal Society of Chemistry 2024 |


