 Open Access Article
Creative Commons Attribution 3.0 Unported Licence
Fully printed minimum port flexible interdigital electrode sensor arrays†
Yanyue
Teng‡
a,
Xin
Wang‡
b,
Zhidong
Zhang‡
 c,
Shixuan
Mei
b,
Xueli
Nan
*b,
Yunlong
Zhao
d,
Xikuan
Zhang
c,
Chenyang
Xue
c,
Shixuan
Mei
b,
Xueli
Nan
*b,
Yunlong
Zhao
d,
Xikuan
Zhang
c,
Chenyang
Xue
 d,
Libo
Gao
 *d and
Junyang
Li
*a
aSchool of Electronic Engineering, Ocean University of China, Qingdao 266000, China. E-mail: lijunyang@ouc.edu.cn
bSchool of Automation and Software Engineering, Shanxi University, Taiyuan 030006, China. E-mail: nanxueli@sxu.edu.cn
cState Key Laboratory, of Dynamic Measurement Technology, School of Instrument and Electronics, North University of China, Taiyuan, 030051, China
dPen-Tung Sah Institute of Micro-Nano Science and Technology, Xiamen University, Xiamen, 361102, China. E-mail: lbgao@xmu.edu.cn
First published on 13th March 2024
Abstract
Screen-printed interdigital electrode-based flexible pressure sensor arrays play a crucial role in human–computer interaction and health monitoring due to their simplicity of fabrication. However, the long-standing challenge of how to reduce the number of electrical output ports of interdigital electrodes to facilitate integration with back-end circuits is still commonly ignored. Here, we propose a screen-printing strategy to avoid wire cross-planes for rapid fabrication of flexible pressure sensor arrays. By innovatively introducing an insulating ink to realize electrical insulation and three-dimensional interconnection of wire crossings, the improved sensor array (4 × 4) successfully reduces the number of output ports from 17 to 8. In addition, we further constructed microstructures on the laser-etched electrode surfaces and the sensitive layer, which enabled the sensor to achieve a sensitivity as high as 17![[thin space (1/6-em)]](https://www.rsc.org/images/entities/char_2009.gif) 567.5 kPa−1 in the range of 0–50 kPa. Moreover, we integrated the sensors with back-end circuits for the precise detection of tactile and physiological information. This provides a reliable method for preparing high-performance flexible sensor arrays and large-scale integration of microsensors.
567.5 kPa−1 in the range of 0–50 kPa. Moreover, we integrated the sensors with back-end circuits for the precise detection of tactile and physiological information. This provides a reliable method for preparing high-performance flexible sensor arrays and large-scale integration of microsensors.
Introduction
The rapid development of flexible pressure sensors has led to a wide range of applications in fields such as electronic skin,1–4 human–computer interaction,5–9 and health monitoring.10–14 Among various sensor designs, flexible sensors based on interdigital electrodes are a classic class that has attracted much attention.15–17 However, flexible sensing arrays based on interdigital electrodes have always suffered from the problem of too many ports for electrical output.18–22 An n × m (n representing the number of transverse sensors and m representing the number of longitudinal sensors) interdigital electrode sensor array typically requires (1 + n × m) output ports, which limits sensor integration and application due to the large number of ports. The through-hole technology of FPCBs solves this challenge by simplifying the number of ports to (n + m).23 However, the severe lack of stretchability of FPCBs hinders their application on irregular surfaces.It is worth noting that the core of the through-hole process lies in the transition of wires to another layer at the intersection point, utilizing interlayer insulation to achieve three-dimensional interconnections at the electrical insulation and wire intersections. Among a large number of studies, a printing method based on complex conductive elastomers has been reported, which employs a bridged flexible connection at the wire intersection to achieve electrical insulation at the intersection through an air medium.24 However, this connection is prone to deformation under mechanical stress and is not suitable for stress sensing at irregular interfaces. In addition, this processing method involves complex materials that are difficult to mass produce and extremely costly, making it challenging to achieve rapid mass production. In widespread production, more researchers are opting for FPCB solutions that sacrifice flexibility, or abandoning interdigital electrode sensors in favor of “sandwich” sensors, making soft, large-area interdigital electrode pressure sensor arrays a major blind spot in research. For example, Yogeenth Kumaresan25et al. introduced a multifunctional electronic skin with an array of pressure and temperature sensors. The pressure sensors were fabricated using a “sandwich” structure. Liu26et al. proposed a multi-channel flexible pulse sensing array pressure sensor based on a polyimide/multi-walled carbon nanotube–polydimethylsiloxane nanocomposite/polyimide (PI/MPN/PI) “sandwich” structure. Therefore, it is imperative to explore a generalized production strategy to achieve the minimum port output for the planar distribution of sensors.
Here, we propose a printing strategy that avoids wire crossover and realizes rapid production. Based on the precise deposition of ink using the screen-printing technique combined with an insulating ink, we print at the intersection of the sensor “row lead wires” and “column lead wires” to shield the electrical connections while ensuring mechanical stability (Fig. 1a), thus realizing the minimum output ports for the sensor array. Based on this, we fabricated a fully printed 4 × 4 minimum output port pressure sensor array on a flexible TPU film. In addition, we further improved the sensing performance of the sensor by modifying the sensitive and electrode layer substrates through laser engraving. The sensor achieves a maximum sensitivity of 17![[thin space (1/6-em)]](https://www.rsc.org/images/entities/char_2009.gif) 567.5 kPa−1, a wide detection range of 50 kPa, a minimum detection limit of 3.53 Pa, a response time of 22 ms, a recovery time of 37 ms, and a cycle stability of more than 10
567.5 kPa−1, a wide detection range of 50 kPa, a minimum detection limit of 3.53 Pa, a response time of 22 ms, a recovery time of 37 ms, and a cycle stability of more than 10![[thin space (1/6-em)]](https://www.rsc.org/images/entities/char_2009.gif) 000 cycles. The fabricated sensors and their arrays have shown excellent performance when applied to tactile sensing and human physiological information detection. This unique printing strategy provides inspiration for producing large-area sensor arrays.
000 cycles. The fabricated sensors and their arrays have shown excellent performance when applied to tactile sensing and human physiological information detection. This unique printing strategy provides inspiration for producing large-area sensor arrays.
Experimental
Materials and characterization
We chose a highly elastic thermoplastic polyurethane film (XJU150, Shanghai Xingxia Polymer Products Co., Ltd) as the substrate material for the sensor array. Stretchable conductive silver paste (Shanghai Ouyi Organic Optoelectronic Materials Co., Ltd) was chosen as the electrode material for the sensor array. Dry insulating ink was selected as the insulating material for the sensor array. The sensitive layer material of the sensor array was a mixture of thermoplastic polyurethane (TPU, Dongguan Zhangmutou Ruixiang Polymer Material Operation Department) and carbon nanotubes (CNT, Suzhou Carbon Peak Graphene Technology Co., Ltd). The spacer layer material of the sensor was TPU transparent ink (Longhua Wangli Screen Printing Equipment Store, Longhua New District, Shenzhen, China). In addition, the organic solvent used was DMF (N,N-dimethylformamide, Aladdin Company).We tested the mechanical and electrical properties of the sensors using a digital instrument LCR (TH2840B, Tonghui) and a mechanical testing machine (ZQ-990B, Zhiqiu). The silver electrode, sensitive layer and sensor structure were observed using a scanning electron microscope (Carl Zeiss, G300). The sensor structure was characterized in three dimensions using a laser confocal microscope (Olympus, OLS5000). The TPU layer and the sensitive layer were laser cut using a UV laser cutter with the following parameters: power: 4.15 W, scanning speed: 1000 mm s−1, laser wavelength: 355 nm, continuous wave, frequency: 60 kHz, pulse width: 10 μs, number of processing iterations for the sensitive layer: 20 times, and number of processing iterations for the TPU substrate: 10 times.
Design and composition
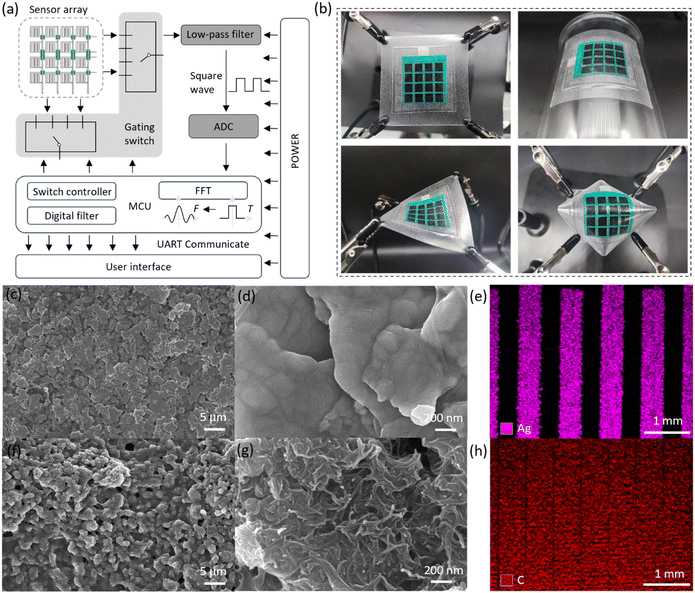
Fig. 1a shows the fully printed minimum output port interdigital electrode sensor array. First, an interdigital electrode sensor array consisting of “column connections” and “row leads” is constructed on a flexible TPU film. Then, after printing ink in the area where the wires cross, printed wires connect the “row leads” to construct the electrode layer of the sensor array. Finally, an insulating layer, a spacer layer, and a sensitive layer are introduced to complete the fabrication of the fully printed flexible interdigital electrode sensor array with row and column crossings. Fig. S1† verifies the insulation stability under pressure of the sensor array using insulating ink. In addition, an arch-shaped structure is constructed in the sensor unit, and the microstructures of the sensitive layer and the TPU layer are perpendicular to the interdigital electrode to enhance the mechanical and electrical performance of the sensor. Fig. 1a depicts the detection circuit of a minimum output port interdigital electrode sensor, where the sensor cells are selected by rows and columns, the signal is filtered by a low-pass filter to remove noise, and then an analog-to-digital conversion (ADC) is performed. The signal is then fed to a control unit (MCU) for digital filtering and Fast Fourier Transform (FFT) signal processing. Finally, the signals are transmitted to the user interface via serial communications. Fig. 1b shows the excellent flexibility of the sensor array, which can be easily stretched, bent, twisted and arched, which is crucial for inspection on irregular surfaces. In addition, we have observed the morphology of the electrode layer at 5 μm scale (Fig. 1c) and 200 nm scale (Fig. 1d) by scanning electron microscopy and identified the main elements by EDS (Fig. 1e). And the microstructure of the sensitive layer was successfully explored (Fig. 1f–h). Additional microstructures and elemental compositions are shown in Fig. S2–S5.†Preparation of the sensor array
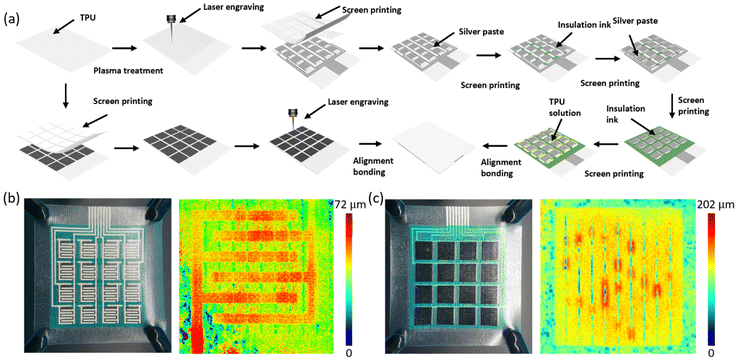
The sensor array is divided from top to bottom into an upper substrate layer, a sensitive layer, a spacer layer, an insulating layer, an electrode layer, and a lower substrate layer. The fabrication process is shown in Fig. 2a. Specifically, 2 g of TPU particles were dissolved in 5 ml of DMF and stirred at 80 °C and 1000 rpm for 2 hours. Carbon nanotube powder was then added and stirred for another 2 hours. The mixture was then sonicated at 80 °C for 20 minutes to prepare the sensitive layer ink. The upper substrate layer consisted of a thermoplastic polyurethane film, which was treated with a plasma cleaner, patterned with a thermoplastic polyurethane/carbon nanotube ink by screen-printing, and then modified with a laser to obtain the sensitive layer of the sensor. To construct the electrode layer on the lower substrate layer, the lower substrate layer was first laser-modified and then screen-printed with silver ink to produce a “column-connected” interdigital electrode sensor array. Next, the electrode layer and the lower substrate layer of the sensor array were successfully fabricated by printing insulating ink in the wire crossing region and then screen-printing silver ink to prepare the “row connection” wires of the sensor. Insulating ink and TPU ink were screen-printed on one end of the electrode layer to construct the insulating and spacer layers. The electrode layer, the insulating layer, the spacer layer and the sensitive layer were aligned and bonded, and the fully screen-printed flexible interdigital electrode sensor array was successfully fabricated.The fabricated sensor arrays are shown in Fig. 2b and c, and a clear microstructure can be observed from the optical photographs. The laser modification traces on the electrode layer substrate and the sensitive layer are clearly visible in the laser confocal microscopy images.
Results and discussion
Performance of the sensor
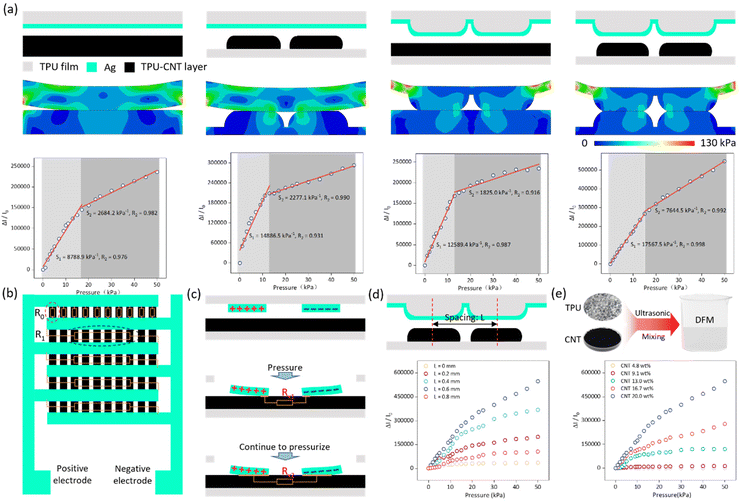
The performance of a sensor unit determines its ability to detect a signal, which is critical for sensor arrays. The performance of the sensor is affected by a variety of factors, including mechanical stress (Fig. S6†), humidity (Fig. S7†), temperature (Fig. S8†), manufacturing process, structural design and material selection ratio, among which, the structure and material selection ratios of the sensor are among the most crucial factors.27–29 In terms of sensor structure, laser engraving to change the microstructure of the film is one way to improve the performance of the sensor. In an interdigital electrode sensor, there are two layers of film: the electrode film and the sensitive layer film. In this study, laser engraving was utilized to control the variable modification of the electrode film substrate and the sensitive layer film. The results (shown in Fig. 3a) indicate that the sensor with both the electrode film substrate and the sensitive layer film modified exhibited the best performance among four conditions: no laser modification, laser modified sensitive layer but unmodified electrode substrate, laser modified electrode substrate but unmodified sensitive layer, and laser modified electrode substrate and sensitive layer.Finite element analysis using Abaqus was conducted to analyze the mechanical structure of the sensor under pressure, demonstrating excellent mechanical performance. Additionally, the sensor exhibits extremely high sensitivity in the range of 0–50 kPa, up to 17![[thin space (1/6-em)]](https://www.rsc.org/images/entities/char_2009.gif) 567.5 kPa−1.
567.5 kPa−1.
Fig. 3b depicts the overall structure of the interdigital electrode sensor. Assuming that the sensitive layer has a uniform resistance and ignoring the piezoresistive effect of the narrow edges of the interdigital electrodes, the total resistance R of the sensor can be approximated as a parallel combination of five R1s, where R1 is a parallel combination of ten R0s. According to the parallel resistance equation, R = R0/50. For a single R0, a magnified diagram is shown in Fig. 3c. As the pressure increases, the contact area between the sensor electrodes and the sensitive layer increases, resulting in more conductive paths and a decrease in resistance. In the case where both films are laser-modified, the spacing between the arch structures created by the laser modification is an uncertainty. We explored the optimal spacing L of the laser-cut arch structures and found that the sensor exhibited the best performance when L = 0.6 mm (Fig. 3d). Material ratios are critical to sensor performance. We explored the optimal material ratio and found that the sensor performed best when the CNT content was 20 wt% (Fig. 3e), because CNT content above 20 wt% could not be fully dissolved in the TPU/DMF solution.
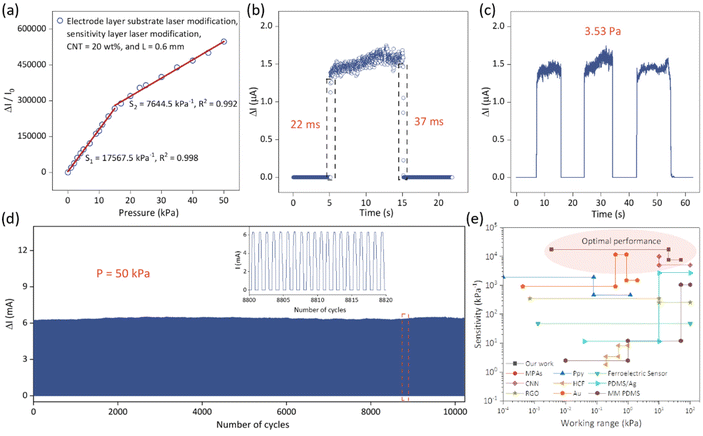
The resulting sensor has excellent mechanical and electrical properties. Fig. 4a shows the sensitivity error curve of the sensor. In order to create the performance error curve, we evaluated the sensitivity data of the same sensor unit numerous times and determined the maximum and minimum values at each pressure position between 0 and 50 kPa. The good performance repeatability of the sensing unit is demonstrated in Fig. 4a. As shown in Fig. 4b, the sensor has an ultra-fast response time (22 ms) and relaxation time (37 ms), allowing it to detect and respond quickly to pressure changes. The sensor also has an ultra-low detection limit, continuously capturing pressures as low as 3.53 Pa (Fig. 4c), demonstrating its ability to detect low pressures. At 50 kPa, the sensor underwent more than 10![[thin space (1/6-em)]](https://www.rsc.org/images/entities/char_2009.gif) 000 consecutive load/unload cycles (Fig. 4d), and no significant change in output was observed during the test, demonstrating excellent cyclic stability. Fig. 4e illustrates the unique advantages of our fabricated sensor compared to other pressure-sensitive material sensors, including: MPA,30 Ppy,31 RGO/PVDF,32 CNN,33 HCF,34 PDMS/Ag,35 RGO,36 Au,37 and MM PDMS.38 This further demonstrates the outstanding performance of our sensor and its significant contributions in terms of material composition and structural design.
000 consecutive load/unload cycles (Fig. 4d), and no significant change in output was observed during the test, demonstrating excellent cyclic stability. Fig. 4e illustrates the unique advantages of our fabricated sensor compared to other pressure-sensitive material sensors, including: MPA,30 Ppy,31 RGO/PVDF,32 CNN,33 HCF,34 PDMS/Ag,35 RGO,36 Au,37 and MM PDMS.38 This further demonstrates the outstanding performance of our sensor and its significant contributions in terms of material composition and structural design.
Application of the sensor
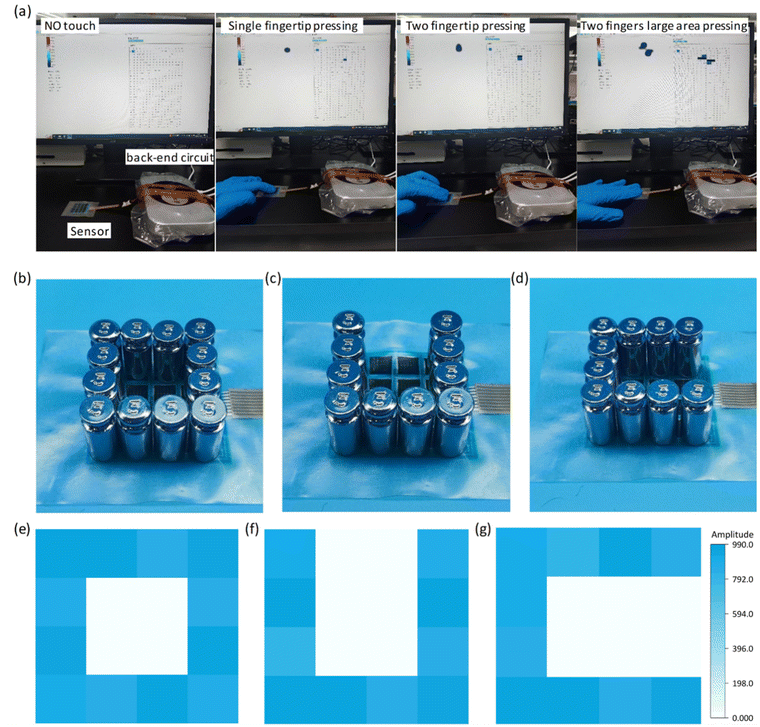
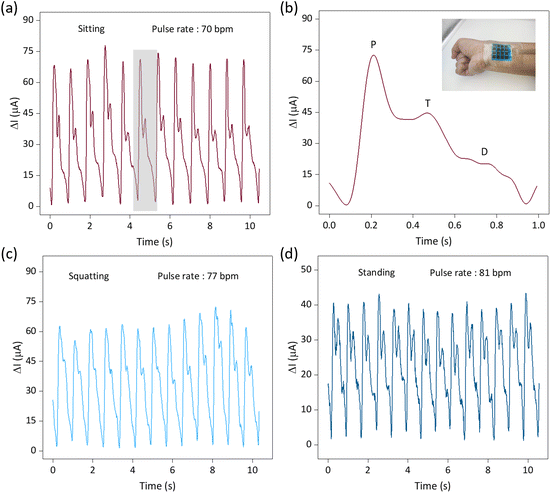
Depositing insulating inks to avoid wire crossings is one of the core elements of this paper and is a critical step in the fast, scalable and cost-effective construction of interdigital electrode sensor arrays with minimal output ports. Utilizing advanced fabrication techniques and the excellent performance of the sensors, we constructed a 4 × 4 flexible row–column intersecting interdigital electrode sensor array and used it as a tactile display for 3D spatial pressure mapping. The fabrication of the 4 × 4 sensor array demonstrated its ability to produce a large-area array, and the detection of the sensor units was achieved through row–column decoupling. A conceptual diagram of the detection circuit is shown in Fig. 1a. In Fig. 5a, we conducted a tactile display test, including no pressure, single fingertip pressure, double fingertip pressure, and double fingertip large-area pressure, and successfully detected them through the acquisition circuit. We placed weights with different patterns (“O”, “U”, and “C”) on different units of the sensor array (Fig. 5b–d), and successfully measured the corresponding pressure distributions of the sensor array (Fig. 5e–g), demonstrating its potential application as a haptic display.The soft sensors can be adapted to a variety of complex surfaces, and the laser-modified sensors are suitable for detecting human physiological information because of their high sensitivity, wide detection range, fast response/recovery, and good cyclic stability. The soft sensor realizes accurate measurement of the radial artery pulse and comprehensively detects the pulse in different postures. Pulse is an important cardiovascular parameter and one of the indicators for clinical diagnosis of cardiovascular diseases, especially pulse rate and pulse amplitude. As shown in Fig. 6a, c and d, we detected the continuous pulse of our volunteers in sitting, squatting and standing postures. It is clear that the pulse amplitude is largest in the sitting position. This is due to the smooth blood flow in the sitting posture, which is in perfect agreement with the objective perception. Clinical pulse diagnosis was also performed in the sitting posture, which is related to the hemodynamics of the heart. In the squatting and standing postures, the different beating requirements of the heart result in a relatively higher pulse rate. Given the prevalence of pulses being measured in the sitting position, we have characterized them in this position. The pulse detected by the sensor can be clearly differentiated into a pre-pulse wave – P-wave, a reflected wave – T-wave, and a bi-directional scattered wave – D-wave (Fig. 6b), and the test environment is shown in the figure. Accurate reading of pulse characteristic points is key to understanding the health status of the human body, and is important for the prevention and diagnosis of cardiovascular diseases.
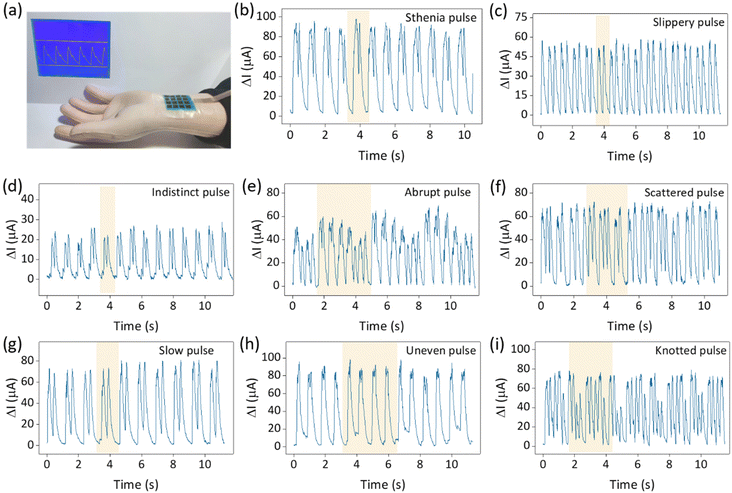
In addition, the human pulse exhibits a wealth of features that form a variety of pulse patterns corresponding to different physiological conditions.39–41 Detection and differentiation of the pulse is the key to pulse diagnosis in traditional Chinese medicine. The application of high-sensitivity sensors in pulse detection is a major advancement in the use of flexible wearable sensors to detect physiological information. We simulated 28 pulse types using a mechanical pulse arm and used sensors to differentiate between them. Fig. 7a depicts the detection environment of the mechanical pulse arm, while Fig. 7b–i show the electrical signal outputs of eight pulse patterns, including stiff pulse, sliding pulse, fuzzy pulse, sudden pulse, scattered pulse, slow pulse, uneven pulse, and nodular pulse. Specific pulse patterns are highlighted in the corresponding graphs. The remaining 20 pulse patterns are detailed in Fig. S9.† The sensors clearly distinguish between the different pulse patterns. In addition, the pressure distribution of a hand-held beaker and the sole of foot was tested in Fig. S10,† and the corresponding pressure distribution heat map was shown. The sensor array's multi-point monitoring capability is demonstrated by both experiments. The practical application of these sensors reaffirms their excellent performance and reflects the excellent structural design and manufacturing process.
Conclusions
In summary, we have utilized screen-printing and an insulating ink to avoid wire crossings and have constructed a 4 × 4 interdigital electrode sensor array in combination with an interdigital electrode sensor unit. By introducing insulating ink at wire crossings and adopting a well-designed structural configuration, the number of output ports of the sensors was drastically reduced from 17 to 8, and three-dimensional interconnections with electrical insulation and wire crossings were realized. Importantly, we propose a method for fabricating a sensor with double-sided laser-engraved microstructures, which results in high sensitivity up to 17![[thin space (1/6-em)]](https://www.rsc.org/images/entities/char_2009.gif) 567.5 kPa−1, detection range up to 50 kPa, response/recovery times of 22 ms and 37 ms, a minimum detection limit of 3.53 Pa, and a stability of more than 10
567.5 kPa−1, detection range up to 50 kPa, response/recovery times of 22 ms and 37 ms, a minimum detection limit of 3.53 Pa, and a stability of more than 10![[thin space (1/6-em)]](https://www.rsc.org/images/entities/char_2009.gif) 000 cycles at a pressure of 50 kPa. The integration of technologies for screen-printing, the use of soft materials, and excellent sensor performance demonstrates the strong potential for tactile sensing and pulse detection. The application of the sensor array to 3D pressure mapping with multiple distributed weights emphasizes its excellent capabilities as a tactile display. The detection of human and robotic arm pulses demonstrates its potential in the field of flexible wearable biomedical detection, especially in terms of pulse waveform differentiation, providing a clear direction for researchers in related fields. Last but not least, our proposed fabrication process is equally applicable to larger sensor arrays, thus revealing a research blind spot for printing fully flexible very few-port interdigital electrode sensors.
000 cycles at a pressure of 50 kPa. The integration of technologies for screen-printing, the use of soft materials, and excellent sensor performance demonstrates the strong potential for tactile sensing and pulse detection. The application of the sensor array to 3D pressure mapping with multiple distributed weights emphasizes its excellent capabilities as a tactile display. The detection of human and robotic arm pulses demonstrates its potential in the field of flexible wearable biomedical detection, especially in terms of pulse waveform differentiation, providing a clear direction for researchers in related fields. Last but not least, our proposed fabrication process is equally applicable to larger sensor arrays, thus revealing a research blind spot for printing fully flexible very few-port interdigital electrode sensors.
Screen-printing has the potential to deposit ultra-thin-layered materials and, when combined with flexible films, enables digital and patterned material deposition, offering the capability to fabricate super-soft, attachable sensors.
Author contributions
Yanyue Teng: investigation, formal analysis, data curation, and writing – original draft. Xin Wang: investigation, formal analysis, data curation, and writing – original draft. Zhidong Zhang: formal analysis, data curation, and writing – original draft. Shixuan Mei: investigation and data curation. Xueli Nan: conceptualization, methodology, and visualization. Yunlong Zhao: investigation and data curation. Xikuan Zhang: investigation and data curation. Chenyang Xue: investigation and performance analysis. Libo Gao: methodology and resources, conceptualization, methodology, and visualization. Junyang Li: conceptualization, methodology, visualization, and writing – review and editing. All authors read and contributed to the manuscript.Conflicts of interest
There are no conflicts to declare.Acknowledgements
This research was supported by the National Natural Science Foundation of China (No. 62274140, 62201537), the Foundation of Natural Science Foundation of Shandong Province (No. ZR2022QF008), the Fundamental Research Funds for the Central Universities (20720230030) and the Xiaomi Young Talents Program/Xiaomi Foundation.References
- G. Ye, T. Jin, X. Wang, Y. Chen, Q. Wu, Y. Wan and P. Yang, Nano Energy, 2023, 113, 108580 CrossRef CAS.
- Y. Deng, X. Guo, Y. Lin, Z. Huang and Y. Li, ACS Nano, 2023, 17, 6423–6434 CrossRef CAS PubMed.
- M. Zarei, J. Hoon Kim, J. Tark Han and S. Goo Lee, Chem. Eng. J., 2024, 479, 147849 CrossRef CAS.
- H. L. Wang, T. Chen, B. Zhang, G. Wang, X. Yang, K. Wu and Y. Wang, Small, 2023, 19, 2206830 CrossRef CAS PubMed.
- R. Han, Y. Liu, Y. Mo, H. Xu, Z. Yang, R. Bao and C. Pan, Adv. Funct. Mater., 2023, 33, 2305531 CrossRef CAS.
- S. Sharma, G. B. Pradhan, S. Jeong, S. Zhang, H. Song and J. Y. Park, ACS Nano, 2023, 17, 8355–8366 CrossRef CAS PubMed.
- M. Chao, P. Di, Y. Yuan, Y. Xu, L. Zhang and P. Wan, Nano Energy, 2023, 108, 108201 CrossRef CAS.
- N. Dai, X. Guan, C. Lu, K. Zhang, S. Xu, I. M. Lei, G. Li, Q. Zhong, P. Fang and J. Zhong, ACS Nano, 2023, 17, 24814–24825 CrossRef CAS PubMed.
- Z. Dai, K. Feng, M. Wang, M. Lei, S. Ding, J. Luo, Q. Xu and B. Zhou, Nano Energy, 2022, 97, 107173 CrossRef CAS.
- L. Han, W. Liang, Q. Xie, J. Zhao, Y. Dong, X. Wang and L. Lin, Adv. Sci., 2023, 10, 2301180 CrossRef CAS PubMed.
- J. Liu, W. Zhao, J. Li, C. Li, S. Xu, Y. Sun, Z. Ma, H. Zhao and L. Ren, Biosens. Bioelectron., 2024, 243, 115773 CrossRef CAS PubMed.
- H. Xu, W. Zheng, Y. Zhang, D. Zhao, L. Wang, Y. Zhao, W. Wang, Y. Yuan, J. Zhang, Z. Huo, Y. Wang, N. Zhao, Y. Qin, K. Liu, R. Xi, G. Chen, H. Zhang, C. Tang, J. Yan, Q. Ge, H. Cheng, Y. Lu and L. Gao, Nat. Commun., 2023, 14, 7769 CrossRef CAS PubMed.
- J. Li, H. Jia, J. Zhou, X. Huang, L. Xu, S. Jia, Z. Gao, K. Yao, D. Li, B. Zhang, Y. Liu, Y. Huang, Y. Hu, G. Zhao, Z. Xu, J. Li, C. K. Yiu, Y. Gao, M. Wu, Y. Jiao, Q. Zhang, X. Tai, R. H. Chan, Y. Zhang, X. Ma and X. Yu, Nat. Commun., 2023, 14, 5009 CrossRef CAS PubMed.
- S. Li, H. Wang, W. Ma, L. Qiu, K. Xia, Y. Zhang, H. Lu, M. Zhu, X. Liang, X.-E. Wu, H. Liang and Y. Zhang, Sci. Adv., 2023, 9, eadh0615 CrossRef PubMed.
- G. Tian, K. Xu, Y. Huang, X. You, W. Yu, H. Liu, J. Li, J. Liu, X. Jin, H. Li, Q. Ke and C. Huang, J. Mater. Chem. A, 2023, 11, 21333–21344 RSC.
- M. Yang, Y. Cheng, Y. Yue, Y. Chen, H. Gao, L. Li, B. Cai, W. Liu, Z. Wang, H. Guo, N. Liu and Y. Gao, Adv. Sci., 2022, 9, 2200507 CrossRef CAS PubMed.
- D.-L. Wen, Y.-X. Pang, P. Huang, Y.-L. Wang, X.-R. Zhang, H.-T. Deng and X.-S. Zhang, Adv. Fiber Mater., 2022, 4, 873–884 CrossRef CAS.
- Z. Wang, J. Ding and R. Guo, ACS Appl. Mater. Interfaces, 2023, 15, 4789–4798 CrossRef CAS PubMed.
- C. Wang, D. Gong, P. Feng, Y. Cheng, X. Cheng, Y. Jiang, D. Zhang and J. Cai, ACS Appl. Mater. Interfaces, 2023, 15, 8546–8554 CrossRef CAS PubMed.
- R. Qin, M. Hu, X. Li, T. Liang, H. Tan, J. Liu and G. Shan, Microsyst. Nanoeng., 2021, 7, 100 CrossRef CAS PubMed.
- H. Xu, L. Gao, Y. Wang, K. Cao, X. Hu, L. Wang, M. Mu, M. Liu, H. Zhang, W. Wang and Y. Lu, Nano-Micro Lett., 2020, 12, 159 CrossRef PubMed.
- G. Tian, K. Xu, Y. Huang, X. You, W. Yu, H. Liu, J. Li, J. Liu, X. Jin, H. Li, Q. Ke and C. Huang, J. Mater. Chem. A, 2023, 11, 22533–22533 RSC.
- P. Li, L. Xie, M. Su, P. Wang, W. Yuan, C. Dong and J. Yang, Nano Energy, 2022, 101, 107571 CrossRef CAS.
- B. Lee, H. Cho, S. Moon, Y. Ko, Y.-S. Ryu, H. Kim, J. Jeong and S. Chung, Nat. Electron., 2023, 6, 307–318 CrossRef.
- Y. Kumaresan, O. Ozioko and R. Dahiya, IEEE Sens. J., 2021, 21(23), 26243–26251 CAS.
- T. Liu, G. Y. Gou, F. Gao, P. Yao, H. Wu, Y. Guo and N. Xue, ACS Nano, 2023, 17(6), 5673–5685 CrossRef CAS PubMed.
- Y. Chang, L. Wang, R. Li, Z. Zhang, Q. Wang, J. Yang, C. F. Guo and T. Pan, Adv. Mater., 2021, 33, 2003464 CrossRef CAS PubMed.
- L. Gao, M. Wang, W. Wang, H. Xu, Y. Wang, H. Zhao, K. Cao, D. Xu and L. Li, Nano-Micro Lett., 2021, 13, 140 CrossRef CAS PubMed.
- J. He, Y. Zhang, R. Zhou, L. Meng, T. Chen, W. Mai and C. Pan, J. Mater., 2020, 6, 86–101 Search PubMed.
- L. Gao, Y. Han, J. U. Surjadi, K. Cao, W. Zhou, H. Xu, X. Hu, M. Wang, K. Fan, Y. Wang, W. Wang and H. D. Espinosa, Sci. China Mater., 2021, 64, 1977–1988 CrossRef.
- H. Li, K. Wu, Z. Xu, Z. Wang, Y. Meng and L. Li, ACS Appl. Mater. Interfaces, 2018, 10, 20826–20834 CrossRef CAS PubMed.
- Y. Lee, J. Park, S. Cho, Y.-E. Shin, H. Lee, J. Kim, J. Myoung, S. Cho, S. Kang, C. Baig and H. Ko, ACS Nano, 2018, 12, 4045–4054 CrossRef CAS PubMed.
- B. Lee, J.-Y. Oh, H. Cho, C. W. Joo, H. Yoon, S. Jeong, E. Oh, J. Byun, H. Kim, S. Lee, J. Seo, C. W. Park, S. Choi, N.-M. Park, S.-Y. Kang, C.-S. Hwang, S.-D. Ahn, J.-I. Lee and Y. Hong, Nat. Commun., 2020, 11, 663 CrossRef CAS PubMed.
- J. Huang, S. Peng, J. Gu, G. Chen, J. Gao, J. Zhang, L. Hou, X. Yang, X. Jiang and L. Guan, Mater. Horiz., 2020, 7, 2085–2096 RSC.
- C. Wu, T. Zhang, J. Zhang, J. Huang, X. Tang, T. Zhou, Y. Rong, Y. Huang, S. Shi and D. Zeng, Nanoscale Horiz., 2020, 5, 541–552 RSC.
- Z. Xiao, W. Zhou, N. Zhang, Q. Zhang, X. Xia, X. Gu, Y. Wang and S. Xie, Small, 2019, 15, 1804779 CrossRef PubMed.
- L. Yuan, Z. Wang, H. Li, Y. Huang, S. Wang, X. Gong, Z. Tan, Y. Hu, X. Chen, J. Li, H. Lin, L. Li and W. Hu, Adv. Mater. Technol., 2020, 5, 1901084 CrossRef.
- X. Tang, C. Wu, L. Gan, T. Zhang, T. Zhou, J. Huang, H. Wang, C. Xie and D. Zeng, Small, 2019, 15, 1804559 CrossRef PubMed.
- E. Mejía-Mejía, J. M. May, R. Torres and P. A. Kyriacou, Physiol. Meas., 2020, 41, 07TR01 CrossRef PubMed.
- A. Teren, F. Beutner, K. Wirkner, M. Löffler and M. Scholz, Medicine, 2016, 95, e2963 CrossRef PubMed.
- F. Lofrumento, G. Mandraffino, G. Trimarchi, A. Mancinelli, D. Restelli, R. De Sarro, D. Sinicropi, M. Cinquegrani, M. Cusma-Piccione, R. Manganaro, A. Recupero, G. Di Bella, C. Zito and S. Carerj, Eur. Heart J., 2022, 43, ehac544. 2175 CrossRef.
Footnotes |
| † Electronic supplementary information (ESI) available. See DOI: https://doi.org/10.1039/d3nr06664a |
| ‡ These authors contributed equally. |
| This journal is © The Royal Society of Chemistry 2024 |


