 Open Access Article
Creative Commons Attribution 3.0 Unported Licence
Optically monitoring the microenvironment of a hydrophobic cargo in amphiphilic nanogels: influence of network composition on loading and release†
Clara
López-Iglesias‡
ab,
Ante
Markovina‡
a,
Nithiya
Nirmalananthan-Budau
c,
Ute
Resch-Genger
 *c and
Daniel
Klinger
 *a
*a
aInstitute of Pharmacy, Freie Universität Berlin, Königin-Luise Straße 2–4, 14195 Berlin, Germany. E-mail: daniel.klinger@fu-berlin.de
bDepartment of Pharmacology, Pharmacy and Pharmaceutical Technology, I+D Farma group (GI-1645), Faculty of Pharmacy, Instituto de Materiales (iMATUS) and Health Research Institute of Santiago de Compostela (IDIS), Universidade de Santiago de Compostela, Campus Vida s/n, 15782 Santiago de Compostela, Spain
cDivision Biophotonics, Federal Institute for Materials Research and Testing (BAM), Richard-Willstaetter Str. 11, 12489 Berlin, Germany. E-mail: ute.resch@bam.de
First published on 17th April 2024
Abstract
Amphiphilic nanogels (ANGs) are promising carriers for hydrophobic cargos such as drugs, dyes, and catalysts. Loading content and release kinetics of these compounds are controlled by type and number of hydrophobic groups in the amphiphilic copolymer network. Thus, understanding the interactions between cargo and colloidal carrier is mandatory for a tailor-made and cargo-specific ANG design. To systematically explore the influence of the network composition on these interactions, we prepared a set of ANGs of different amphiphilicity and loaded these ANGs with varying concentrations of the solvatochromic dye Nile Red (NR). Here, NR acts as a hydrophobic model cargo to optically probe the polarity of its microenvironment. Analysis of the NR emission spectra as well as measurements of the fluorescence quantum yields and decay kinetics revealed a decrease in the polarity of the NR microenvironment with increasing hydrophobicity of the hydrophobic groups in the ANG network and dye–dye interactions at higher loading concentrations. At low NR concentrations, the hydrophobic cargo NR is encapsulated in the hydrophobic domains. Increasing NR concentrations resulted in probe molecules located in a more hydrophilic environment, i.e., at the nanodomain border, and favored dye–dye interactions and NR aggregation. These results correlate well with release experiments, indicating first NR release from more hydrophilic network locations. Overall, our findings demonstrate the importance to understand carrier–drug interactions for efficient loading and controlled release profiles in amphiphilic nanogels.
1. Introduction
Nanogels contain crosslinked polymeric networks which combine excellent colloidal stability, high surface area, and tuneable particle size,1,2 with good control over diffusional and mechanical properties.3 The polymer composition of nanogels can be adjusted to make them biocompatible and thereby promising carriers for the delivery of various cargos ranging from small molecule drugs, catalysts, and dyes to macromolecules, e.g., proteins, enzymes, and DNA.4–8 However, the overall hydrophilic nature of nanogels limits the loading with hydrophobic cargos. As 75% of the drugs currently under development and up to 90% of new chemical entities with a therapeutic potential are poorly water-soluble,9 this restricts the applicability of hydrophilic nanogels for drug delivery. This triggered the development of amphiphilic nanogels (ANGs),10 which are based on amphiphilic (random) copolymers that contain conventional hydrophilic groups but also pendant hydrophobic units.11 In aqueous media, these hydrophobic groups on the network assemble into hydrophobic domains that are surrounded by a hydrophilic hydrogel matrix, as recently demonstrated by small angle X-ray scattering (SAXS).12 This unique structure combines many advantages in a single colloidal system. The hydrophobic nanodomains enable the encapsulation of poorly water-soluble cargos.13 The cargo loading capacity and release kinetics are governed by the interaction between the hydrophobic cargo and the hydrophobic nanodomains.14,15 In addition, the flexible hydrophilic matrix provides control over the nanogel's mechanical properties and reduces potential toxic effects of the hydrophobic groups. The amphiphilic structure can be used to adjust and fine-tune the interaction with biological systems. For example, this enables controlling protein corona formation16 and adjusting the interaction with biological barriers, e.g., skin.12 Consequently, tailor-made ANGs elegantly combine the advantages of traditional nanogels with the properties of micelles or hydrophobic particles.To utilize the potential of ANGs as a platform for drug delivery applications, a more detailed understanding of the drug loading and release mechanisms is required as a prerequisite to predict and adjust drug-specific pharmacological profiles. Thus, the interaction of the cargo with the nanogel network, the precise cargo location, and a possible influence of the cargo loading concentration including cargo–cargo interactions need to be examined. While these interactions can differ from drug to drug depending on, e.g., drug hydrophobicity and molecular structure, the detailed study of these parameters for multiple drugs is too laborious and time consuming. Therefore, the utilization of hydrophobic dyes as model drugs has been established to provide more simply accessible insights that can be used as a basis for more detailed investigations with actual drug molecules.17–19 Thereby, also optical spectroscopic methods such as fluorescence spectroscopy can be exploited, which enable fast and very sensitive measurements and require relatively inexpensive instrumentation.
One of the gold standards for optical probing studies is the charge transfer (CT)-type dye Nile Red (NR), which shows a strong polarity responsiveness of its absorption and fluorescence spectra and its fluorescence quantum yield. An increase in NR microenvironment polarity is signalled by a red shift in absorption and fluorescence and a diminution in fluorescence intensity and quantum yield. The environment sensitivity of the optical properties of NR is attributed to the involvement of a twisted intramolecular charge transfer (TICT) in the depopulation of its excited singlet state, which is possibly due to the flexibility of the N–C bond between the dimethyl amino group and the aromatic core.20–23 In addition, NR can form optically detectable aggregates at high local dye concentration, which reveal blue shifted absorption spectra and are non- or barely emissive.24–26 Hence, NR has been frequently explored to probe the environment of cargo molecules in different nanostructures, e.g., polymeric and surfactant micelles, dendrimers, and other multicompartment nanoparticles as well as nanoclays.25–29 Optical studies of carrier systems such as ANGs with NR can provide information on the influence of NR concentration, carrier concentration, carrier degradation,30,31 and solvents used for ANG loading on NR microenvironment as previously shown by us.32 However, a systematic study on the NR microenvironment in ANGs made from copolymers containing different hydrophobic groups and the correlation of the results with NR release studies has not been reported so far.
Aiming for a deeper insight into the potential of ANGs as drug carriers, in the present work, we explored the influence of network hydrophobicity on cargo microenvironment for ANGs prepared from copolymers with different substitution pattern, i.e., different types of hydrophobic groups, and varying NR loading contents (LCs). To establish structure–property relationships for the tailor-made design of the next generation of drug carriers and delivery vehicles, we also correlated the results of photometric measurements and steady state and time resolved fluorescence studies with NR loading and release experiments.
2. Results and discussion
Network hydrophobicity and NR LC are assumed to influence the microenvironment of NR molecules in ANGs. This can yield NR species with spectroscopically distinguishable properties: (a) NR molecules located in an apolar environment, i.e., in the nanodomains formed by the hydrophobic groups, (b) NR molecules dispersed at the border to the surrounding hydrophilic matrix, and (c) NR molecules undergoing dye–dye interactions and possibly forming dye aggregates in a hydrophilic environment. This is schematically depicted in Fig. 1. To distinguish between these scenarios and to correlate them with the respective loading procedures, ANG composition, and ANG structure at a molecular level, we measured the absorption and fluorescence emission spectra, fluorescence quantum yields, and fluorescence decay kinetics of different ANGs with varying NR LCs. These spectroscopic data were then compared with the absorption and emission properties of NR determined in a series of aliphatic alcohols of increasing alkyl chain lengths and in acetonitrile (ACN)–water mixtures of varying water content. These comparisons are utilized to correlate the NR microenvironment in the ANGs with molecular model systems of well-defined polarity and proticity.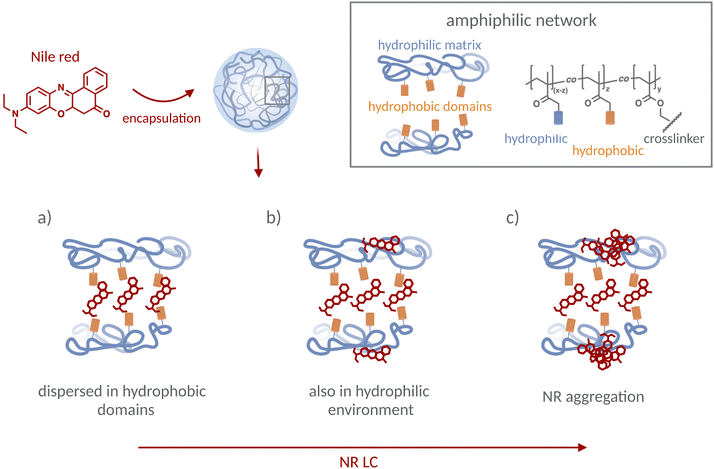 | ||
| Fig. 1 NR molecules can be encapsulated in the amphiphilic network of the nanogels at different locations depending on the chemical composition and structure of the ANGs and NR LC, yielding NR species in the following microenvironments: (a) NR molecules dispersed in the apolar environment provided by the hydrophobic ANG domains, (b) NR molecules also located in the hydrophilic ANG matrix, and (c) NR molecules undergoing dye–dye interactions and possibly forming aggregates in a hydrophilic environment in the ANGs at high NR LC. NR species in microenvironment (a) are expected to be fluorescent and reveal absorption and emission spectra located at shorter wavelengths compared to NR species (b), which should be also emissive yet reveal red shifted absorption and emission bands and most likely display reduced fluorescence quantum yields due to polarity- and hydrogen bonding-induced fluorescence quenching. (c) NR aggregates possibly formed at higher NR LC are most likely non- or barely emissive and can be recognized by blue shifted absorption spectra according to previous reports.26 | ||
2.1. ANG synthesis
Establishing structure–property relationships to guide the design of ANGs requires control over the network amphiphilicity while ideally maintaining the same colloidal structure, i.e., size distribution, particle morphology, and crosslinking density. To overcome synthetic challenges originating from the different solubility of hydrophilic and hydrophobic monomers, we developed a versatile platform for the synthesis of ANGs with variations in network hydrophobicity but similar colloidal properties.33 For this, we use crosslinked reactive precursor particles that are transferred into ANGs via a post-modification procedure. Thereby, different hydrophobic and hydrophilic groups can be introduced into the network starting from one batch of poly(pentafluorophenyl methacrylate) (PPFPMA) precursor particles.34 For the intended systematic study with NR, we used this strategy to prepare a library of ANGs with varying network amphiphilicity by functionalizing the reactive PPFPMA precursor particles with 80 mol% of hydrophilic 2-hydroxypropyl amine (HPA) and 20 mol% of different hydrophobic groups (ESI, Fig. S1a†). For a medium hydrophobicity, the network was functionalized with benzylamine (BENZA) or hexylamine (HEXA). For a high hydrophobicity, dodecyl amine (DODA), branched dodecyl amine (b-DODA), and amine-modified cholesterol (CHOLA) were employed. Successful functionalization was confirmed by ATR-FTIR (ESI, Fig. S1b†). Thereby, ANGs of comparable size (hydrodynamic diameter: 264–317 nm by DLS, ESI, Fig. S2 and S3†) and crosslinking degrees (1 mol% of EGDMA) were obtained.2.2. NR loading
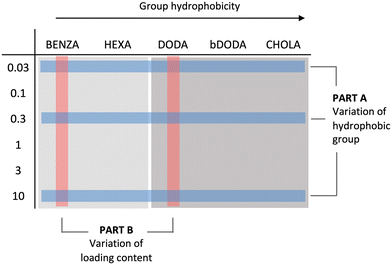
The study consists of two parts as summarized in Fig. 2. In part A, we spectroscopically assessed the influence of hydrophobic groups in the polymer network on the NR microenvironment. Here, it was crucial to determine the range where NR loading content (LC) affects the spectroscopic properties. We therefore used low (0.03 wt%), medium (0.3 wt%), and high (10 wt%) feed ratios. In part B, we investigated the influence of NR LC on the spectroscopic properties in more detail using BENZA and DODA ANGs as representative ANGs of medium and high hydrophobicity. The aim of this second part was to identify NR concentrations that can optically signal changes in the NR microenvironment. Therefore, we used a wider range of NR feed ratios. To ensure comparability between the different NR-loaded samples, always similar NR LCs were confirmed (ESI, Fig. S4†).2.3. Influence of network composition on NR microenvironment at low, medium, and high loading content
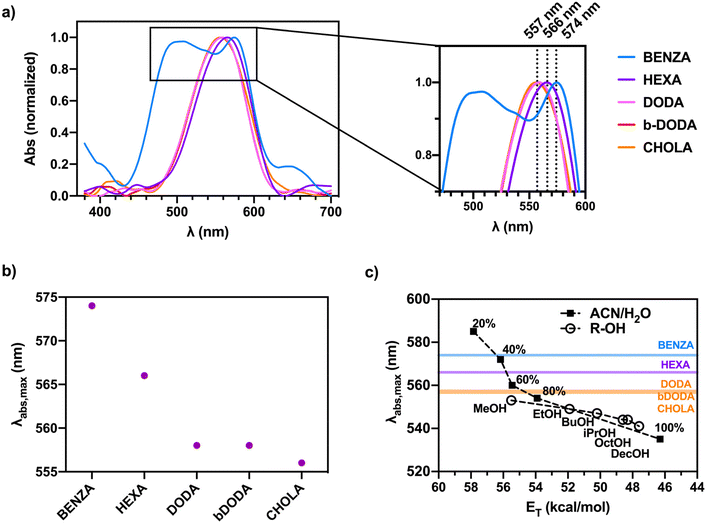 | ||
| Fig. 3 Absorption data of the nanogels prepared with high LC summarizing the influence of the hydrophobic groups in the nanogel network on the polarity of the NR microenvironment. (a) Absorption spectra of the different NR-loaded ANG samples with the inset showing the absorption peaks in more detail, (b) absorption maxima of the different NR-loaded ANG samples, and (c) comparison of the absorption maxima of the NR-loaded ANG samples with the corresponding values obtained for NR in acetonitrile/water mixtures of different water content and in alcohols of different chain length. Note that x-axis depicts the solvents’ empirical polarity, which is represented as energy of transition (ET). Values were extracted from the literature.37,38 | ||
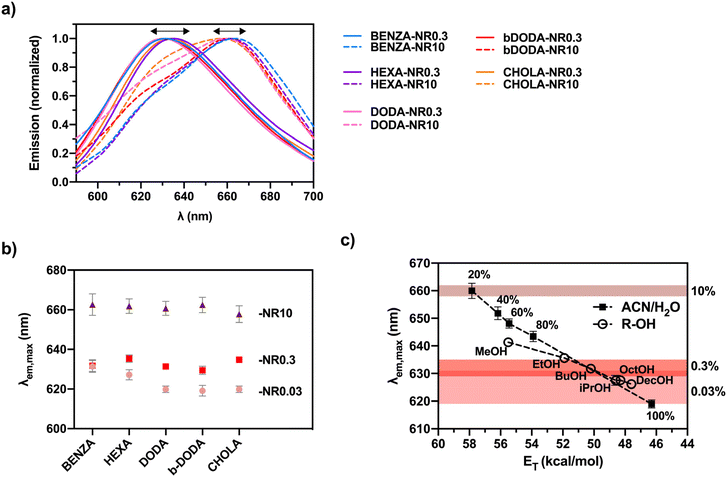 | ||
| Fig. 4 Emission spectra showing the influence of the hydrophobic network groups and LC on the polarity of the NR microenvironment: (a) Emission spectra of medium and high LCs show a red shift with increasing LC, (b) emission maxima undergoing a red shift for increasing LC in the ANG samples, and (c) comparison of the emission peak maxima obtained for the different NR LCs compared to the emission maxima of NR in ACN/water mixtures and alcohols of different chain length. Values for the respective LCs and normalized emission spectra for lowest feed ratio can be found in the ESI (Fig. S4a and S5,† respectively). | ||
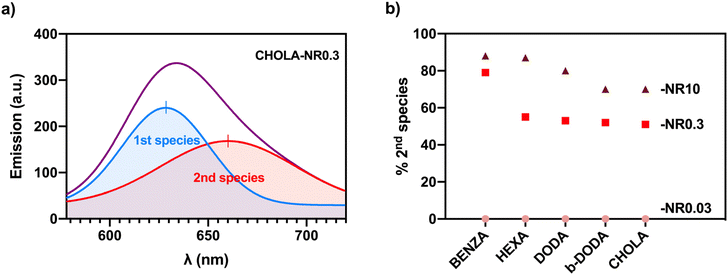
Spectral analysis of the NR emission bands of all ANGs revealed the presence of a single emission band for low and medium NR LCs, located at wavelengths of 618 nm to 635 nm, while nanogels with the highest LC exhibit a second band peaking at 660 nm. This band is ascribed to NR species (b) shown in Fig. 1 in addition to species (a). As NR aggregates (species (c) in Fig. 1) are most likely non- or barely emissive, the formation of these species cannot be fluorometrically detected.
Overall, absorption and emission studies suggest that at low LCs, the NR molecules are preferably located in the hydrophobic domains (Fig. 1, species (a)). As the loading capacity of these domains is limited, a further increase in NR content can force NR molecules to also occupy environments of higher polarity, i.e., the boundary between the hydrophobic groups and surrounding hydrophilic matrix (Fig. 1, species (b)). In such polar environments, NR–NR interactions encourage the formation of aggregates (Fig. 1, species (c)).
2.4. Dependence of NR fluorescence on loading content
To deeper examine the spectral properties of each individual species observed in part A, we conducted fluorescence lifetime studies. Since the appearance of different NR species is strongly dependent on LC, we expanded the previously investigated NR LCs (feed ratios: 0.03, 0.1, 0.3, 1, 3 and 10%). In these experiments, we focused on the BENZA system as model for nanogels of medium hydrophobicity, and the DODA system as model for ANGs of high hydrophobicity (Fig. 2). For all samples, the previously determined dependence of the spectral position of the emission maximum and QY on LC is still visible over the now broader NR LC range (ESI, Fig. S7†).Subsequently, fluorescence lifetimes were determined at the different λem,max of the proposed NR species (peak 1 and at peak 2 of the spectral deconvolution, ESI, Table S1†) from the measured decay kinetics. At both emission bands, the fluorescence decay curves revealed at least biexponential decay kinetics and an overall faster decay with increasing LC, both for the BENZA and the DODA samples (ESI, Fig. S8a†). This suggests an increasing contribution of the second NR species with increasing LC. Deconvolution and fitting of the decay kinetics at each emission peak gave two different fluorescence lifetimes (τ1 and τ2 with τ1 > τ2) for all NR LCs (Fig. 6 and ESI, Fig. S8†). At low LCs, the longest lifetime τ1 was predominant that is ascribed to NR molecules molecularly dispersed in the hydrophobic domains (species (a) in Fig. 1). An increasing LC caused a decrease in the relative contribution of τ1 while the contribution of the second shorter lived species with τ2 increased. We attribute this shorter lifetime τ2 to NR in a more polar environment such as the boundary of the hydrophobic domains or the external hydrophilic network (species (b) in Fig. 1).21 At high LCs, the increasing NR content leads to the appearance of an additional decaying species with a very short lifetime τ3. This species is assigned to very weakly emissive NR aggregates (species (c) in Fig. 1). For DODA nanogels, this effect is observed at LCs of 0.59 and 1.50 wt%. In contrast, for BENZA nanogels this third NR species can only be observed for a LC of 1.42 wt%. Thus, these additional low-emissive aggregates appear in the DODA samples already at lower NR LCs.
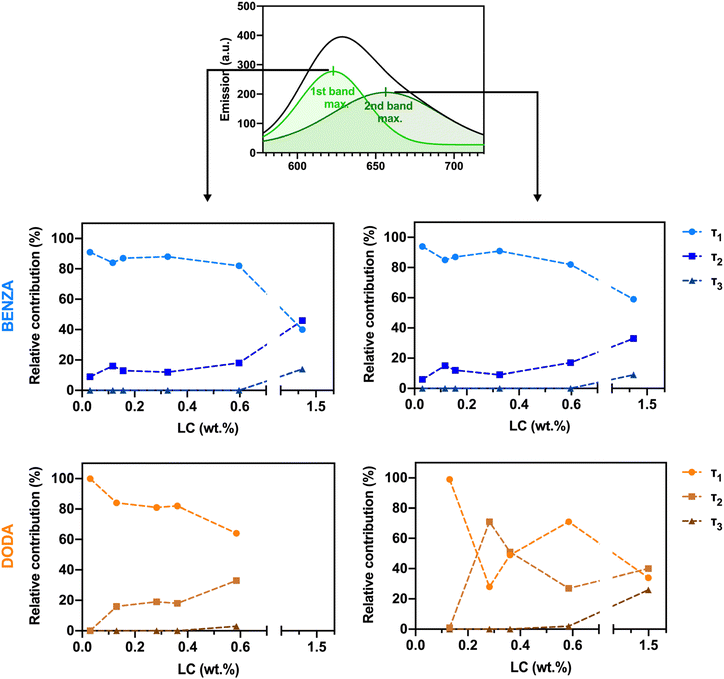 | ||
| Fig. 6 Relative contribution of the different NR species shown in Fig. 1 to the fluorescence decay for BENZA (top) and DODA (bottom) nanogels, obtained after deconvoluting the fluorescence decay curves obtained for the first (left) and second (right) emission peaks. Actual λem,max values vary from sample to sample and can be found in Table S1, ESI.† | ||
2.5. Dependence of NR spectroscopic properties on release
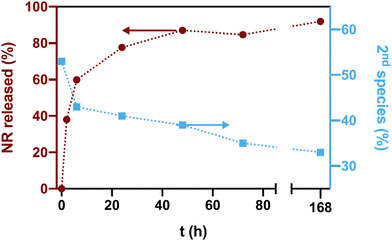
To explore the dependence of the different NR species on the release, we subsequently performed release studies with the ANGs. We hypothesized that NR species located at the more hydrophilic boundary between hydrophobic domains and hydrophilic matrix should be released faster than NR molecules facing a more hydrophobic microenvironment, i.e., a reverse behaviour as observed in the spectroscopically assessed NR loading studies. To test this hypothesis, a dialysis-based release experiment was conducted with selected NR-loaded nanogels. We chose the most hydrophobic ANGs, i.e., DODA-NR10 NGs, where the difference in hydrophobicity between hydrophobic domains and the surrounding hydrophilic matrix is maximized.Under sink conditions, an initial burst release of 40% of the total NR payload was observed in the first two hours, reaching 60% after 8 h (Fig. 7). This release was accompanied by a fast decrease of the 2nd species in the more hydrophilic locations (λem,max of 650 nm) to ca. 40% after 8 h of release. This confirms a fast release of NR from the more hydrophilic environment in the first hours. At longer times, the amount of released NR reached a plateau (ca. 85–90%). However, the percentage of 2nd species emitting at 650 nm kept decreasing slowly until it reached 33% after one week, thus suggesting a higher ratio of remaining NR in the hydrophobic domains. These findings are supported by a blue shift of the fluorescence emission maxima of the remaining NR in the ANGs, i.e., λem,max shifts from 628 nm to 623 nm during the release (ESI, Fig. S9a†). Similarly, the NR QY increases from 0.35 to 0.54 during the release experiment (ESI, Fig. S9b†).
Overall, these observations indicate a release-dependent redistribution of NR inside the networks. At first, the NR cargo in the more hydrophilic environment is released relatively fast. However, this release is not completely selective, i.e. involving only NR from hydrophilic ANG domains. It is rather the case that NR from the hydrophobic domains is released simultaneously, yet much slower. In the second release stage, the cumulative release reaches a plateau. The relative amount of the 2nd NR species in the more hydrophilic locations (λem,max of 650 nm) still decreases. Possibly, the distribution of NR inside the ANGs is changed thereby partly refilling the hydrophobic domains. This finding can support the use of ANGs as drug carriers for drugs that require an initial fast activity followed by a sustained release to maintain the therapeutic action.
3. Experimental section
3.1. Materials
Pentafluorophenyl methacrylate (PFPMA) and amine-functionalized cholesterol (CHOLA) were synthesized following literature procedures (Gruber 2018). Triethylamine (TEA, 99% purity) and benzylamine (BENZA, 98% purity) were purchased from ABCR. Hexylamine (HEXA, purity 99%), 2-butyl-n-octan-1-amin (b-DODA, 98% purity), 1-decanol (DecOH, 98% purity) and ammonium persulfate (APS, 99% purity) were obtained from TCI. Dodecylamine (DODA, 98% purity) Alfa Aesar. Ethylene glycol dimethacrylate (EGDMA, 98% purity), amino-2-propanol (HPA, 93% purity), and dodecyl sulfate sodium salt (SDS, 95% purity), methanol (MeOH, 99.8% purity), ethanol (EtOH, 99.9% purity), isopropanol (iPrOH, 99.5% purity), n-butanol (BuOH, 99.5% purity) and 1-octanol (OctOH, 99% purity) were purchased from Merck, Germany. Nile red (NR, pure) was obtained from Fluorochem, UK.3.2. Synthetic procedures
Purification of the particles was carried out by centrifugation (30 min, 10![[thin space (1/6-em)]](https://www.rsc.org/images/entities/char_2009.gif) 000 rpm), followed by removal of the supernatant and redispersion of the particles in DI water using a vortex and an ultrasonication bath. The process was repeated 5 times and the resulting particle suspension was measured by dynamic light scattering (DLS, Nicomp Nano Z3000, Particle Sizing Systems, Port Richey, USA) to determine the particle size distribution. Afterwards, the suspension was freeze-dried, and the polymeric structure was studied by ATR-FTIR spectroscopy (Spectrum Two, PerkinElmer, Waltham, USA).
000 rpm), followed by removal of the supernatant and redispersion of the particles in DI water using a vortex and an ultrasonication bath. The process was repeated 5 times and the resulting particle suspension was measured by dynamic light scattering (DLS, Nicomp Nano Z3000, Particle Sizing Systems, Port Richey, USA) to determine the particle size distribution. Afterwards, the suspension was freeze-dried, and the polymeric structure was studied by ATR-FTIR spectroscopy (Spectrum Two, PerkinElmer, Waltham, USA).
3.3. Loading of the particles with NR
Loading of NR was carried out by the co-solvent method described by Gruber et al.33 Briefly, 5 mL of the aqueous NG suspension (1.2 mg mL−1) were stirred (450 rpm) with 2.5 mL of a solution of NR in acetone at different concentrations to achieve final feed ratios of 0.03, 0.1, 0.3, 1, 3 and 10 wt% w.r.t. the NGs. The acetone was left to evaporate for 48 h, and afterwards, the suspensions were filtered through cotton and 0.8 μm cellulose mixed ester syringe filters to remove unloaded precipitates of NR. The nanogel samples were denoted as hydrophobic group + NR feed ratio. For example, CHOLA-NR10 refers to nanogels containing 80 mol% HPA groups and 20 mol% CHOLA groups in the network and loaded with a feed ratio of 10 wt% NR.3.4. Spectroscopic studies
Absorption measurements were performed with NR-loaded ANG dispersions using the highest LC (feed ratio of 10 wt%) to maximize NR absorbance while simultaneously reducing the influence of scattering on the measured absorption spectra. The absorption spectra were recorded in a plate reader using a clear-bottom 96-well plate (UV-Star®, Greiner Bio-one).Emission spectra of all the nanogels were recorded in a fluorescence spectrophotometer equipped with an integrating sphere (Quantaurus-QY, C11347 Absolute PL Quantum Yield, Hamamatsu, Japan). Samples were measured at an excitation wavelength of 556 nm using the same type of nanogels without NR as reference.
3.5. Fluorescence lifetime studies
The fluorescence decay kinetics providing the fluorescence lifetimes (τ) of the ANGs with different amount of NR were recorded with the calibrated fluorometer Edinburgh Instruments (FLS 920) equipped with the laser and a fast multichannel plate photomultiplier (MCP-PMT) as detector. All samples were excited at 556 nm with a spectral bandwidth of the excitation monochromator of 10 nm and the emission was always detected at the emission maximum with a spectral bandwidth of the emission monochromator of 10 nm, a 4096-channel setting, and time ranges of 50 ns. With this setup, τ values ≥ 0.2 ns can be reliably measured. The measured fluorescence decay kinetics were evaluated using the reconvolution procedure of the FAST program (Edinburgh Instruments). This procedure considers the measured instrument response function determined with a non-emissive scattering LUDOX solution (silica particle dispersion) which can influence the fluorescence decays. All photoluminescence decay profiles could be satisfactorily analyzed with mono-, bi- or tri-exponential fits with reduced χ2 values between 0.8 and 1.2. From the multiexponential decays, subsequently, the intensity-weighted average lifetimes were calculated and provided.3.6. Release tests
DODA-NR10 nanogels were prepared following the procedure described above. After filtration, 1 mL-aliquots were put into Pure-a-lyzer kits (MWCO 6000 kDa) and subjected to dialysis against 5 L of deionized water (37 °C, 100 rpm). At predetermined time points (2, 6, 24, 48, 72 and 168 h) the NGs were removed from the dialysis membrane and the fluorescence emission spectra and fluorescence quantum yield were measured. Deconvolution of the fluorescence emission gave the relative contribution of 1st and 2nd species. After fluorescence measurements, the aliquots were freeze-dried and resuspended in DMSO to determine the amount of NR remaining in the ANGs. Release at each time point was estimated indirectly from the difference in the LC of NR with respect to the original ANGs.4. Conclusion and outlook
We photometrically and fluorometrically examined the interaction of a hydrophobic cargo, i.e., the solvatochromic dye Nile red (NR) with amphiphilic nanogels (ANGs) of varying network composition. These ANGs were obtained by a platform approach allowing for the introduction of different hydrophobic and hydrophilic groups into the polymer network. Based upon the spectroscopic properties of NR, that signal the polarity of its microenvironment by changes in the spectral position and intensity of its absorption and fluorescence bands, we could identify three different, and sometimes coexisting, scenarios for the encapsulation of the hydrophobic model cargo: (i) NR molecularly dispersed in the hydrophobic domains, (ii) NR dispersed in the surrounding hydrophilic matrix, and (iii) aggregated NR.Overall, we observed a strong influence of the network amphiphilicity and NR LC on the spectroscopically probed NR microenvironment. In general, low NR LCs favor NR incorporation into the hydrophobic domains, while an increase in LC leads to NR accumulation at the boundary to the hydrophilic matrix until aggregation occurs. This effect is more pronounced for more hydrophilic ANGs and suggests a weaker interaction between the cargo and the respective domains for these carriers. Furthermore, release studies showed that this pathway is reversed when the concentration of NR in the ANGs is decreasing upon its diffusional release.
The knowledge acquired in this study sheds more light on how the chemical entities used in carrier design and loading conditions influence the organization of the cargo within the network. This information, together with comprehensive understanding of cargo redistribution upon release from the carrier, will allow us in the future to fine-tune the carrier structure and LCs to achieve specific drug release profiles and optimize therapeutic activities. With this goal, also further studies will be carried out to better understand the influence of each specific hydrophobic domain on the release profile, i.e. to modulate the velocity of the initial burst-like release and realize a more prolonged release.
Most importantly, we suggest that these results can be helpful for the design of other amphiphilic polymer carrier systems, e.g., block copolymer micelles, random copolymer micelles etc. In such systems, the hydrophilic parts are often not considered when discussing or programming specific loading and release profiles. However, our findings suggest a strong influence of these hydrophilic parts on cargo location. Since the resulting microenvironment can have pronounced impact on the loaded cargo's properties and its release profile, these effects need to be considered in future carrier design.
Conflicts of interest
There are no conflicts to declare.Acknowledgements
D. K. acknowledges funding by the DFG (Deutsche Forschungsgemeinschaft/German Research Council) (KL 3152/2-1, project number: 430915250). U. R. G. acknowledges funding by the German Research Council (DFG; grants RE 1203/23-2 and RE 1203/45-1). C. L.-I. acknowledges Xunta de Galicia (Consellería de Cultura, Educación e Ordenación Universitaria) for a postdoctoral fellowship [ED481B-2021-008]. We would like to acknowledge the assistance of the Core Facility BioSupraMol supported by the DFG.References
- A. V. Kabanov and S. V. Vinogradov, Angew. Chem., Int. Ed., 2009, 48, 5418–5429 CAS.
- H. Zhang, Y. Zhai, J. Wang and G. Zhai, Mater. Sci. Eng., C, 2016, 60, 560–568 CrossRef CAS PubMed.
- A. Gruber, A. A. Joshi, P. Graff, J. L. Cuéllar-Camacho, S. Hedtrich and D. Klinger, Biomacromolecules, 2022, 23, 112–127 CAS.
- D. M. Eckmann, R. J. Composto, A. Tsourkas and V. R. Muzykantov, J. Mater. Chem. B, 2014, 2, 8085–8097 CAS.
- D. Huang, H. Qian, H. Qiao, W. Chen, J. Feijen and Z. Zhong, Expert Opin. Drug Delivery, 2018, 15, 703–716 CAS.
- R. Kandil and O. M. Merkel, Curr. Opin. Colloid Interface Sci., 2019, 39, 11–23 CAS.
- D. Li, C. F. Van Nostrum, E. Mastrobattista, T. Vermonden and W. E. Hennink, J. Controlled Release, 2017, 259, 16–28 CAS.
- B. Sharma and S. Striegler, ACS Catal., 2023, 13, 1614–1620 CAS.
- A. Fahr and X. Liu, Expert Opin. Drug Delivery, 2007, 4, 403–416 CAS.
- C. Biglione, T. M. P. Neumann-Tran, S. Kanwal and D. Klinger, J. Polym. Sci., 2021, 59, 2665–2703 CAS.
- D. Abu Saleh, U. Rana, M. Higuchi and A. Sosnik, Mater. Today Chem., 2020, 18, 100359 CAS.
- A. F. Thünemann, A. Gruber and D. Klinger, Langmuir, 2020, 36, 10979–10988 Search PubMed.
- Z. Jiang, H. Liu, H. He, A. E. Ribbe and S. Thayumanavan, Macromolecules, 2020, 53, 2713–2723 CAS.
- L. Jiang, Z. Luo, X. J. Loh, Y.-L. Wu and Z. Li, ACS Appl. Bio Mater., 2019, 2, 3591–3600 CAS.
- H.-M. Lin, Z. Yang and L. F. Chen, Chem. Eng. J., 1993, 52, B29–B34 CAS.
- T. Bewersdorff, A. Gruber, M. Eravci, M. Dumbani, D. Klinger and A. Haase, Int. J. Nanomed., 2019, 14, 7861–7878 CAS.
- Z. Li, X. Du, X. Cui and Z. Wang, Ultrason. Sonochem., 2019, 57, 223–232 CAS.
- A. Kulshrestha, P. S. Gehlot and A. Kumar, J. Mater. Chem. B, 2020, 8, 3050–3057 CAS.
- G. Qiu, X. Liu, B. Wang, H. Gu and W. Wang, Polym. Chem., 2019, 10, 2527–2539 CAS.
- A. K. Dutta, K. Kamada and K. Ohta, J. Photochem. Photobiol., A, 1996, 93, 57–64 CAS.
- J. A. Levitt, P.-H. Chung and K. Suhling, J. Biomed. Opt., 2015, 20, 096002 Search PubMed.
- A. Ray, S. Das and N. Chattopadhyay, ACS Omega, 2019, 4, 15–24 CrossRef CAS PubMed.
- N. Sarkar, K. Das, D. N. Nath and K. Bhattacharyya, Langmuir, 1994, 10, 326–329 CAS.
- P. Greenspan and S. D. Fowler, J. Lipid Res., 1985, 26, 781–789 CrossRef CAS.
- I. N. Kurniasih, H. Liang, P. C. Mohr, G. Khot, J. P. Rabe and A. Mohr, Langmuir, 2015, 31, 2639–2648 CrossRef CAS PubMed.
- E. Fleige, B. Ziem, M. Grabolle, R. Haag and U. Resch-Genger, Macromolecules, 2012, 45, 9452–9459 CAS.
- H. Huo, J. Zou, S. Yang, J. Zhang, J. Liu, Y. Liu, Y. Hao, H. Chen, H. Li, C. Huang, G. Ungar, F. Liu, Z. Zhang and Q. Zhang, Macromol. Rapid Commun., 2022, 2200706 Search PubMed.
- T. Behnke, C. Würth, E.-M. Laux, K. Hoffmann and U. Resch-Genger, Dyes Pigm., 2012, 94, 247–257 CrossRef CAS.
- T. Felbeck, T. Behnke, K. Hoffmann, M. Grabolle, M. M. Lezhnina, U. H. Kynast and U. Resch-Genger, Langmuir, 2013, 29, 11489–11497 CrossRef CAS PubMed.
- D. Klinger and K. Landfester, Macromol. Rapid Commun., 2011, 32, 1979–1985 CrossRef CAS PubMed.
- K. Rajes, K. Walker, S. Hadam, F. Zabihi, F. Rancan, A. Vogt and R. Haag, Pharmaceutics, 2020, 13, 37 CrossRef PubMed.
- P. Manchanda, K. Achazi, D. Verma, C. Böttcher, R. Haag and S. K. Sharma, Polymers, 2020, 12, 1421 CrossRef CAS PubMed.
- A. Gruber, D. Işık, B. B. Fontanezi, C. Böttcher, M. Schäfer-Korting and D. Klinger, Polym. Chem., 2018, 9, 5572–5584 RSC.
- A. Gruber, L. Navarro and D. Klinger, Soft Matter, 2022, 18, 2858–2871 RSC.
- J. Pauli, T. Vag, R. Haag, M. Spieles, M. Wenzel, W. A. Kaiser, U. Resch-Genger and I. Hilger, Eur. J. Med. Chem., 2009, 44, 3496–3503 CrossRef CAS PubMed.
- A. Eisfeld and J. S. Briggs, Chem. Phys., 2006, 324, 376–384 CAS.
- C. Reichardt, Angew. Chem., Int. Ed. Engl., 1979, 18, 98–110 CrossRef.
- S. Balakrishnan and A. Easteal, Aust. J. Chem., 1981, 34, 943 CrossRef CAS.
- J. Pauli, M. Grabolle, R. Brehm, M. Spieles, F. M. Hamann, M. Wenzel, I. Hilger and U. Resch-Genger, Bioconjugate Chem., 2011, 22, 1298–1308 CrossRef CAS PubMed.
Footnotes |
| † Electronic supplementary information (ESI) available. See DOI: https://doi.org/10.1039/d4nr00051j |
| ‡ Equal contribution. |
| This journal is © The Royal Society of Chemistry 2024 |

