
Elevated temperature-driven coordinative reconstruction of an unsaturated single-Ni-atom structure with low valency on a polymer-derived matrix for the electrolytic oxygen evolution reaction†
Rahul
Patil
 a,
Anubha
Rajput
b,
Babasaheb M.
Matsagar
c,
Norman C. R.
Chen
cde,
Masaki
Ujihara
f,
Rahul R.
Salunkhe
g,
Praveen
Yadav
h,
Kevin C.-W.
Wu
c,
Biswarup
Chakraborty
*b and
Saikat
Dutta
*a
a,
Anubha
Rajput
b,
Babasaheb M.
Matsagar
c,
Norman C. R.
Chen
cde,
Masaki
Ujihara
f,
Rahul R.
Salunkhe
g,
Praveen
Yadav
h,
Kevin C.-W.
Wu
c,
Biswarup
Chakraborty
*b and
Saikat
Dutta
*a
aElectrochemical Energy & Sensor Research Laboratory, Amity Institute of Click Chemistry Research & Studies, Amity University, Noida, India. E-mail: sdutta2@amity.edu
bDepartment of Chemistry, Indian Institute of Technology, New Delhi, India. E-mail: cbiswarup@chemistry.iitd.ac.in
cDepartment of Chemical Engineering, National Taiwan University, Taipei 10617, Taiwan
dMolecular Science and Technology Program, Taiwan International Graduate Program Academia Sinica, Taiwan
eInternational Graduate Program of Molecular Science and Technology (NTU-MST), National Taiwan University, Taiwan
fGraduate Institute of Applied Science and Technology, National Taiwan University of Science and Technology, Taipei, Taiwan
gMaterials Research Laboratory Department of Physics, Indian Institute of Technology, Jammu, India
hSynchrotron X-ray Facility, Raja Ramanna Centre for Advanced Technology, Rajendra Nagar, Indore, Madhya Pradesh 452013, India
First published on 6th March 2024
Abstract
A high-temperature pyrolysis-controlled coordination reconstruction resulted in a single-Ni-atom structure with a Ni–Nx–C structural unit (x = N atom coordinated to Ni). Pyrolysis of Ni-phen@ZIF-8-RF at 700 °C resulted in NiNP-NC-700 with predominantly Ni nanoparticles. Upon elevating the pyrolysis temperature from 700 to 900 °C, a coordination reconstruction offers Ni–Nx atomic sites in NiSA-NC-900. A combined investigation with X-ray absorption spectroscopy, X-ray photoelectron spectroscopy, and soft X-ray L3-edge spectroscopy suggests the stabilization of low-valent Niδ+ (0 < δ < 2) in the Ni–N–C structural units. The oxygen evolution reaction (OER) is a key process during water splitting in fuel cells. However, OER is a thermodynamically uphill reaction with multi-step proton-coupled electron transfer and sluggish kinetics, due to which there is a need for a catalyst that can lower the OER overpotentials. The adsorption energy of a multi-step reaction on a single metal atom with coordination unsaturation tunes the adsorption of each oxygenated intermediate. The promising OER activity of the NiSA-NC-900/NF anode on nickel foam was followed by the overall water splitting (OWS) using using NiSA-NC-900/NF as anode and Pt coil as the cathodic counterpart, wherein a cell potential of 1.75 V at 10 mA cm−2 was achieved. The cell potential recorded with Pt(−)/(+)NiSA-NC-900/NF was much lower than that obtained for other cells, i.e., Pt(−)/NF and NF(−)/(+)NF, which enhances the potentials of low-valent NiSAs for insightful understanding of the OER. At a constant applied potential of 1.61 V (vs. RHE) for 12 h, an small increase in current for initial 0.6 h followed by a constant current depicts the fair stability of catalyst for 12 h. Our results offer an insightful angle into the OER with a coordinatively reconstructed single-Ni-atom structure at lower valency (<+2).
1. Introduction
Beyond the deviation of conventional metallic materials, the superior electrochemical activity of atomically dispersed metal ions as single metal atoms on a suitable non-metallic matrix and ligated to N-coordination environment with controlled valency in Ni–Nx–C structural units has attracted considerable attention.1,2 To achieve the desired coordination configuration around the central metal atom, challenges of access to a pyridinic-N source and a polymer as graphenic carbon source impose further hurdles for achieving coordination unsaturation around the isolated single metal atoms.3,4 Suitable graphitic microdomains and nanoarchitecture with optimized porous systems boost ion storage and superior adsorption sites.5 The microstructure of such hard carbon has faced a tradeoff between the rate performance and initial coulombic efficiency including the bottleneck of hindered practical applications. Configuration of the intrinsic Ni–N–C structural unit remains unanswered such as optimal coordination environment, intrinsic architecture of Ni–Nx–C sites, and effect of thermal wrinkling associated with the Ni–N bonds.6 Defect-rich M–N4−x species are coordinatively unsaturated which necessitates a protocol to access such intrinsically active moieties of Ni–Nx–C when derived from polymer or metal–organic frameworks.7,8 Defect-rich and aromatically dispersed single-atom Ni2+ in Ni–N2–O2 bonding exhibited in Ni-COF offers high-efficiency sites to boost photocatalytic H2 generation at a rate of 2.29 mmol g−1 h−1 and CO2 reduction. Such a Ni–N2 moiety exhibits a value of 1.35 Å as phase-uncorrected Ni–N distance with a contour maximum at 4.75 Å−1 corresponding to pyridinic-N bonding to Ni2+.9 A single peak at ∼1.4 Å in FT-EXAFS for Ni–N–C at a higher temperature of 900 °C, which contains Ni–N3 intermixing with changed intrinsic activity.6 The aspect of maximum utilization of metal ions in a coordination environment with full exposure of metal sites has attracted major attention for their atomically dispersed activity.10 This offers improved electrical conductivity, defined active sites, electrochemical efficiency, and so on.11 Density functional theory confirms that surface reconstructed Ni ions reduce the reaction barrier to facilitate the OER process.The precise configuration of isolated atoms in hetero-atom-doped two-dimensional and three-dimensional matrices is rapidly gaining attention due to maximum atom utilization, high intrinsic activity, and current densities with a facilitated interaction between central atom and conducting matrix.12 Atomically isolated Ni–N–C structural units are reported as isolated Ni sites on a porphyrinic triazine framework accessible via an ionothermal trimerization.13 Ni–N sites in atomically dispersed single Ni atoms and Ni nanoparticles were encapsulated in a multilayered carbon shell from which Ni sites were compared to clarify the restricted access to Ni sites.14 Removal of N moieties within Ni embedded in a hollow N-doped carbon shell results in the formation of Ni–Cx from Ni–Nx–C wherein varying Ni–Nx active sites with Ni–N4 and Ni–N2 within graphene vacancies without N coordination is evident. Therefore, determining different N–Nx coordination active sites with Ni–N4 to Ni–N2 at 900 °C is most possible as revealed from synchrotron X-ray absorption spectroscopic evidence.15 Efficient Ni–N moieties can be prepared by installing pyrrolic-N defects around Ni sites, which transform to a stable pyridinic-N dominant Ni–N2 coordination site via a defective local N loss to result in less restraint on central N atoms.16 It is evident that among Ni–Nx–Cy moieties, the Ni–N2–C2 structural units form in a facile manner and offer improved electrochemical performance and longer durability.17 Controlled preparation of an undercoordinated Ni–Nx holey graphene (hG) framework via carbon defect restoration via N removal involves facile trapping of single Ni atoms as confirmed by X-ray absorption spectroscopy (XAS).18 While for defect-driven creation of Ni–Nx sites with low coordination, Ni–Nx sites are anchored on highly defective hierarchically micro–mesoporous carbon with enhanced charge transport and more exposed metal-atom sites.19 Defect and electronic interactions of Ni-SA can be tailored through excess Ni 3d orbital unpaired electron-induced polarization loss.11 A coupling of pyrrolic Ni–N4 defect sites with varied N-type defects can modulate synergistic adsorption energy of substrate for electrochemical CO2 reduction.20 Therefore, low-coordination Ni–Nx sites with coordination unsaturation can be desirable for improved electrochemical performance for oxygenative adsorption processes such as the OER.
Abundant Ni–N motifs with great modulation of the local electronic environments of Ni-atom sites along with surface N-coordinated Ni nanoparticles undergo valence state change. The typical valence state of Niδ+ was determined from X-ray absorption near-edge spectroscopy (XANES) wherein transition energies of Ni-SA are located between those of Ni foil and NiO corresponding to a lower valence state 0 < δ < 2 of Ni.21 XANES, electron paramagnetic resonance (EPR) spectroscopy, and density functional theory (DFT) combined suggest a low-valent Ni(I) center in a A-Ni-NSG wherein Ni(II) species was reduced to low-valent Ni. Thus, a low-valent Ni(I) offers a highly distorted Ni–S coordination with low onset potential. In this Ni(I) species, a delocalization of an unpaired electron in the Ni 3dx2−y2 orbital with spontaneous charge transfer from Ni(I) to the carbon 2p orbital of CO2 forms a low-charged species.22,23 A coordination environment of pyrrolic-N sites coordinates with central Ni for NiPACN with thermodynamic control of formation. The presence of oxidized Ni atoms in a distorted square planar geometry by coordination of pyrrolic-N atoms is the case in NiPACN, which resembles the active sites of porphyrin.24 In contrast, a high-valent Ni-SA with Ni(III) bonded to oxygen sites on graphene carbon was reported wherein XPS evidence suggests the formation of Ni(III).25 The oxidation state of Ni of <+2 was confirmed from Ni K-edge XANES and XPS analysis wherein the absorption edge energy of Ni–N–C was lower than that of NiPc with Ni2+. A quantitative absorption energy analysis with energy values in eV was conducted for Ni foil. Ni–N–C and NiPc demonstrate an average valence of Ni sites of +1.37.3 This reasoned for a stronger forbidden electronic dipole with allowing of the 1s → 3d transition in the quadrupole which is stronger for Ni–N–C than for NiPc. This is due to a highly distorted and defective coordination environment of Ni–N–C probably caused by the asymmetric and unsaturated Ni–N coordination.3 Such high distortion and coordination unsaturation can be achieved via abundant defect sites due to N loss to result in coordinatively unsaturated Ni–N–C structural units. Beyond Ni(I) in a Ni–S-doped graphene matrix, local structures around Ni center offer a broken D4h symmetry with a weak binding affinity of *COOH to the porphyrin-like Ni–N4 site.26 Therefore, stabilization of a low-valent <+2 single Ni atom was successful in limited cases depending on the electronics around the central Ni atom and the nature of N-atom coordination to the central Ni atom in Ni–N–C structural units. The major argument that will arise from a low-valent Ni single atom is whether such low valency will offer distinctly powered overpotential and efficiency in electrochemical adsorption-based intermediate formation with a possibly faster rate.
Electrochemical water spitting includes cathodic hydrogen evolution (HER) and the anodic oxygen evolution reaction (OER) with Gibbs free energy change for this reaction being 237.2 kJ mol−1.27 Descriptor for the OER electrolysis with design of M–N–C catalysts is based on adsorption energy of oxygenated intermediates.28 Ni2+ in atomic form and as nanoparticles of metallic Ni play a major role in electrochemical processes for enhanced energy density with synergistically engineered composition of bimetallic systems.29 The role of Ni,Co–N bonding-induced d–p coupled electron transfer for optimal initial adsorption and splitting of water depends on the inter-layer electron transfer to boost surface catalytic activity.30 Efficient OER involves several features including cationic promotion, anion adjustment, defect sites, and ultrathin structures.31 Extraordinarily activating OER with maximized electrocatalytic activity, individual NiSACs bond to oxygen sites on graphene-like carbon with superior activity and OER stability in Ni atom coordinating to oxygen as active sites.32 Single Ni sites are favorable for promoting structural reconstruction into either dual metal sites or bridging with O atoms such as Ni–O–Fe bonds which creates spin channels for electron transfer.33 A major bottleneck of boosting conversion efficiency due to sluggish kinetics of the 4-electron transfer process of the OER has driven intensive comparative research between bulk and single-metal-atom systems for understanding the OER mechanism.34 The OER is a key process for rechargeable metal–air batteries and water splitting wherein the engineering of microenvironment and valency of the central metal atom has emerged as an effective tool to boost the sluggish kinetics.35
Herein, we present a strategy to investigate the coordination reconstruction around the central metal Ni atom as pyrolysis temperature is elevated from 700 to 900 °C by using Ni2+-phen-ZIF-8-RF polymer composite as substrate. An appropriate Ni-phen@ZIF-8-RF composite was derived from Ni-phen@ZIF-8 for using as subject for pyrolysis at 900 °C to access NiSA-NC-900 containing single Ni atoms. NiSA-NC-900 with single Ni atoms was obtained via pyrolysis of Ni2+-phen-ZIF-8-RF composite at 900 °C for 2 h resulting in NiSA-NC-900 containing single Ni atoms with coordination to pyridinic N selectively as result of carbon defects. The pyrrolic N loss is suggested by a combination of XANE-EXAFS spectral analysis, WT-contour analysis, and R-space EXAFS spectral fitting. The coordination configuration reconstruction to a Ni–N2–C structural unit is proposed based on the comparison of XANE-EXAFS K- and R-space spectral analysis of both NiNP-NC-700 and NiSA-NC-900 including fitting of R-space FT-EXAFS spectra. A low valency of Niδ+ (δ < +2) is also suggested by the soft-X-ray Ni L3-edge spectra.36,37 NiSA-NC-900/NF electrode showed excellent activity, by offering a better overpotential of 362 mV at 10 mA cm−2, over that of NiNP-NC-700-NF, which showed a value of 375 mV at the same current and loading. Chronoamperometric (CA) analysis for long-term durability of NiSA-NC-900-NF under OER conditions verified a constant applied potential of 1.615 V (vs. RHE). We have proposed a sequence of structural and electronic changes that results in a reconstruction of the coordination environment of Ni–N2–C in NiSA-NC-900-NF, which is responsible for the improved OER activity as compared to NiNP-NC-700-NF. These results offer an insightful view of the effect of higher pyrolysis temperature for the reconstruction of coordination configuration of NiSA at coordinatively unsaturated Ni–N–C sites.
2. Results and discussion
2.1 Preparation of single Ni atoms
Coordination-reconfigured NiSA-NC-900 containing unsaturated Ni–N2 sites is prepared from a pyrolysis experiment at 900 °C for 2 h at a constant argon pressure as described in Scheme 1. First, the Ni2+-1,10-phenanthrolein (phen) complex was prepared in the presence of ZIF-8 which was formed in a medium to which NiCl2·6H2O and 1,10-phenanthroline were added to form the desired Ni2+ complex to coat on ZIF-8 nanoparticles as the first step. A resorcinol-formaldehyde (RF) polymer was formed by a standard procedure.38 To this RF polymer dispersed in an aqueous medium, Ni2+-1,10-phen@ZIF-8 was dispersed and sonicated, followed by stirring at room temperature to form a Ni-phen@ZIF-8-RF composite. This Ni-phen@ZIF-8-RF composite was pyrolyzed separately at 700 °C and at 900 °C for 2 h under argon flow, which resulted in NiNP-NC-700 and NiSA-NC-900, respectively. The resulting product was extensively washed with 1 M H2SO4 to remove any unstable metallic and Zn2+ residue.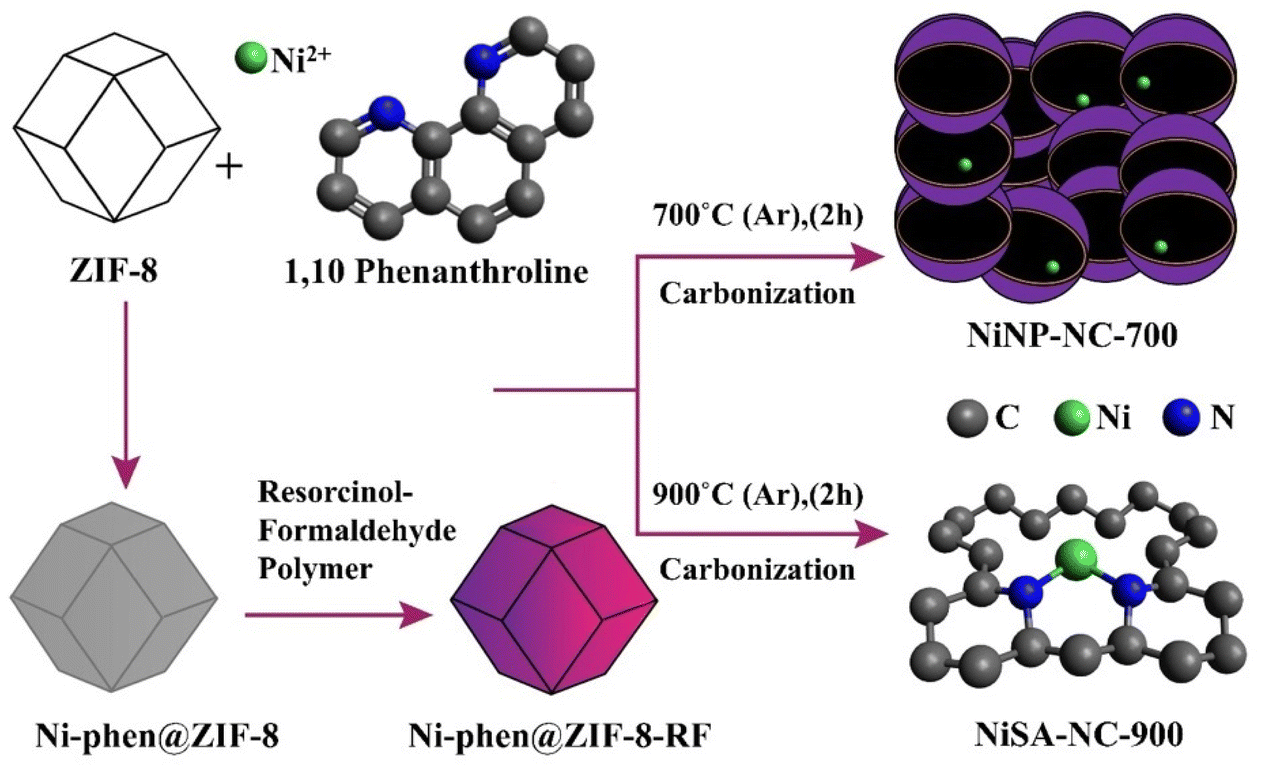 | ||
| Scheme 1 Pyrolysis at 700 and 900 °C to result in NiNP-NC-700 and NiSA-NC-900, respectively, from a Ni-phen@ZIF-8-RF composite. | ||
2.2 Structural analysis
The X-ray diffraction (XRD) patterns of Ni-phen@ZIF-8-RF composite and NiSA-NC-900 exhibit characteristic peaks corresponding to Ni–metal particles and graphitic diffraction at 22.39° and a weaker broad peak at 43.8° because of the formation of a higher degree of intralayer condensation (Fig. 1a and b). An increased intensity of XRD peak at low-angle scattering suggests a high density of micropores.39 Fig. S1† displays the XRD pattern of NiNP-NC-700, obtained by the pyrolysis of Ni-phen@ZIF-8-RF at 700 °C. The corresponding XRD pattern exhibits peaks corresponding to (111), (200), and (222) planes representing Ni nanoparticles. XRD analysis of NiSA-NC-900 evidences a graphitic multiple layer without any diffraction corresponding to Ni nanoparticle (Fig. 1b) unlike in NiNP-NC-700 (Fig. S1†), which showed graphitic C(002) diffraction along with diffraction planes Ni(111) and Ni(200) suggesting the presence of Ni metallic nanoparticles. However, the XRD pattern of NiSA-NC-900 (Fig. 1(b)) confirms the absence of Ni metal nanoparticles or Ni oxide nanoparticles. | ||
| Fig. 1 (a) XRD pattern of Ni-ZIF-8 RF polymer. (b) XRD pattern of NiSA-NC-900. (c) XPS spectral pattern of NiSA-NC-900 for N 1s. (d) XANES spectra with pre-edge peaks of NiSA-NC-900, NiNP-NC-700 and Ni foil. (e) Expanded XANES spectra to locate electronic transitions at pre-edges of Ni-SA-900. (f) R-Space spectra of NiSA-NC-900 and NiNP-NC-700. (g) First-shell (Ni–N) fitting of Fourier transformations of EXAFS spectra for NiSA-NC-900. Top and bottom traces are magnitude and imaginary part, respectively. WT contour plots of Ni K-edge EXAFS spectra of (h) NiSA-NC-900 (peak at 5.23K (Å−1)) and (i) reference Ni-foil material (peak at 8.10K (Å−1)). | ||
X-ray photoelectron spectroscopy (XPS) for C 1s exhibits a characteristic pattern of C![[double bond, length as m-dash]](https://www.rsc.org/images/entities/char_e001.gif) C and C–C bonding of a graphitic framework along with C–N moieties as major components, as revealed in deconvoluted spectra (Fig. S2a†). The XPS spectrum of N 1s deconvoluted into pyridinic-N (398 eV), graphitic-N (401 eV), and oxidized-N (N–O) (403.5) reveals that instead of expected pyridinic-N and pyrrolic-N, only pyridinic-N is coordinated to the central metal Ni (Fig. 1c).40 This analysis of the N 1s XPS spectrum suggests that the graphitic framework contains pyridinic-N for reconstructing the Ni-SA coordination environment which originates from 1,10-phen and RF polymer due to graphenic NC formation from NiNP-NC-700 catalyzed by the Ni NPs. This also suggests the corresponding pyrrolic-N, originating from 2-methylimidazolate of ZIF-8, is lost at the pyrolysis temperature window of 700–900 °C wherein Ni atoms coordinate to electron-deficient pyridinic-N including a coordination unsaturation of Ni-SA. However, XPS results do not extend to predict the Ni–N–C coordination structure with Ni with either a higher or lower coordination number.
C and C–C bonding of a graphitic framework along with C–N moieties as major components, as revealed in deconvoluted spectra (Fig. S2a†). The XPS spectrum of N 1s deconvoluted into pyridinic-N (398 eV), graphitic-N (401 eV), and oxidized-N (N–O) (403.5) reveals that instead of expected pyridinic-N and pyrrolic-N, only pyridinic-N is coordinated to the central metal Ni (Fig. 1c).40 This analysis of the N 1s XPS spectrum suggests that the graphitic framework contains pyridinic-N for reconstructing the Ni-SA coordination environment which originates from 1,10-phen and RF polymer due to graphenic NC formation from NiNP-NC-700 catalyzed by the Ni NPs. This also suggests the corresponding pyrrolic-N, originating from 2-methylimidazolate of ZIF-8, is lost at the pyrolysis temperature window of 700–900 °C wherein Ni atoms coordinate to electron-deficient pyridinic-N including a coordination unsaturation of Ni-SA. However, XPS results do not extend to predict the Ni–N–C coordination structure with Ni with either a higher or lower coordination number.
To reveal the coordination of Ni atoms, the Ni K-edge XANES spectra of NiSA-NC-900 and NiNP-NC-700 (Fig. 1(d)) were compared with those of Ni foil and nickel phthalocyanine (NiPc) with a saturated Ni–N4 structure.3,41 The blue line in Fig. 1(d) represents the XANES curve of NiSA-NC-900 wherein two major pre-edge positions at 8334.2 eV and 8339.4 eV were predominantly evident. However, a high-intensity distinct pre-edge peak at 8351.8 eV suggests that the local electric dipole transition (1s → 4p transition) occurs in NiSA-NC-900 where empty p states of Ni atoms are hybridized with the empty 3d states. Dipole transition only occurs on the non-centrosymmetric structure which supports the difference from the symmetric Ni–N4 structure.42 A comparison of XANES results suggests that based on the intense peak at 8338 eV for NiPc with Ni–N4 structure, our NiSA-NC-900 displays a weaker pre-edge peak at 8339 eV which suggests a role of Ni–Nx structure with electron deficiency, N loss, and defect formation.16 An enlarged view of the XANES spectra in Fig. 1(e) presents clearly all four possible pre-edge positions at 8334, 8339, 8351, and 8361 eV. Considering such a difference of XANES concerning NiPc, the unsaturated coordination structure in NiSA-NC-900 is responsible for peaks at 8351 and 8362 eV corresponding to the transitions, completely different as compared to Ni–Nsp2. A XANES spectral transition of 1s → 4px,y is suggested with a pre-edge peak at 8351 and 8361 eV.
In the Fourier transformed EXAFS analysis (Fig. 1f), the absence of Ni–Ni peak at 2.1 Å for NiSA-NC-900 suggests atomic dispersion of Ni atoms on the graphene frameworks which is consistent with the XRD results. In the EXAFS analysis of NiSA-NC-900, the main peak at 1.25 Å is attributed to the first-shell scattering interaction of Ni–N. In the case of coordinatively saturated Ni–N4 structure, there is an additional small peak expected at approximately 1.8 Å which corresponds to the second scattering interaction (Ni–C).43,44 However, there is no additional peak observed in the R-space EXAFS spectrum of NiSA-NC-900, which suggests the absence of Ni–C scattering. As compared with Ni–N4 of SA-NiNG-NV, the corresponding second scattering peak shifts to shorter internuclear length and the absence of any second-order scattering corresponds to Ni–C.16Fig. 1(f) shows a peak at 2.17 Å corresponding to Ni–Ni scattering in NiNP-NC-700 which confirms the presence of Ni metallic nanoparticles and a small peak. Upon increasing the pyrolysis temperature to 900 °C for 2 h, resulting materials exhibit scattering with higher internuclear distance (∼2.50 Å) as compared to internuclear distance (0.8 to 1 Å) of Ni sites (Ni–Nx and Ni–Ni) in NiNP-NC-700. Therefore, significant N atom loss is expected during pyrolysis of Ni-phen@ZIF-8-RF at a temperature ranging from 700 to 900 °C. During this elevation of temperature at a ramp rate of 5 °C per minute, N loss is responsible for the formation of Ni0–Nx selectively on pyridinic-N. Significant Ni–Nx on pyridinic N is obvious as realized from the major percentage of pyridinic N obtained from the N 1s XPS spectrum (22.8%) (Fig. 1c). The magnitude (top) and imaginary part (bottom) of R-space Ni K-edge spectra and fitting curves of NiSA-NC-900 are shown in Fig. 1g. By using the EXAFS spectral plot (Fig. 1g), the structural parameter fitting of NiNx-NC-900 suggests a Debye–Waller factor of 0.011 with coordination number 2 at an R factor of 0.05 (Table S1†). The coordination environment of Ni–N2–C indicates that Ni–N4 undergoes a loss of N resulting from the elevation of temperature to 900 °C during pyrolysis. The proposed Ni–N2 structural unit is supported by the WT-contour peak at 5.23 Å−1 (Fig. 1h) with reference with Ni-foil (Fig. 1i).40,45
The coordination vacancies due to the loss of pyrrolic-N drive further changes in the coordination configuration of Ni atoms with an alteration in Ni–N bond lengths. As a result of the involvement of pyridinic-N, the possibility of forming Ni–Nx–C (x = 2, 3) cannot be ruled out because of vacancy-driven reconstruction in the local coordination environment. A shift in the R-space EXAFS spectral peak of NiSA-NC-900 at 1.25 Å corresponds to a Ni–N scattering (Fig. 1g) as compared to a peak at 1.4 Å corresponding to Ni–N4.46 However, it has been observed that for the Ni–N–C structure, pyridinic-N sites bind selectively, resulting in increased XPS absorption for pyridinic-N resonant transition for the Ni–Nx moiety. EXAFS R-space spectra show a peak of a lower k (Å−1) at 1.25 Å corresponding to Ni–N2–O2 bonding in a Ni-COF with contour maxima at ∼4.75 Å−1.9 A Ni–N/O single-atom site with an exceptionally broad peak at 1.25 Å was evident, which corresponds to Ni species with a square planner geometry.40 The loss of pyrrolic-N gives rise to coordination vacancies, which leads to the local reconstruction of pyridinic-N containing Ni–N units. Those N vacancies further reconstruct the coordination environment of central Ni atoms, leading to a change in Ni–N bond length. R-Space EXAFS spectra of Ni-SA-900 exhibit two peaks at 2.4 and 3.3 Å, indicating the secondary coordination shell with a possible Ni–O bond formation in Ni–Nx single atom. A peak at 1.25 Å in the R-space EXAFS spectrum of NiSA-NC-900 is a slight deviation from the peak at 1.4 Å of a centrosymmetric Ni–N4 structure. NiPc (Pc = phthalocyanine) with a D4h centrosymmetric Ni–N4 structure reveals a weak pre-edge peak in XANE spectra, which is attributed to the local electric quadrupole transition (1s → 3d transition).16,47 EXAFS analysis, as compared to Ni–N4–C, exhibits both a first-shell scattering interaction (Ni–N) peak at 1.4 Å and a second scattering interaction (Ni–C) with a small peak at 1.8 Å with the possibility of a shift of second scattering to a shorter length with higher intensity.16
NiSA-NC-900 exhibits higher and more distinct pre-edge peaks at 8333.2 and 8339.40 Å due to local electric dipole transition (1s → 4p transition) wherein empty p states of Ni atoms are hybridized with the empty 3d states. Such a dipole transition is mainly found for a noncentrosymmetric structure. This supports the fact that the possible coordinative structure of NiSA-NC-900 may not involve the symmetric Ni–N4 structural unit; dipole transition is expected in a noncentrosymmetric structure. NiSA-NC-900 pre-edges support a noncentrosymmetric structure, unlike a centrosymmetric Ni–N4. To uncover the coordination environment around the Ni center, the FT-EXAFS of NiSA-NC-900 were fitted, wherein NiPc was used to calculate the standard amplitude reduction factor. Upon repeated fittings of NiSA-NC-900 with pyridinic-N coordinated Ni–N–C structural unit (Table S1†), the results matched well with the experimental data with each Ni atom supporting average coordination with two N atoms forming pyridinic-N-based Ni–N2 (pyridinic sp2) coordinatively unsaturated configuration. This is further revealed from the wavelet transform (WT) contour peak at ∼5.23 Å−1 as opposed to the same of Ni foil at 8.10 K Å−1 (Fig. 1h and i). This conclusively confirms pyridinic-N coordination in Ni–N2 (pyridinic) supported by the FT-EXAFS spectral pattern. Compared with the FT-EXAFS spectra of Ni-NC-700 with a dominant peak at 2.14 Å being almost consistent with the results for Ni foil, nitrogen-doped carbon-encapsulated Ni metallic nanoparticles are involved in the process of forming NiSA-NC-900. Ni species (single Ni atom and N-doped carbon encapsulated Ni NPs) are revealed in our comparative R-space EXAFS spectra, wherein the evolution of NiSA-NC-900 at 900 °C originates from NiNP-NC-700 with a major Ni–Ni scattering path.14
A fitting analysis (Table S1†) reveals σ2, the Debye–Waller factor (a measure of thermal and static disorder in absorber–scatterer distances). The energy position of the absorption edge of NiSA-NC-900 is situated between those of Ni foil and NiNP-NC-700, which further confirms the intermediate valence state of Ni. The detailed WT transformed analyses provide a higher resolution in both radial R space and K space. As shown in Fig. 1(h), the Ni intensity maximum in the WT contour spectra of NiSA-NC-900 is at 5.23 Å−1 for the Ni–N scattering path, which suggests a reconstruction of coordination configuration from Ni NPs to single-Ni-atom Ni–Nx sites48 as compared to NiO and NiPc.49 Ni L-edge soft X-ray spectroscopic investigation of NiSA-NC-900 probing the electronic structure of the central Ni atom reveals a peak at 851.54 eV (Fig. S5†) corresponding to Ni L3(2p1/2)-edge which corresponds to L3 absorption centroid for low-valent Niδ+ (δ < 2).50R-Space EXAFS spectra showed secondary peaks at 2.2 and 2.36 Å−1 (Fig. 1(f)), possibly corresponding to Ni clusters.15 Ni–O scattering appears at ∼1.84 Å in R-space EXAFS spectra; however, such a peak is not observed for NiSA-NC-900, which excludes the possibility of N and O both coordinating to the Ni center.40
Subsequently, transmission electron microscopy (TEM) characterization was performed for both NiSA-NC-900 and NiNP-NC-700 to better realize the local N environment and Ni metal atom coordination reconstruction in the N–C matrix at 900 °C (Fig. S3a–f and S4†). The HAADF-STEM and energy dispersive X-ray spectroscopy (EDS) results support the nature of N-coordination environment of Ni atoms with elemental mapping indicating the presence of Ni atoms in an N-doped matrix (Fig. 2a–d). TEM analysis of dark- and bright-field images revealed the wrinkled graphenic matrix with a thicker wall and ununiformly shaped blocks (Fig. 2b and c) formed from Ni-phen@ZIF-8-RF composite containing aromatic C6 moieties along with C5 moieties from 2-imidazolate from ZIF-8 (Scheme 1). However, Ni2+ metal ion is complexed by the 1,1-phenanthroline to keep intact the Ni-atom source with well-defined +2 valence and pyridinic-N coordination environment in a Ni-phen@ZIF-8-RF composite before pyrolysis at 900 °C. The HR-TEM image at a 5 nm scale (Fig. 2c) shows graphenic morphology with thicker walls possibly containing metal species as seen in Fig. 2d.
 | ||
| Fig. 2 (a) Dark-field transmission electron microscopic image. (b) Bright-field TEM image of NiSA-NC-900 with thick shell-like structure. (c–f) HR-TEM images at 5 to 20 nm scale. (g and h) Thick wall for the shell-like structure. (i) HAADF-STEM bright-field image of NiSA-NC-900. (j and k) HRTEM-STEM images. (l) AC-HAADF-STEM image with Ni-SA identified as white dots. (m) Electron image of a section of NiSA-NC-900 and corresponding C, N, Ni, O elemental mapping of which Ni-atom mapping shows the isolated Ni atoms. | ||
HR-TEM images show graphenic architecture (Fig. 2e and f) with thicker walls of spherical blocks that are >10 nm thicker (Fig. 2g and h). At a lower resolution, wrinkled graphenic blocks are shown in Fig. 2i. HAADF-STEM images at 5 nm scale display graphenic matrix (Fig. 2j and k) including red-circled bright spots indicating the presence of isolated Ni atoms (Fig. 2l) in dark-field mode. The electron image of HAADF-STEM (Fig. 2m) with elemental mapping reveals a uniform distribution of Ni atoms (violet color) on the N-doped carbon matrix with a uniform distribution of N atoms in the framework. The presence of O atoms in NiSA-NC-900 does not exclude the presence of the Ni–Ox–Cx structural unit along with the presence of Ni–Nx–Cy as a single-Ni-atom coordination configuration. Fig. S3c–f† shows HR-TEM images of NiSA-NC-900 displaying graphitic shells in an MWCNT-like architecture along with graphitic N–C crystalline planes suggesting a graphitic N–C architecture containing Ni–N–C structural units.
In contrast, TEM analysis of NiNP-NC-700 shows the presence of larger particles (∼50 to 100 nm) of N–C (Fig. S4a–c†), derived from Ni-phen@ZIF-8-RF, including Ni nanoparticles. The graphitic crystalline planes are evident from the HAADF-STEM dark-field image (Fig. S4d†). These results are also supported by elemental mapping analysis displaying the presence of desired Ni species and residual Zn species. Therefore, a contrasting feature in HAADF-STEM analysis along with elemental mapping analysis supports the presence of Ni atoms and Ni NPs in respective samples (Fig. S4f–h†).
Both samples NiSA-NC-900 and NiNP-NC-700 were further confirmed by high-angle annular dark-field scanning transmission electron microscopy (HAADF-STEM). Sub-angstrom-resolution, aberration-corrected STEM was conducted wherein individual Ni atoms were observed in the atomic-resolution HAADF images (Fig. 3a–f). At the 5 nm scale in Fig. 3b and e, the uniform distribution of isolated Ni atoms (white dots) on the surface of NC-900 was evident by scanning at four different regions of the Ni-SA-NC-900 sample which only confirms the presence of Ni atoms. A histogram analysis (Fig. 3c inset) shows the very narrow size distribution of Ni (1.1 Å) as per the distribution versus intensity maximum wherein typical diameter sizes of isolated Ni atoms are represented in the inset bar plot. This HAADF-STEM analysis in detail supports the universality of our strategy of coordination reconstruction as described in Scheme 1. A very narrow size distribution of Ni atoms found in NiSA-NC-900 links to the precision of the method introduced in this report and also as a result of graphitic NC-900 resulting from resorcinol-formaldehyde polymer with embedded Ni-1,10-phenanthroline chelate, favorable for N-atom-doped NC system for coordinating Ni atoms.51
 | ||
| Fig. 3 HAADF-STEM images of NiSA-NC-900: (a) 20 nm scale bar, (b) 5 nm scale bar, (c) 2 nm scale bar (inset shows the size distribution of Ni atoms determined from HAADF-STEM images with >100 Ni atoms considered; the most probable value is ∼1.1 Å), and (d and e) 5 nm scale bar, with examination of various regions revealing that only isolated Ni atoms (white dots circled) are present and uniformly dispersed on the NC-900 support at the atomic scale. (f) HAADF-STEM image at 2 nm scale. (g–i) Corresponding enlargements of the marked boxes in (d–f). | ||
2.3 Electrochemical oxygen evolution activity
Before examining the electrochemical OER performance, a few cyclic voltammetry (CV) scans were recorded for NiSA-NC-900/NF (deposited on nickel foam) within a potential window of 0.9–1.95 V (vs. RHE) at a scan rate of 5 mV s−1 to activate the catalytic sites (Fig. S6†). A strong redox feature with an approximate E1/2 value of 1.4 V (vs. RHE) was observed in the CV cycles which can be ascribed to the oxidation of Ni(II) to Ni(III) presumably from the catalyst and NF substrate to some extent (Fig. 4a inset and Fig. S7†). Linear sweep voltammetry (LSV) was recorded within a potential range of 1.0–1.8 V (vs. RHE) for NiSA-NC-900/NF after activation of the electrode. A weak oxidation peak at 1.4 V in the LSV curves indicates the in situ formation of Ni(III) followed by a steady increase in the catalytic current which indicates catalytic OER (Fig. 4b).52 Different mass loading of the catalyst was tested and the best activity was obtained with 3.6 mg mass loading which implied a monolayer formation on the electrode surface to achieve the best enhanced OER performance (Fig. S7 and Table S2†).53 The electrochemical OER performance of the NiSA-NC-900/NF material was also compared with that of the analogous NiNP-NC-700/NF, where NiSA-NC-900/NF exhibited greater activity, showing a better overpotential of 362 mV at 10 mA cm−2 in comparison to NiNP-NC-700/NF which showed an overpotential of 375 mV at same current with a loading of 3.3 mg (Fig. 4a). The greater OER activity of NiSA-NC-900/NF can be correlated to the better electrokinetics and lower charge transfer resistance across the electrode–electrolyte junction of NiSA-NC-900/NF which can be directly related to a lower Tafel slope of 39.68 mV dec−1 obtained from the Tafel plot (Fig. 4b). An electrochemical impedance spectroscopic (EIS) study was performed at a constant potential of 1.6 V (vs. RHE). The semi-circular Nyquist plot and corresponding equivalent circuit fitting provided the charge-transfer resistance (Rct) of the electrode and indicated that the electrode–electrolyte junction involves a double-layer formation (Fig. 4c).54 The better Rct value of NiSA-NC-900/NF greatly influences the electrocatalytic activity (Table S3†). The number of active sites that participate in the reaction also influences the catalyst performance, commonly called the electrochemically active surface area (ECSA). The ECSA is directly related to the double-layer capacitance (Cdl) value of the material. The Cdl can be calculated from the non-faradaic current response of the electrode (Fig. S8†).55 The ECSA can be determined from the Cdl value and the specific capacitance (Cs) of the electrode being investigated.56 The obtained Cdl value for NiSA-NC-900/NF is 3.19 mF, which corresponds to an ECSA value of 79.75 cm2 (Fig. 4d). To establish the stability of the catalyst, a chronoamperometric (CA) study was done to verify the long-term durability of NiSA-NC-900/NF under OER conditions. At a constant applied potential of 1.615 V (vs. RHE), initially the catalyst shows an increase in current for 0.6 h due to activation of the catalyst. Afterwards, there was a stable current for further 12 h, that indicates the structural and chemical robustness of the catalyst (Fig. 4e). | ||
| Fig. 4 (a) Polarization curves were obtained from the OER-LSV study with NiSA-NC-900/NF and NiNP-NC-700/NF. Inset: polarization curves for OER-CV showing the redox wave. (b) Tafel slopes obtained from the LSV curves for NiSA-NC-900/NF and NiNP-NC-700/NF. (c) Nyquist plots for NiSA-NC-900/NF and NiNP-NC-700/NF from the data obtained from the EIS study and the corresponding circuit diagram in the inset. (d) Cdl values of NiSA-NC-900/NF and NiNP-NC-700/NF were calculated from the slopes of the linear fitting of Δj (mA cm−2) vs. scan rate (mV s−1). (e) Chronoamperometric study of NiSA-NC-900/NF in OER conditions for 12 hours to establish the durability of the catalyst. (f) The polarization curves of OWS study of the electrolyzer NiSA-NC-900/NF(−)//(+)Pt and comparison with other sets of electrodes, i.e., NF(−)//(+)Pt and NF (−)//(+)NF. | ||
The promising OER activity of the NiSA-NC900/NF anode inspired us to investigate the overall water splitting (OWS) activity using a Pt coil as a cathode in 1 M KOH. An LSV study was done using the two-electrode setup: Pt(+)/(−)NiSA-NC900/NF. The polarization curve recorded in the LSV study showed that the current density gradually increased, reaching a maximum current of 40 mA while a cell potential of 1.64 V was recorded at a current density of 1.75 V at 10 mA cm−2. The cell potential recorded with Pt(−)/(+)NSA-NC900/NF was much lower than that obtained for other cells constructed for comparison, i.e., Pt(−)/(+)NF and NF(−)/(+)NF, whose potential was found to be much higher, i.e., 1.84 V and 1.93 V, respectively, at 10 mA cm−2 (Fig. 4f). We have tested the stability of NiSA-NC-900/NF by comparative analysis before and after OER and the corresponding LSV polarogram is presented in Fig. S7(c)† which verifies the activity and long-term bulk electrolysis. It was found that there was a slight increase in the overpotential at 10 mA cm−2 while a mild change in the catalytic current of NiSA-NC900 after 12 h OER-CA could presumably be due to the partial loss of active structure (Fig. S7(c)†). Moreover, at a constant potential of 1.8 V, an activity study was performed with NiSA-NC-900(−)/(+)Pt for OWS in which the cell delivered a constant current density of ∼16 mA cm−2 for 12 h which proves the long-term performance of the cell during OWS (Fig. S7(d)†). Performance of NiSA-NC-900 has also been compared with that of a range of Ni-SA systems with a focus on Ni-based catalysts (Table S4†). It was found that more structural–geometrical defects led to significant lowering of OER overpotential at 10 mA cm−2 [mV] for Ni–Nx type atom sites especially with S-atom structures, whereas Ni–O or Ni–B exhibited slightly higher overpotentials.
Limited reports of low-valent NiSA electrochemical activity prompted us to compare the OER activity of NiSA-NC900 with that of traditional divalent Ni2+-containing NiSA on a suitable N-doped graphitic carbon or MoS2 support. In the case of low-valent Niδ+ (δ < +2) in NiSA-NC-900, the delocalization of an unpaired electron in the Ni 3dx2−y2 orbital gave a possibility of spontaneous charge transfer from Niδ+. The formation of a Ni–O* species could reduce the energy barrier of the OER where the 3d orbital electronic configuration of Niδ+ plays a major role in activating intermediates. As an example, on anchoring a zero-valent Ni single atom on graphdiyne, a smaller solution resistance (Rs) and charge transfer resistance (Rct) of Ni/GD indicate improved charge-transfer kinetics over the Ni-site interface with lower H2 adsorption resistance.51 Ni–N–C with low-valent Ni sites (+1.37) exhibits faster electrode kinetics as revealed from Tafel plot analysis with much lower slope than NiPc (a Ni(I)-SA) in the low potential region (103 mV dec−1versus 129 mV dec−1).3 Coordinatively unsaturated Ni–N3 containing low-valent Ni-SA exhibits instability for the Ni-coordination structure at a potential of <−0.6 V vs. RHE considering that the working electrode is replaced at regular intervals in H-cell measurements.26 In the case of OER on NiSA and Ni(111) of our electrodes, a major difference arises out of the adsorption energy of oxygenate intermediates as described in Fig. 4(a). Based on a recent analysis of comparative adsorption energies, we are proposing that adsorption energies of oxygenates on Ni(111) are remarkably larger than those on coordinatively unsaturated Ni–N2.57 A comparative analysis of NiSA systems for OER activity is presented in Table S4† which highlights the coordination-unsaturation in limited cases wherein a significant lowering of OP was witnessed as compared to conventional Ni–Nx single-atom sites. Mostly, low-valent and coordinatively unsaturated Ni–Nx single-atom sites are more explored for CO2ER58 compared with OER activity. Therefore, only relevant examples are compared in Table S4† which suggest the significance of coordination unsaturation and heteroatom-assisted enhanced OER efficiency.
2.4 A proposed scheme of NiSA-NC-900 formation
It is proposed, employing experimental support, that the N atom in the composite precursor dictates the coordination of N in Ni–Nx–C structural units including the morphology of single Ni atoms on a carbon skeleton with the possibility of multiple structural units such as Ni–N2, Ni–N3 and Ni–N4 with the coexistence of sites by an increase in the N/C ratio. Therefore, a deep insight into the formation mechanism of NiSA-NC-900 is helpful for understanding the optimized configuration of SACs.2 As described in Scheme 1, the complexation of Ni2+ is the beginning of the sequence which is followed by surface immobilization of Ni2+-1,10-phen complex on ZIF-8 particles which was allowed to form in the same medium before adding Ni2+ and 1,10-phenanthroline. The resulting Ni-phen@ZIF-8-RF composite was subjected to pyrolysis at 700 and 900 °C for 2 h under argon separately. To understand the growth mode of Ni–Nx structural units from NiNP-NC-700, R-space EXAFS spectra (Fig. 1f) of both NiNP-NC-700 and NiSA-NC-900 were analyzed to establish the role of Ni nanoparticles in NiNP-NC-700 to act as a catalyst for the growth of graphitic carbon support as described in Fig. 5. During this growth of graphenic carbon support, the edge is strongly attached to the Ni nanoparticle surface without ready termination of carbon growth. For such successful growth, H-terminated graphitic carbon growth is desired as being more stable than the Ni-terminated edge of graphitic carbon. There is no H2 pressure in our system which is saturated with argon gas; therefore, Ni-terminated edges of graphitic carbon must be stable with the increase of Ni concentration. Therefore, graphitic carbon with a graphenic nature will contain more Ni-terminated edges. A proposed growth of Ni-edged graphene from NiSA-NC-900 can be supported with R-space EXAFS fitting analysis wherein coordination of Ni–N2 was determined with satisfactory fitting parameters as shown in Table S1,† displaying a possible defect as coordination unsaturation and location of pyridinic-N atom coordination. | ||
| Fig. 5 The isolated metal anchoring strategy for the synthesis of Ni–N–C SACs. First, a chelating agent (1,10 phenanthroline) efficiently sequesters metal ions and carbon support. Second, the chelated metal complexes further secure metal atoms via the decomposed residues up to a specific temperature. At higher temperatures subsequently, metal atoms are captured to form M–Nx moieties and integrate into the pyrolyzed carbon layer. | ||
In situ X-ray absorption spectroscopy is a useful technique in the unambiguous identification of forming Ni single atoms from the intermediate structure of Ni active sites from reversible metallic Ni0 species.59 The location of single Ni atoms either in the basal site or in the edge site can be decided based on relevant characterization data including XANE-EXAFS, HRTEM, and surface spectroscopy.59 The EXAFS data were used with FEFF fitting via the Demeter suite of programs to extract quantitative Ni local structure information including types of Ni–N–C coordination by using published Ni–Nx crystal structures to build the FEFF model. The EXAFS spectra in R-space and K-space, as well-fitting results with corresponding fitting parameters, help to propose a route of the formation of Ni–Nx coordination reconstruction from a NiNP-NC-700 structure (Fig. 5). This proposal includes the following steps: (1) formation of graphenic structure from NC around Ni NPs at 700 °C, (2) graphenic framework formation induces Ni NPs with surface N functions to set in a Ni–Nx local environment, (3) possible creation of defects by the loss of N–C and resulting selective N–Nx–C structural unit with sp2 pyridinic-N as determined from the WT spectral maximum intensity from the R-space EXAFS spectra (Fig. 1h). Therefore, a local coordination reconstruction M–Nx unit and integration into the pyrolyzed carbon layer form the basis of actual atomic sites with uniform atom-scale dispersity which in turn leads to an effective OER electrode. A strong D band in the Raman spectrum of NiSA-NC-900 indicates a carbon structure that is extremely disordered and has a significant number of defects. An enrichment of defective graphene in coordinately unsaturated Ni–N2 structural units, as indicated by Raman spectroscopy, can be attributed to the presence of N dopants in the carbon structure and a single Ni atom implanted in the sample (Fig. S9†).
3. Conclusion
In summary, a Ni2+-phen-ZIF-8-RFpolymer composite was subjected to pyrolysis at 700 °C and 900 °C for 2 h at a constant argon flow which resulted in NiNP-NC-700 and NiSA-NC-900 respectively. This result effectively established that a temperature elevation window from 700 to 900 °C and conducting the pyrolysis for 2 h at 900 °C drive a coordinative reconstruction to form an unsaturated single-Ni-atom structure, NiSA-NC-900, with low valency on a polymer-derived NC matrix with a possible Ni–N2–C configuration at the Ni center. XANE-EXAFS analysis including WT-contour spectra and Ni–Nx coordination configuration determination by fitting analysis supports the proposed coordination environment of the central Ni in the resulting single-Ni-atom structure. The soft-X-ray L-edge spectra of NiSA-NC-900 along with HAADF-STEM analysis including elemental mapping suggest the location of the Ni-coordination structure. We have proposed a possible sequence of changes within the temperature window of 700 to 900 °C that resulted in reconstruction of the coordination environment of NiSA-NC-900 from a Ni NP-driven carbon structure development to configure Ni-SA in NiSA-NC-900. This includes defect creation and achieving low valency of Ni-SA in NiSA-NC-900 (Niδ+, δ < 2). We have also found the selective formation of Ni–Nx (pyridinic) on pyridinic N which is due to the N-loss defects at around 900 °C which resulted in the presence of no N (pyrrolic) as evident from the N 1s XPS spectral analysis. The prepared NiSA-NC-900, as electrode ink, exhibits excellent electrochemical OER activity. For the OER, a performance comparison of NiSA-NC-900/NF and NiNP-NC-700/NF electrodes reveals that the former has greater activity, by offering a better overpotential of 362 mV at 10 mA cm−2 in comparison to NiNP-NC-700/NF which showed an overpotential of 375 mV at the same current with a loading of 3.3 mg. The improved OER activity of NiSA-NC-900/NF can be correlated to the better electrode kinetics and charge transfer resistance across the electrode–electrolyte junction which can be attributed to a lower Tafel slope of 39.68 mV dec−1 obtained from the Tafel plot. Furthermore, a CA analysis for long-term durability of NiSA-NC-900/NF under OER conditions verified that at a constant applied potential of 1.615 V (vs. RHE), an increase in current for 0.6 h was observed with a fair stability of current density for 12 h. We have proposed a sequence of structural and electronic changes that results in a reconstruction of the coordination environment of NiSA in NiSA-NC-900/NF which is responsible for the improved OER activity of NiSA-NC-900/NF as compared to NiNP-NC-700/NF. This work provides a new insight into the effect of elevated temperature for the reconstruction of coordination configuration of low-valent NiSA at the coordination unsaturated Ni–N–C sites, which can be expanded to several electrochemical processes. These results enhance the scope of using low-valent NiSAs for an insightful fundamental understanding of OER including investigating the chemical structure evolution of NiSA to outperform the minimum theoretical overpotential.Conflicts of interest
Authors have no conflict of interest to declare.Acknowledgements
SD wishes to acknowledge research funding support by the Science & Engineering Research Board (SERB), Department of Science & Technology, Government of India for support through core research grant number CRG/2023/000044 (2024–2027). SD also wishes to thank Department of Biotechnology, Ministry of Science & Technology, Government of India for a DBT Ramalingaswami Re-entry Fellowship grant number BT/RLF/Re-entry/41/2017 (2019–2024) and DBT-Energy Bioscience-Biofuels research grant number BT/PR38594/PBD/26/795/2020 (2023–2026). SD thanks the UGC-DAE Consortium for Scientific Research for a project under Collaborative Research Scheme (CRS) project grant number CRS/2022-23/01/680 (2023–2026) and Raja Rammana Centre for Advance Technology, Indore Beam Line 3 and 9 for soft and hard X-ray absorption spectroscopy. The authors would like to acknowledge NSRRC, Taiwan, Dr Chan, Ting-Shan, and Dr Pao, Chih-Wen for providing beamtimes and facilitating the SWLS-EXAFS experiments.References
- Y. Luo, S. Zhang, H. Pan, S. Xiao, Z. Guo, L. Tang, U. Khan, B. F. Ding, M. Li, Z. Cai, Y. Zhao, W. Lv, Q. Feng, X. Zou, J. Lin, H. M. Cheng and B. Liu, ACS Nano, 2020, 14, 767–776 CrossRef CAS PubMed
.
- H. Wang, Y. Li, M. Wang, S. Chen, M. Yao, J. Chen, X. Liao, Y. Zhang, X. Lu, E. Matios, J. Luo, W. Zhang, Z. Feng, J. Dong, Y. Liu and W. Li, Proc. Natl. Acad. Sci. U. S. A., 2023, 120, e2219043120 CrossRef CAS PubMed
- Y. Zhou, Q. Zhou, H. Liu, W. Xu, Z. Wang, S. Qiao, H. Ding, D. Chen, J. Zhu, Z. Qi, X. Wu, Q. He and L. Song, Nat. Commun., 2023, 14, 3776 CrossRef PubMed
- W. Hua, H. Sun, L. Lin, Q. Mu, B. Yang, Y. Su, H. Wu, F. Lyu, J. Zhong, Z. Deng and Y. Peng, Chem. Eng. J., 2022, 446, 137296 CrossRef CAS
- Z. Lu, J. Wang, W. Feng, X. Yin, X. Feng, S. Zhao, C. Li, R. Wang, Q. A. Huang and Y. Zhao, Adv. Mater., 2023, 35, e2211461 CrossRef PubMed
- Y. Li, N. M. Adli, W. Shan, M. Wang, M. J. Zachman, S. Hwang, H. Tabassum, S. Karakalos, Z. Feng, G. Wang, Y. C. Li and G. Wu, Energy Environ. Sci., 2022, 15, 2108–2119 RSC
- Y. He, Y. Li, J. Zhang, S. Wang, D. Huang, G. Yang, X. Yi, H. Lin, X. Han, W. Hu, Y. Deng and J. Ye, Nano Energy, 2020, 77, 105010 CrossRef CAS
- T. Möller, W. Ju, A. Bagger, X. Wang, F. Luo, T. N. Thanh, A. S. Varela, J. Rossmeisl and P. Strasser, Energy Environ. Sci., 2019, 12, 640–647 RSC
- L. Zhu, Z. Liang, H. Li, Q. Xu, D. Jiang, H. Du, C. Zhu, H. Li, Z. Lu and Y. Yuan, Small, 2023, 19, e2301017 CrossRef PubMed
- K. Wang, Z. Lu, J. Lei, Z. Liu, Y. Li and Y. Cao, ACS Nano, 2022, 16, 11944–11956 CrossRef CAS PubMed
- H. Liang, G. Chen, D. Liu, Z. Li, S. Hui, J. Yun, L. Zhang and H. Wu, Adv. Funct. Mater., 2022, 33, 2212604 CrossRef
- R. Patil, T. Dey, L. Kang, S. Liu, S. C. Jun and S. Dutta, Small, 2023, 19, e2301675 CrossRef PubMed
- D. L. Meng, M. D. Zhang, D. H. Si, M. J. Mao, Y. Hou, Y. B. Huang and R. Cao, Angew. Chem., Int. Ed., 2021, 60, 25485–25492 CrossRef CAS PubMed
- S. Liang, Q. Jiang, Q. Wang and Y. Liu, Adv. Energy Mater., 2021, 11, 2101477 CrossRef CAS
- R. Daiyan, X. Zhu, Z. Tong, L. Gong, A. Razmjou, R.-S. Liu, Z. Xia, X. Lu, L. Dai and R. Amal, Nano Energy, 2020, 78, 105213 CrossRef CAS
- C. Jia, S. Li, Y. Zhao, R. K. Hocking, W. Ren, X. Chen, Z. Su, W. Yang, Y. Wang, S. Zheng, F. Pan and C. Zhao, Adv. Funct. Mater., 2021, 31, 2107072 CrossRef CAS
- M. Ha, D. Y. Kim, M. Umer, V. Gladkikh, C. W. Myung and K. S. Kim, Energy Environ. Sci., 2021, 14, 3455–3468 RSC
- J. Leverett, R. Daiyan, L. Gong, K. Iputera, Z. Tong, J. Qu, Z. Ma, Q. Zhang, S. Cheong, J. Cairney, R. S. Liu, X. Lu, Z. Xia, L. Dai and R. Amal, ACS Nano, 2021, 15, 12006–12018 CrossRef CAS PubMed
- X. Fu, P. Zhang, T. Sun, L. Xu, L. Gong, B. Chen, Q. Xu, T. Zheng, Z. Yu, X. Chen, S. Zhang, M. Hou, H. Wang, K. Wang and J. Jiang, Small, 2022, 18, e2107997 CrossRef PubMed
- R. Boppella, M. Austeria, P. Y. Kim, E. Kim, I. Song, Y. Eom, D. P. Kumar, M. Balamurugan, E. Sim, D. H. Kim and T. K. Kim, Adv. Funct. Mater., 2022, 32, 2202351 CrossRef CAS
- C. F. Wen, F. Mao, Y. Liu, X. Y. Zhang, H. Q. Fu, L. R. Zheng, P. F. Liu and H. G. Yang, ACS Catal., 2019, 10, 1086–1093 CrossRef
- J. G. Chen, Joule, 2018, 2, 587–589 CrossRef CAS
- Q. Qu, S. Ji, Y. Chen, D. Wang and Y. Li, Chem. Sci., 2021, 12, 4201–4215 RSC
- D. M. Koshy, S. Chen, D. U. Lee, M. B. Stevens, A. M. Abdellah, S. M. Dull, G. Chen, D. Nordlund, A. Gallo, C. Hahn, D. C. Higgins, Z. Bao and T. F. Jaramillo, Angew. Chem., Int. Ed., 2020, 59, 4043–4050 CrossRef CAS PubMed
- Y. Li, Z. S. Wu, P. Lu, X. Wang, W. Liu, Z. Liu, J. Ma, W. Ren, Z. Jiang and X. Bao, Adv. Sci., 2020, 7, 1903089 CrossRef CAS PubMed
- H. Kim, D. Shin, W. Yang, D. H. Won, H. S. Oh, M. W. Chung, D. Jeong, S. H. Kim, K. H. Chae, J. Y. Ryu, J. Lee, S. J. Cho, J. Seo, H. Kim and C. H. Choi, J. Am. Chem. Soc., 2021, 143, 925–933 CrossRef CAS PubMed
- M. S. A. Sher Shah, G. Y. Jang, K. Zhang and J. H. Park, EcoEnergy, 2023, 1, 344–374 CrossRef
- H. Liu, J. Li, J. Arbiol, B. Yang and P. Tang, EcoEnergy, 2023, 1, 154–185 CrossRef
- X. Wang, H. Ding, W. Luo, Y. Yu, Q. Chen, B. Luo, M. Xie and X. Guo, EcoEnergy, 2023, 1, 448–459 CrossRef
- J. Lai, B. Huang, Y. Chao, X. Chen and S. Guo, Adv. Mater., 2019, 31, 1805541 CrossRef PubMed
- Y. Shi, D. Zhang, H. Miao, T. Zhan and J. Lai, Electrochem. Sci. Adv., 2022, 2, e2100052 CrossRef CAS
- Y. Li, Z.-S. Wu, P. Lu, X. Wang, W. Liu, Z. Liu, J. Ma, W. Ren, Z. Jiang and X. Bao, Adv. Sci., 2020, 7, 1903089 CrossRef CAS PubMed
- W. Wan, Y. Zhao, S. Wei, C. A. Triana, J. Li, A. Arcifa, C. S. Allen, R. Cao and G. R. Patzke, Nat. Commun., 2021, 12, 5589 CrossRef CAS PubMed
- S. Iqbal, B. Safdar, I. Hussain, K. Zhang and C. Chatzichristodoulou, Adv. Energy Mater., 2023, 13, 2203913 CrossRef CAS
- X. Li, L. Liu, X. Ren, J. Gao, Y. Huang and B. Liu, Sci. Adv., 2020, 6, eabb6833 CrossRef CAS PubMed
- M. H. Modi, R. K. Gupta, S. R. Kane, V. Prasad, C. K. Garg, P. Yadav, V. K. Raghuvanshi, A. Singh and M. Sinha, AIP Conf. Proc., 2019, 2054, 060022 CrossRef
- M. H. Modi, R. Gupta, S. Gupta, P. K. Yadav, C. Kant, S. Lal, V. K. Raghuvanshi and S. R. Kane, Rev. Sci. Instrum., 2024, 95, 023904 CrossRef CAS PubMed
- Y. Shiraishi, M. Matsumoto, S. Ichikawa, S. Tanaka and T. Hirai, J. Am. Chem. Soc., 2021, 143, 12590–12599 CrossRef CAS PubMed
- W. Qian, F. Sun, Y. Xu, L. Qiu, C. Liu, S. Wang and F. Yan, Energy Environ. Sci., 2014, 7, 379–386 RSC
- J. Song, X. Lei, J. Mu, J. Li, X. Song, L. Yan and Y. Ding, Small, 2023, 19, e2304423 CrossRef PubMed
- X. Zhang, Y. Wang, M. Gu, M. Wang, Z. Zhang, W. Pan, Z. Jiang, H. Zheng, M. Lucero, H. Wang, G. E. Sterbinsky, Q. Ma, Y.-G. Wang, Z. Feng, J. Li, H. Dai and Y. Liang, Nat. Energy, 2020, 5, 684–692 CrossRef CAS
- X. Y. Dong, Y. N. Si, Q. Y. Wang, S. Wang and S. Q. Zang, Adv. Mater., 2021, 33, e2101568 CrossRef PubMed
- W. Ren, X. Tan, W. Yang, C. Jia, S. Xu, K. Wang, S. C. Smith and C. Zhao, Angew. Chem., Int. Ed., 2019, 58, 6972–6976 CrossRef CAS PubMed
- H. B. Yang, S.-F. Hung, S. Liu, K. Yuan, S. Miao, L. Zhang, X. Huang, H.-Y. Wang, W. Cai, R. Chen, J. Gao, X. Yang, W. Chen, Y. Huang, H. M. Chen, C. M. Li, T. Zhang and B. Liu, Nat. Energy, 2018, 3, 140–147 CrossRef CAS
- R. Zhao, Y. Wang, G. Ji, J. Zhong, F. Zhang, M. Chen, S. Tong, P. Wang, Z. Wu, B. Han and Z. Liu, Adv. Mater., 2023, 35, e2205262 CrossRef PubMed
- L. Jiao, W. Yang, G. Wan, R. Zhang, X. Zheng, H. Zhou, S. H. Yu and H. L. Jiang, Angew. Chem., Int. Ed., 2020, 59, 20589–20595 CrossRef CAS PubMed
- D. Cabaret, A. Bordage, A. Juhin, M. Arfaoui and E. Gaudry, Phys. Chem. Chem. Phys., 2010, 12, 5619–5633 RSC
- Y. Zhao, Y. Guo, X. F. Lu, D. Luan, X. Gu and X. W. D. Lou, Adv. Mater., 2022, 34, e2203442 CrossRef PubMed
- Y. Lu, H. Wang, P. Yu, Y. Yuan, R. Shahbazian-Yassar, Y. Sheng, S. Wu, W. Tu, G. Liu, M. Kraft and R. Xu, Nano Energy, 2020, 77, 105158 CrossRef CAS
- H. Wang, C. Y. Ralston, D. S. Patil, R. M. Jones, W. Gu, M. Verhagen, M. Adams, P. Ge, C. Riordan, C. A. Marganian, P. Mascharak, J. Kovacs, C. G. Miller, T. J. Collins, S. Brooker, P. D. Croucher, K. Wang, E. I. Stiefel and S. P. Cramer, J. Am. Chem. Soc., 2000, 122, 10544–10552 CrossRef CAS
- Y. Xue, B. Huang, Y. Yi, Y. Guo, Z. Zuo, Y. Li, Z. Jia, H. Liu and Y. Li, Nat. Commun., 2018, 9, 1460 CrossRef PubMed
- X. Liu, J. Meng, J. Zhu, M. Huang, B. Wen, R. Guo and L. Mai, Adv. Mater., 2021, 33, e2007344 CrossRef PubMed
- Z. N. Zahran, E. A. Mohamed, Y. Tsubonouchi, M. Ishizaki, T. Togashi, M. Kurihara, K. Saito, T. Yui and M. Yagi, ACS Appl. Energy Mater., 2021, 4, 1410–1420 CrossRef CAS
- İ. B. Pehlivan, M. A. Arvizu, Z. Qiu, G. A. Niklasson and T. Edvinsson, J. Phys. Chem. C, 2019, 123, 23890–23897 CrossRef
- A. Kundu, M. K. Adak, Y. Kumar and B. Chakraborty, Inorg. Chem., 2022, 61, 4995–5009 CrossRef CAS PubMed
- C. C. McCrory, S. Jung, I. M. Ferrer, S. M. Chatman, J. C. Peters and T. F. Jaramillo, J. Am. Chem. Soc., 2015, 137, 4347–4357 CrossRef CAS PubMed
- X. Zhang, S. Feng, J. Yu, R. Shi, Z. Ma, Z. Yang and L. Yang, Energy Fuels, 2022, 36, 13159–13167 CrossRef CAS
- C. Jia, S. Li, Y. Zhao, R. K. Hocking, W. Ren, X. Chen, Z. Su, W. Yang, Y. Wang, S. Zheng, F. Pan and C. Zhao, Adv. Funct. Mater., 2021, 31, 2107072 CrossRef CAS
- B. Pattengale, Y. Huang, X. Yan, S. Yang, S. Younan, W. Hu, Z. Li, S. Lee, X. Pan, J. Gu and J. Huang, Nat. Commun., 2020, 11, 4114 CrossRef CAS PubMed
Footnote |
| † Electronic supplementary information (ESI) available. See DOI: https://doi.org/10.1039/d4nr00337c |
| This journal is © The Royal Society of Chemistry 2024 |