 Open Access Article
Orientation and stretching of supracolloidal chains of diblock copolymer micelles by spin-coating process†
Jaemin
Kim
 ,
Kyunghyeon
Lee
 ,
Sangyoon
Kim
 and
Byeong-Hyeok
Sohn
 *
*
Department of Chemistry, Seoul National University, Seoul 08826, Republic of Korea. E-mail: bhsohn@snu.ac.kr; Fax: +82-2-889-1568; Tel: +82-2-883-2154
First published on 13th May 2024
Abstract
Supracolloidal chains consisting of nano- or micro-scale particles exhibit anisotropic properties not observed in individual particles. The orientation of the chains is necessary to manifest such characteristics on a macroscopic scale. In this study, we demonstrate the orientation of supracolloidal chains composed of nano-scale micelles of a diblock copolymer through spin-coating. We observed separate chains coated on a substrate with electron microscopy, and analyzed the orientation and stretching of the chains quantitatively with image analysis software. In drop-casting, the chains were coated randomly with no preferred orientation, and the degree of stretching exhibited an intrinsic semi-flexible nature. In contrast, spin-coated chains were aligned in the radial direction, and the apparent persistence length of the chain increased, confirming the stretching of the chain quantitatively. Furthermore, by incorporating fluorophores into supracolloidal chains and confirming the oriented chains with confocal fluorescence microscopy, it is demonstrated that oriented chains can be utilized as a template to align functional materials.
1. Introduction
To capitalize on the anisotropic properties of 1D nanomaterials with a high aspect ratio at the macroscopic scale, it is essential to orient the nanomaterials in a specific direction.1 For example, orienting nanowires or carbon nanotubes with anisotropic conductivity enables the fabrication of transparent and stretchable electrodes exhibiting high electrical conductivity in the aligned direction.2–5 In addition, cellulose nanofilaments were aligned to fabricate a film with enhanced mechanical properties and anisotropic thermal conductivity.6 To align linear nanomaterials, common methods involve external-field-assisted assembly, drawing, shear coating, and bubble blowing, which orient the materials through external forces.1,2,6Nano- or micro-scale colloidal particles can be linearly assembled into 1D chains, inducing anisotropic properties not observed in individual particles.7–9 Colloidal particles can form chains through directional bonding facilitated by charges and ligands.10 In particular, particles with patches on their surfaces are assembled into linear chains through bonding between these patches.11,12 For example, gold nanorods tethered with polymeric patches at two ends13 and triblock copolymer micelles with segregated patches14,15 were assembled into a linear chain through bonding between the patches. Our previous studies reported the generation of patchy micelles from diblock copolymers, followed by the assembly of supracolloidal chains through the fusion of these patches.16–19
By aligning these colloidal chains, macroscopic induction of anisotropic properties can be achieved, allowing for the tuning of material characteristics, as observed in other 1D nanomaterials.9 Notably, various metal, inorganic, and polymeric particles can be chosen to form the colloid chain, thereby diversifying macroscopic properties through orientation.9 Supracolloidal chains of patchy micelles reported by our group can be functionalized by incorporating nanoparticles,20 quantum dots,21 and fluorophore22 into the core of the micelles, which serves as the constituent unit of the chain. However, research on aligning chains composed of colloid particles in a specific direction is limited. A study aligning chains consisting of magnetic nanoparticles using a combination of magnetic fields and shear has been reported.23
Conventional polymer chains consisting of small molecules, termed monomers, can also be aligned using drawing, spin-coating, shear-coating, etc., resulting in enhanced elastic modulus, electrical conductivity, and thermal conductivity in the oriented direction.24–26 Furthermore, polymer chain molecules can be stretched under external forces. The analysis of chain stretching is limited, and reports have been made for very high molecular weight polymer chains such as DNA, comb polymers, and bottle-brush polymers, which exhibit stretched conformations under shear or extensional flow.27–29
In this study, we analyzed the orientation and stretching of supracolloidal chains of patchy micelles of diblock copolymers. We observed separate supracolloidal chains coated differently by drop-casting and spin-coating with an electron microscope and quantitatively analyzed the orientation and stretching of chains with image analysis software. In drop-casting, the chains were coated randomly with no preferred orientation, and the degree of stretching exhibited an intrinsic semi-flexible nature. In contrast, spin-coated chains were aligned in the radial direction, and the apparent persistence length of the chain increased, confirming the stretching of the chain quantitatively.
2. Experimental section
2.1. Materials
PS-b-P4VP (MPSn = 51 kg mol−1, MP4VPn = 18 kg mol−1, PDI = 1.15) was obtained from Polymer Source. 1,4-Dibromobutane and Sulforhodamine 101 were purchased from Sigma-Aldrich. All the chemicals were used as received.2.2. Preparation of patchy micelles and supracolloidal chains
We followed the method described in our publications16–19 to prepare supracolloidal chains from PS-b-P4VP micelles. The PS-b-P4VP copolymer (10 mg) was first dissolved in chloroform, an effective solvent for each block. Subsequently, we added toluene (1.0 g), a preferential solvent for the PS block. The rate of toluene addition was 10 mL h−1. The solution was evaporated at 50 °C to remove chloroform, and toluene was added to supplement the evaporated amount, yielding a 1.0 wt% PS-b-P4VP micellar solution. The P4VP core was crosslinked by adding 1,4-dibromobutane (2.7 mg, 0.5 molar ratio to 4VP) to the solution and agitating at 50 °C for 48 h. By adding DMF to a 1.0 wt% core-crosslinked micellar solution, a 0.05 wt% (or 0.1 wt%) solution of patchy micelles is obtained. We added DI water/DMF mixture (25![[thin space (1/6-em)]](https://www.rsc.org/images/entities/char_2009.gif) :
:![[thin space (1/6-em)]](https://www.rsc.org/images/entities/char_2009.gif) 75 w/w) to a solution of patchy micelles to assemble them into supracolloidal chains, resulting in a final solution that included 12.5 wt% water. The solution was left without agitating at 30 °C for 12 h (6 h). The supracolloidal chain solution was diluted with DI water/DMF mixture (25
75 w/w) to a solution of patchy micelles to assemble them into supracolloidal chains, resulting in a final solution that included 12.5 wt% water. The solution was left without agitating at 30 °C for 12 h (6 h). The supracolloidal chain solution was diluted with DI water/DMF mixture (25![[thin space (1/6-em)]](https://www.rsc.org/images/entities/char_2009.gif) :
:![[thin space (1/6-em)]](https://www.rsc.org/images/entities/char_2009.gif) 75 w/w), resulting in concentrations of 0.005 wt% (or 0.001 wt%) and for drop-casting and 0.025 wt% (or 0.0125 wt%) for spin-coating, respectively. The concentrations in the parentheses represent the conditions used to prepare supracolloidal chains for fluorescent imaging.
75 w/w), resulting in concentrations of 0.005 wt% (or 0.001 wt%) and for drop-casting and 0.025 wt% (or 0.0125 wt%) for spin-coating, respectively. The concentrations in the parentheses represent the conditions used to prepare supracolloidal chains for fluorescent imaging.
2.3. Coating of supracolloidal chains
A cover glass (18 mm × 18 mm) was treated with a piranha solution (70![[thin space (1/6-em)]](https://www.rsc.org/images/entities/char_2009.gif) :
:![[thin space (1/6-em)]](https://www.rsc.org/images/entities/char_2009.gif) 30 v/v concentrated H2SO4 and 30% H2O2), followed by rinsing with a copious amount of deionized water and blow-drying with N2. The solution of supracolloidal chains (50 μL) was dropped onto a clean cover glass for drop-cast chains and left to dry overnight. For spin-coated chains, the solution was placed on a clean cover glass and spun at 3000 rpm for 60 s. Si wafer substrates with various water-contact angles were prepared by cleaning with acetone and isopropanol (35°) or by depositing phenylethyltrichlorosilane (70°) or octadecyltrichlorosilane (110°) on a piranha-treated Si wafer from its 0.1% (v/v) toluene solution. To synthesize Au and Pt nanoparticles by employing supracolloidal chains as a template, the substrate spin-coated with the chains (4500 rpm, 60 s) was immersed in a 9 mM aqueous solution of HAuCl4 or Na2PtCl6 containing 0.1% HCl for 3 h. The polymeric parts were then removed by plasma treatment (0.038 Torr O2, 100 W, 5 min).
30 v/v concentrated H2SO4 and 30% H2O2), followed by rinsing with a copious amount of deionized water and blow-drying with N2. The solution of supracolloidal chains (50 μL) was dropped onto a clean cover glass for drop-cast chains and left to dry overnight. For spin-coated chains, the solution was placed on a clean cover glass and spun at 3000 rpm for 60 s. Si wafer substrates with various water-contact angles were prepared by cleaning with acetone and isopropanol (35°) or by depositing phenylethyltrichlorosilane (70°) or octadecyltrichlorosilane (110°) on a piranha-treated Si wafer from its 0.1% (v/v) toluene solution. To synthesize Au and Pt nanoparticles by employing supracolloidal chains as a template, the substrate spin-coated with the chains (4500 rpm, 60 s) was immersed in a 9 mM aqueous solution of HAuCl4 or Na2PtCl6 containing 0.1% HCl for 3 h. The polymeric parts were then removed by plasma treatment (0.038 Torr O2, 100 W, 5 min).
2.4. Characterizations
A scanning electron microscope (S-4300, Hitachi) and a transmission electron microscope (H-7600, Hitachi) were used to visualize the micelles and supracolloidal chains. Pt was coated on every SEM sample. TEM samples were obtained by depositing a solution of micelles or chains on a TEM grid with immediate blotting by a filter paper and drying at room temperature. When necessary, RuO4 vapor was applied to TEM samples to stain the PS block. Fluorescent images are taken using a confocal fluorescence microscope (SP8 X, Leica) with 561 nm excitation. To visualize supracolloidal chains, the cover glass coated with supracolloidal chains was immersed in a 1.0 M aqueous solution of Sulforhodamine 101 for 1 h.2.5. Analysis of the size and orientation of supracolloidal chains
We obtained binarized images of separate supracolloidal chains from SEM images with ImageJ software (NIH, USA). We then skeletonized the images and applied Persistence software, a freely available Matlab script,30 to measure contour length (L), end-to-end distance (Re), and persistence length (Lp). The end-to-end vector angle was calculated from the contour coordinates (x, y) of the two ends of the chain. The orientation angles of pixels comprising a binarized chain were marked as color using OrientationJ,31 a plugin for ImageJ. The angle distribution was extracted with a Gaussian window of 2 pixels and a minimum energy threshold of 20%.3. Results and discussion
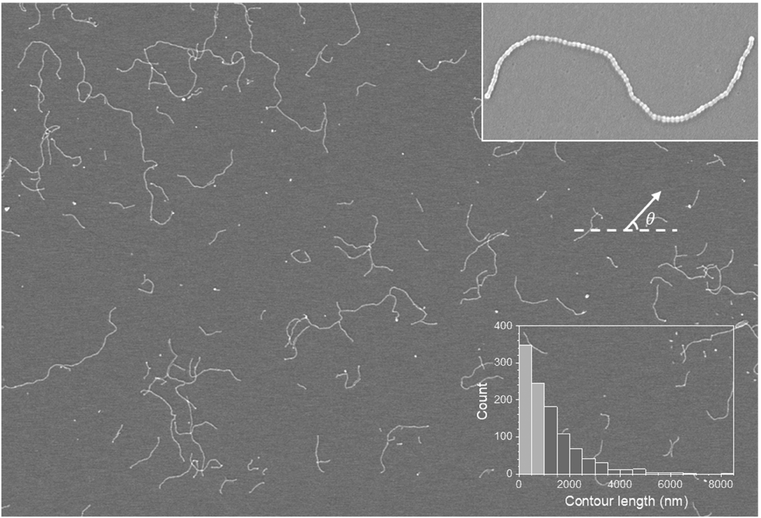
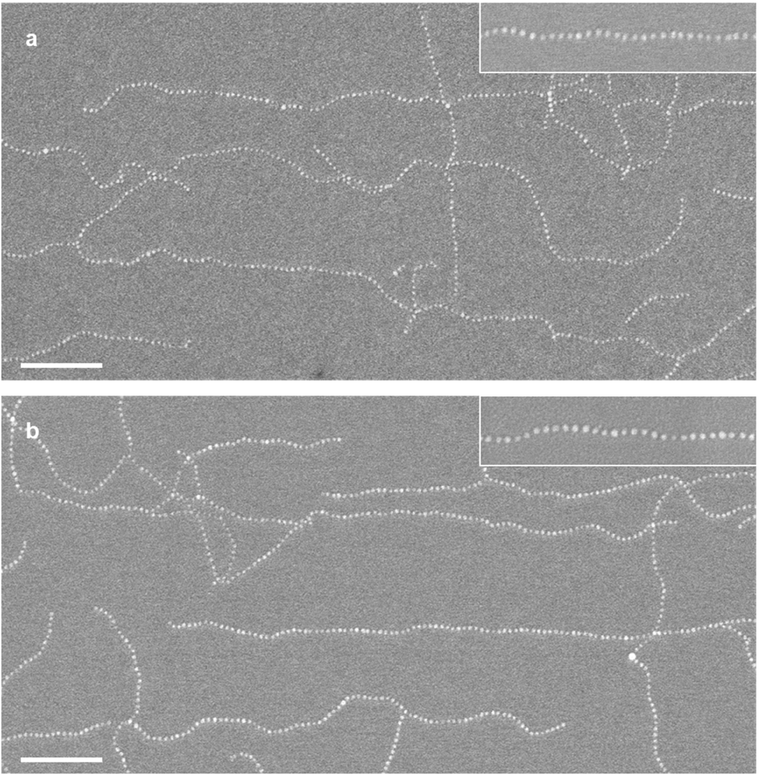
As demonstrated in our previous publications,16,18,19 we produced supracolloidal chains from PS-b-P4VP micelles, and the process is briefly summarized below. PS-b-P4VP diblock copolymers assemble into spherical micelles consisting of a PS corona and a P4VP core in toluene, a selective solvent for PS (Fig. S1a†). After cross-linking the P4VP core, DMF, a core-favorable solvent, was added to a toluene solution of PS-b-P4VP micelles, resulting in a dumbell-like micelle with two patches (Fig. S1b†). The formation of patches derives from the segregation of the PS corona due to the preferential swelling of the cross-linked P4VP core by DMF. The supracolloidal chain was assembled by fusing two hydrophobic PS patches of neighboring micelles after adding water to a solution of the patchy micelles (Fig. S1c and d†).Supracolloidal chains were drop-cast onto a substrate by depositing a solution of supracolloidal chains and allowing the solvent to evaporate and visualized by SEM. Fig. 1 is a large-area SEM image showing supracolloidal chains of various lengths where both separate and overlapping chains are found. In an enlarged image of a separate chain (Fig. 1 inset), a chain looks like a string of beads, which consists of micelles connected by beads corresponding to fused patches resulting from the merging of neighboring micelles. The diameter of the bead is ∼40 nm, yielding an identical value in the TEM image (Fig. S1d†). The degree of polymerization, or the number of merged patchy micelles, was determined as 81 by counting the number of beads. As the degree of polymerization is proportional to contour length (L), which is the fully extended length of a chain, we measured contour length instead of counting the number of beads in a chain. For example, the contour length of the chain in Fig. 1 inset is 2800 nm.
Using image analysis software, we measured the contour lengths of 944 chains, which include more chains than those shown in the SEM image, and plotted a histogram in Fig. 1. We note that overlapping chains are enlarged, and an enlarged image of separate chains are identified for contour length analysis. The histogram shows a significant decrease in the number of chains as the contour length increases, which suggests that the distribution of contour length, or the degree of polymerization, follows the most probable distribution as the polymerization of the supracolloidal chain is explained by a step-growth mechanism.13,19 It is noted that the average contour length is 1260 nm, and only 15 chains have a contour length exceeding 5000 nm, making them poorly visible in the histogram.
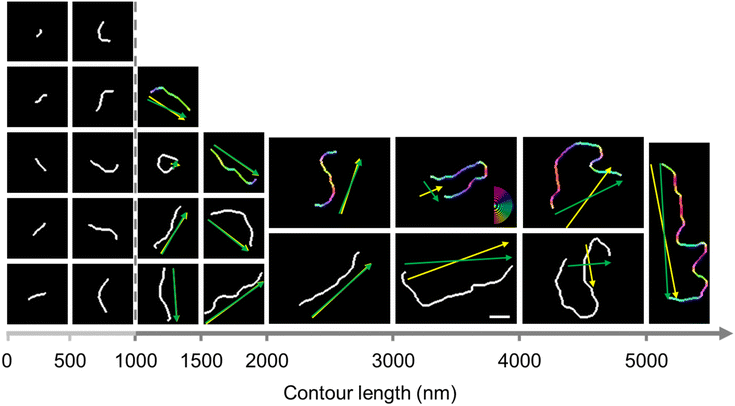
Since the chains shown in Fig. 1 appear randomly oriented with no discernible orientation, we used image analysis software to assess the chain orientation quantitatively. To apply image analysis software, we binarized 944 images of separate chains. We arranged representative binarized chain images in increasing order of contour length in Fig. 2. The number of short chains with a low degree of polymerization is most prominent in the step-growth mechanism (Fig. 1 histogram).
The orientation of 406 semi-flexible chains was analyzed, excluding chains with a contour length under 1000 nm, approximately two times the persistence length (Lp) of the chains. We will explain the persistence length of the chains in Fig. 7. The end-to-end vector pointing to the right was selected as the orientation for the separate chain and marked by the green arrow in Fig. 2. We measured the angle between the end-to-end vector and the horizontal reference line, which is defined as the end-to-end vector angle, for 406 chains. Due to the selection of the end-to-end vector pointing in the right direction, the end-to-end vector angle is in the range of −90 to 90 degrees. We represented the number of chains at 20-degree intervals of the end-to-end vector angle in a histogram shown in Fig. 3a. There was no significant difference in the number of chains for each angle interval, indicating that the supracolloidal chains were randomly oriented.
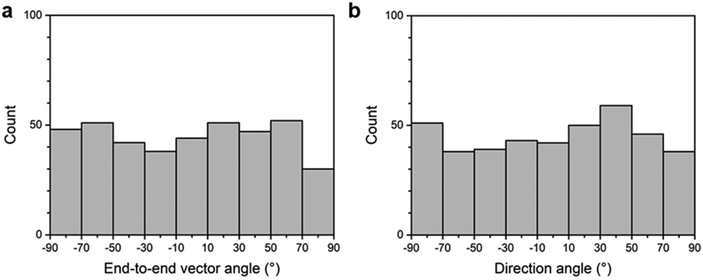 | ||
| Fig. 3 Histograms of the orientation angles of supracolloidal chains drop-cast on a substrate: (a) end-to-end vector angle; (b) direction angle. | ||
The end-to-end vector angle has a limit when it comes to explaining the orientation of strongly curved or bent semi-flexible supracolloidal chains. For example, in Fig. 2, the first chain within the 3000–4000 nm range exhibits a bent-U shape, and the direction of the two linear portions, which comprise a significant part of the chain, shows a substantial difference from the end-to-end vector marked by the green arrow.
OrientationJ software was used to analyze the orientation of highly curved and bent chains appropriately. As OrientationJ can display the orientation of the pixels, the orientation angle of pixels comprising each chain with respect to the horizontal reference line was marked by orientation color.31–33 The chain was marked by orientation color based on the angle of pixels in the range of −90° to 90° following the color code given in Fig. 2. For instance, the part of the chain with a vertical (+90°) angle appears in red, while the other part with a horizontal (0°) angle is in blue. We applied the orientation color to each of the 406 chains, and the first chain in each range was color-coded representatively. The direction angle (θ) of each chain with respect to the horizontal reference line was calculated using the standard atan2(y, x) function, θ = atan2(∑sin(2θi), ∑cos(2θi))/2, where the distribution of orientation angles (θi) was provided by OrientationJ.32–34 The atan2(y, x) function, a variation of the arctangent function, provides the angle θ between the positive x-axis and the point given by the coordinate (x, y) corresponding to (∑cos(2θi), ∑sin(2θi)) in the case of a chain having the distribution of orientation angles (θi). The chain direction, indicated by the direction angle, was marked by a yellow arrow for each chain in Fig. 2. For the bent-U shape chain shown earlier as an example, the yellow arrow representing the chain direction is nearly perpendicular to the green arrow representing the end-to-end vector but well reflects the direction of the two linear portions comprising a significant part of the chain. In Fig. 2, the chain direction marked for each chain exhibited a noticeable difference from the end-to-end vector for bent chains. However, it almost overlapped for extended chains and was indistinguishable from the end-to-end vector.
We analyzed the direction angle of 409 chains, for which the end-to-end vector angle was measured, and represented the number of chains at 20-degree intervals of the direction angle in a histogram, shown in Fig. 3b. There is no meaningful difference in the population of chains depending on the direction range, indicating that supracolloidal chains are randomly oriented, which is consistent with the findings from the end-to-end vector angle analysis (Fig. 3a). In other words, drop-cast chains still show random orientation when analyzed by direction angle, which adequately explains the orientation of highly curved or bent chains.
The degree of alignment can be characterized by the 2D order parameter S = 〈2![[thin space (1/6-em)]](https://www.rsc.org/images/entities/char_2009.gif) cos2
cos2![[thin space (1/6-em)]](https://www.rsc.org/images/entities/char_2009.gif) αn − 1〉, where αn = θn − 〈θn〉. A value of S = 0 indicates randomly oriented chains, while S = 1 indicates perfectly aligned chains in the same direction. From the end-to-end vector angle and direction angle of 409 chains, a value of S = 0.02 and 0.08 was calculated, respectively. With S values approaching 0, we confirmed the random orientation of the chain quantitatively.29,32,35
αn − 1〉, where αn = θn − 〈θn〉. A value of S = 0 indicates randomly oriented chains, while S = 1 indicates perfectly aligned chains in the same direction. From the end-to-end vector angle and direction angle of 409 chains, a value of S = 0.02 and 0.08 was calculated, respectively. With S values approaching 0, we confirmed the random orientation of the chain quantitatively.29,32,35
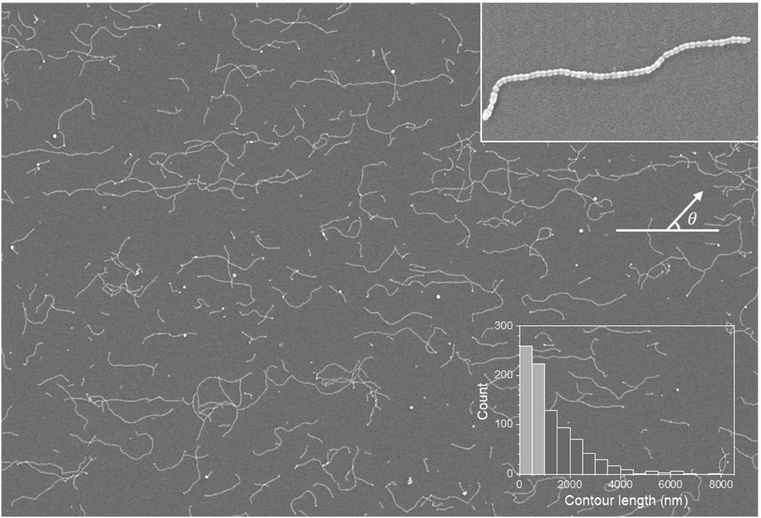
Supracolloidal chains were coated using a spin-coating method, where the solvent was evaporated rapidly through high-speed rotation and visualized by SEM (Fig. 4). The spin-coated chain exhibited the same shape as the drop-cast chain (Fig. 4 inset). The contour length distribution shown in the histogram (Fig. 4) is almost the same as that of the drop-cast chain, leading to the nearly identical average contour length of 1300 nm (±1140 nm) and 1260 nm (±1120 nm), respectively. In other words, spin-coating does not alter the distribution of the contour lengths of supracolloidal chains. It is worth noting that the large standard deviation is associated with the step-growth mechanism,19 in which the standard deviation becomes the average value ![[L with combining overline]](https://www.rsc.org/images/entities/i_char_004c_0305.gif) as the polydispersity index (PDI) approaches 2, as it equals to
as the polydispersity index (PDI) approaches 2, as it equals to ![[L with combining overline]](https://www.rsc.org/images/entities/i_char_004c_0305.gif) (PDI − 1)1/2.36
(PDI − 1)1/2.36
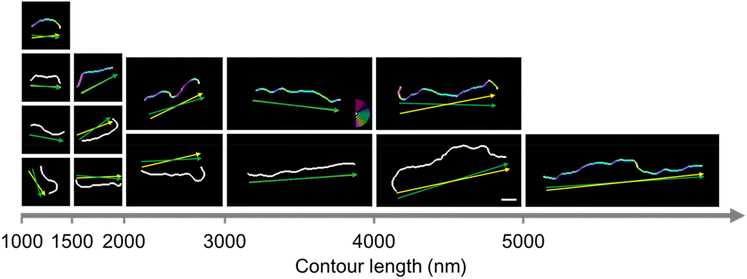
In contrast, spin-coated chains in Fig. 4, an image in the horizontal direction from the center of the substrate, appear aligned in a radial direction, marked by a white line. The chains also appear to be oriented in the radial direction in images obtained at 45 degrees and in the vertical direction from the center of the substrate (Fig. S2†). The orientation of 480 chains with contour lengths over 1000 nm was analyzed quantitatively by the same procedure with drop-cast chains. We arranged representative binarized chain images in increasing order of contour length and marked end-to-end vector and chain direction as green and yellow arrows, respectively, in Fig. 5. Since the chains are not excessively curved or bent, green and yellow arrows are nearly overlapped, pointing in almost the same direction.
We analyzed the end-to-end vector angle and direction angle with respect to the radial direction for 480 chains, representing the number of chains at 20-degree intervals in histograms, shown in Fig. 6a and b, respectively. Both the end-to-end vector angle and direction angle showed the highest concentration of chains along the radial direction, with more than half (58%) of the chains arranged within ±30° of the radial direction.32 The end-to-end vector angle and direction angle of 480 chains resulted in values of S = 0.40 and 0.41, respectively. The value of S = 0.4 for 480 chains confirms that the chain orientation is not random but is aligned to a specific direction with 99% confidence according to the Rayleigh test (2nS2 > 9.21).29,37,38 Unlike randomly oriented drop-cast chains, we verified that spin-coated chains are aligned in the radial direction. It is considered that during the spin-coating process, the outward flow generated by centrifugal force causes supracolloidal chains to align radially.29,39,40
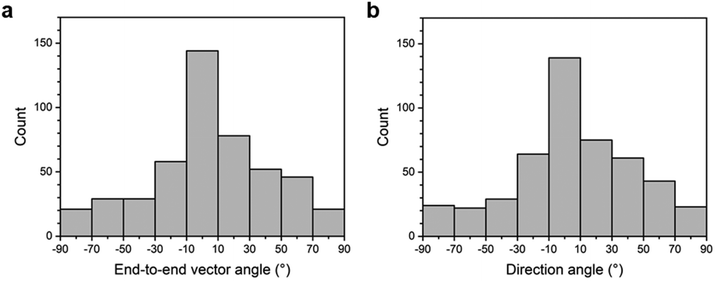 | ||
| Fig. 6 Histograms of the orientation angles of supracolloidal chains spin-coated on a substrate: (a) end-to-end vector angle; (b) direction angle. | ||
We note that variations in the coating conditions, such as colloidal concentration, spinning speed, and surface hydrophilicity of the substrate, scarcely affect the orientation of supracolloidal chains. For example, 0.02 wt% and 0.03 wt% solutions of supracolloidal chains resulted in similar values of the 2D order parameter S, with values of 0.41 and 0.37, respectively, although the chains on the substrate appeared slightly denser with a higher concentration (Fig. S4†). The spinning speed of 1500 and 4500 rpm also resulted in similar S values of 0.34 and 0.38, respectively (Fig. S5†). To avoid a residual solution on the substrate, we executed spin-coating for at least 60 s. In addition, we spin-coated supracolloidal chains on substrates with various water-contact angles of 35°, 70°, and 110°, which exhibited comparable S values of 0.39, 0.34, and 0.38, respectively (Fig. S6†).
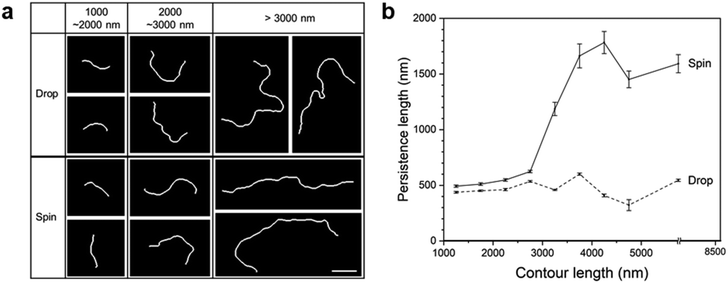
Spin-coated supracolloidal chains exhibit a stretched morphology when compared to drop-casted chains, so we arranged representative chains in increasing order of contour length for comparison in Fig. 7a. There appears to be little difference in the extent of stretching between drop-cast and spin-coated chains for chains with lengths below 3000 nm. However, spin-coated chains seem more stretched for chains longer than 3000 nm. In conventional polymers, polymer chains with stretched conformations exhibit a high persistence length (Lp), which indicates the extent of flexibility. We note that persistence length indicates the inherent flexibility of the chain, so the measured Lp represents the apparent persistence length for chains stretched by an external force.29 The apparent persistence length (Lp) of chains within a specific range of contour lengths was evaluated from the correlation between the tangent angles along the supracolloidal chains using Persistence software.30
For drop-cast and spin-coated chains with contour lengths of over 1000 nm, we obtained and displayed Lp for each contour length range (Fig. 7b).29 The Lp for the drop-cast chains remained nearly constant across the contour length range, yielding an Lp of 480 nm. The persistence length of randomly oriented chains without external force represents intrinsic flexibility of the chains. It is worthwhile to note that in order to examine chains with sufficiently long lengths, we analyzed the chains with contour lengths over 1000 nm, corresponding to over twice the intrinsic Lp of the chains. In sharp contrast, the Lp of spin-coated chains shows a higher value than that of drop-cast chains across all contour lengths. In particular, the Lp increased dramatically for contour lengths exceeding 3000 nm, resulting in Lp of 920 nm. This value is about twice the intrinsic Lp (480 nm), indicating the stretching of the chains. It is considered that during the spin-coating process, the outward flow generated by centrifugal force not only aligns supracolloidal chains in the radial direction but also stretches long chains. It is noted that the values of mean and deviation of persistence lengths in the graph of Fig. 7b are provided in Table S1 (ESI).†
Since a chain with the same contour length exhibits a longer end-to-end distance (Re) as it stretches, we plotted Revs. L of drop-cast and spin-coated chains with contour length over 1000 nm in Fig. 8a and b, respectively. As demonstrated in our previous report,18 supracolloidal chains are well described by the semi-flexible worm-like chain model. We fitted Revs. L to the equations of the worm-like chain model, Re = [4LpL − 8Lp2(1 − exp(−L/2Lp))]1/2, and plotted it as a dotted line.30 There was little difference between the Re of drop-cast and spin-coated chains with contour lengths under 3000 nm. However, spin-coated chains exhibited a higher Re than that of drop-casted chains with contour lengths over 3000 nm. After fitting the worm-like chain model, it was found that the spin-coated chains had an Lp of 1300 nm, which is 2.6 times greater than that of the drop-cast chains, confirming that the chains were stretched during the spin-coating process.
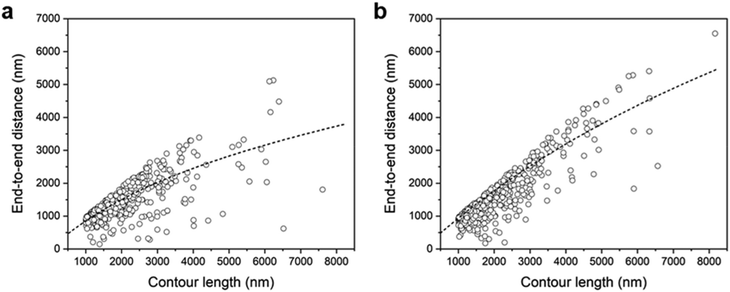 | ||
| Fig. 8 End-to-end distance (Re) vs. contour length (L) of supracolloidal chains: (a) drop-cast; (b) spin-coated. The dashed lines in (a) and (b) are calculated by the worm-like chain model. | ||
Confocal fluorescence microscopy was employed to observe supracolloidal chains simultaneously across a larger area than possible with SEM. As we can selectively incorporate Sulforhodamine 101 (S101, absorption and PL spectra in Fig. S3†) into the P4VP core of patchy micelles forming supracolloidal chains,41,42 we loaded S101 into both drop-cast and spin-coated chains. Subsequently, we visualized the chains using fluorescence microscopy (Fig. 9). We observed numerous chains emitting red fluorescence over an area more than ten times larger than the SEM images presented in Fig. 1 and 4. Chains longer than the resolution of confocal fluorescence microscopy (∼250 nm) can be clearly distinguished and identified. While drop-cast chains lack a specific orientation (Fig. 9a), spin-coated chains exhibit a horizontal radial alignment, with numerous stretched chains (Fig. 9b). Differences in orientation across a wide area were identified using fluorescence microscopy. Using OrientationJ software as before, we color-coded the chains in the fluorescent images with respect to their orientations (Fig. S7†). Inseparable chains due to agglomeration were excluded in the analysis. From these color-coded images, we obtained the 2D order parameter S values of 0.07 by drop-casting and 0.34 by spin-coating, indicating random and aligned orientation, respectively. Incorporating functional materials such as quantum dots and metal nanoparticles into the P4VP core20,21,43 allows chains oriented differently to serve as templates for aligning the materials. As additional examples of aligning functional materials, we synthesized Au and Pt nanoparticles by employing the supracolloidal chains as a template. It is noted that a spinning speed of 4500 rpm was used for spin-coating of the chains. We adapted the synthetic procedure described in our previous publications,20,44,45 in which precursors of Au and Pt nanoparticles were incorporated in the P4VP cores of PS-b-P4VP micelles, followed by plasma treatment to remove the polymeric part. Au and Pt nanoparticles, shown in Fig. 10a and b, respectively, were synthesized at the locations of the chains, resulting in their linear alignment. Separate nanoparticles, each with a diameter of ∼20 nm and a spacing of ∼30 nm, are clearly discernible in the enlarged images. We note that the diameter of nanoparticles in the images is somewhat overrepresented due to the inevitable sputtering of conductive materials such as Pt, which was necessary to prevent charging issues in SEM. We acknowledge that further refinement on the template chains is necessary to obtain nanoparticles with enhanced alignment. However, these results can demonstrate the potential application of the chains as a template for the aligning functional materials.
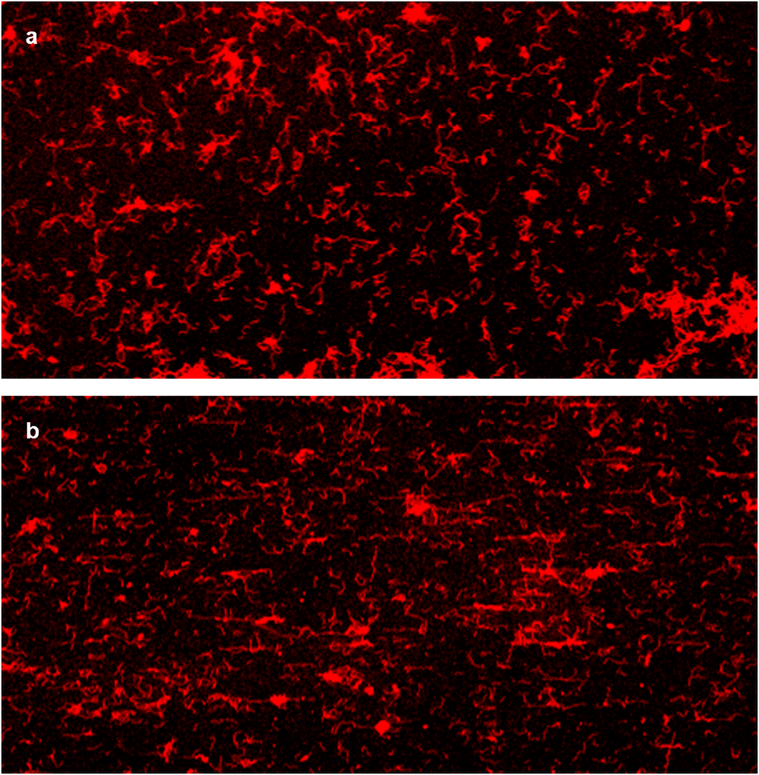 | ||
| Fig. 9 Fluorescent images of supracolloidal chains with Sulforhodamine 101: (a) drop-cast; (b) spin-coated. The size of each image is 100 μm × 50 μm. | ||
4. Conclusions
In summary, we confirmed the orientation and stretching of supracolloidal chains comprised of patchy micelles of the PS-b-P4VP copolymers by the spin-coating process through quantitative analysis. We measured end-to-end vector angles, direction angles, and persistence lengths using ImageJ, OrientationJ, and Persistence software from the electron microscope images of separate chains. In the case of chains coated by drop-casting, which is free from external force, there was no meaningful difference in the population of chains depending on the orientation angle. In addition, the 2D order parameter S was calculated to be near zero, indicating randomly oriented chains. In contrast, the chains coated by spin-coating, where centrifugal force is exerted, exhibited more than half of them oriented in the radial direction. The 2D order parameter S was also calculated to be 0.4, indicating the alignment of chains. Moreover, the persistence length of spin-coated chains increased by more than twice compared to the inherent Lp of the chains measured in drop-casting, verifying that the chains are stretched by spin-coating. Furthermore, by incorporating the red fluorophore S101 into the supracolloidal chains, we confirmed the alignment of chains using a confocal fluorescence microscope over an area more than ten times larger than SEM images. This demonstration indicates the potential of employing the oriented chains as a template for aligning functional materials such as quantum dots and metal nanoparticles.Conflicts of interest
There are no conflicts to declare.Acknowledgements
This research was supported by Basic Science Research Program through the National Research Foundation of Korea (NRF-2021R1A2C2003512).References
- H. Hu, S. Wang, X. Feng, M. Pauly, G. Decher and Y. Long, Chem. Soc. Rev., 2020, 49, 509–553 RSC.
- Y. Chen, T. Liang, L. Chen, Y. Chen, B. R. Yang, Y. Luo and G. S. Liu, Nanoscale Horiz., 2022, 7, 1299–1339 RSC.
- M. He, S. Zhang and J. Zhang, Chem. Rev., 2020, 120, 12592–12684 CrossRef CAS PubMed.
- W. K. Tatum and C. K. Luscombe, Polym. J., 2018, 50, 659–669 CrossRef CAS.
- Y. Yang, S. Duan and H. Zhao, Nanoscale, 2022, 14, 11484–11511 RSC.
- K. Li, C. M. Clarkson, L. Wang, Y. Liu, M. Lamm, Z. Pang, Y. Zhou, J. Qian, M. Tajvidi, D. J. Gardner, H. Tekinalp, L. Hu, T. Li, A. J. Ragauskas, J. P. Youngblood and S. Ozcan, ACS Nano, 2021, 15, 3646–3673 CrossRef CAS PubMed.
- P. J. M. Swinkels, Z. Gong, S. Sacanna, E. G. Noya and P. Schall, Nat. Commun., 2023, 14, 1524 CrossRef CAS PubMed.
- Y. J. Kim, J. Bin Moon, H. Hwang, Y. S. Kim and G. R. Yi, Adv. Mater., 2023, 35, 2203045 CrossRef CAS PubMed.
- X. Fan and A. Walther, Chem. Soc. Rev., 2022, 51, 4023–4074 RSC.
- L. J. Hill, N. Pinna, K. Char and J. Pyun, Prog. Polym. Sci., 2015, 40, 85–120 CrossRef CAS.
- I. S. Jo, S. Lee, J. Zhu, T. S. Shim and G. R. Yi, Curr. Opin. Colloid Interface Sci., 2017, 30, 97–105 CrossRef CAS.
- W. Li, H. Palis, R. Mérindol, J. Majimel, S. Ravaine and E. Duguet, Chem. Soc. Rev., 2020, 49, 1955–1976 RSC.
- K. Liu, Z. Nie, N. Zhao, W. Li, M. Rubinstein and E. Kumacheva, Science, 2010, 329, 197–200 CrossRef CAS PubMed.
- A. H. Gröschel, A. Walther, T. I. Löbling, F. H. Schacher, H. Schmalz and A. H. E. Müller, Nature, 2013, 503, 247–251 CrossRef PubMed.
- T. L. Nghiem, T. I. Löbling and A. H. Gröschel, Polym. Chem., 2018, 9, 1583–1592 RSC.
- J. H. Kim, W. J. Kwon and B. H. Sohn, Chem. Commun., 2015, 51, 3324–3327 RSC.
- S. Lee, S. Jang, K. Kim, J. Jeon, S. S. Kim and B. H. Sohn, Chem. Commun., 2016, 52, 9430–9433 RSC.
- K. Lee, J. Y. Kim, K. Kim, J. Jeon, H. Kang and B. H. Sohn, J. Colloid Interface Sci., 2021, 600, 804–810 CrossRef CAS PubMed.
- K. Lee and B. H. Sohn, J. Colloid Interface Sci., 2023, 648, 727–735 CrossRef CAS PubMed.
- S. Jang, K. Kim, J. Jeon, D. Kang and B. H. Sohn, Soft Matter, 2017, 13, 6756–6760 RSC.
- S. Chae, S. Lee, K. Kim, S. W. Jang and B. H. Sohn, Chem. Commun., 2016, 52, 6475–6478 RSC.
- K. Kim, S. Jang, J. Jeon, D. Kang and B. H. Sohn, Langmuir, 2018, 34, 4634–4639 CrossRef CAS PubMed.
- H. Yuan, I. J. Zvonkina, A. M. Al-Enizi, A. A. Elzatahry, J. Pyun and A. Karim, ACS Appl. Mater. Interfaces, 2017, 9, 11290–11298 CrossRef CAS PubMed.
- B. Zhao, C. J. McCutcheon, K. Jin, I. Lyadov, A. J. Zervoudakis, F. S. Bates and C. J. Ellison, ACS Appl. Polym. Mater., 2022, 4, 8705–8714 CrossRef CAS.
- W. A. Memon, Y. Zhang, J. Zhang, Y. Yan, Y. Wang and Z. Wei, Macromol. Rapid Commun., 2022, 43, 2100931 CrossRef CAS PubMed.
- X. Pan, M. G. Debije and A. P. H. J. Schenning, ACS Appl. Polym. Mater., 2021, 3, 578–587 CrossRef CAS.
- D. E. Smith, H. P. Babcock and S. Chu, Science, 1999, 283, 1724–1727 CrossRef CAS PubMed.
- D. J. Mai, A. Saadat, B. Khomami and C. M. Schroeder, Macromolecules, 2018, 51, 1507–1517 CrossRef CAS.
- J. M. Chan and M. Wang, Nano Lett., 2022, 22, 5891–5897 CrossRef CAS PubMed.
- J. S. Graham, B. R. McCullough, H. Kang, W. A. Elam, W. Cao and E. M. De La Cruz, PLoS One, 2014, 9, e94766 CrossRef PubMed.
- R. Rezakhaniha, A. Agianniotis, J. T. C. Schrauwen, A. Griffa, D. Sage, C. V. C. Bouten, F. N. Van De Vosse, M. Unser and N. Stergiopulos, Biomech. Model. Mechanobiol., 2012, 11, 461–473 CrossRef CAS PubMed.
- R. Blell, X. Lin, T. Lindström, M. Ankerfors, M. Pauly, O. Felix and G. Decher, ACS Nano, 2017, 11, 84–94 CrossRef CAS PubMed.
- R. Merindol, S. Diabang, R. Mujica, V. Le Houérou, T. Roland, C. Gauthier, G. Decher and O. Felix, ACS Nano, 2020, 14, 16525–16534 CrossRef CAS PubMed.
- T. Zhang, P. W. Stackhouse, B. Macpherson and J. C. Mikovitz, Renewable Energy, 2021, 172, 1333–1340 CrossRef.
- P. T. Probst, S. Sekar, T. A. F. König, P. Formanek, G. Decher, A. Fery and M. Pauly, ACS Appl. Mater. Interfaces, 2018, 10, 3046–3057 CrossRef CAS PubMed.
- T. P. Lodge and P. C. Hiemenz, Polymer Chemistry, CRC Press, Boca Raton, 3rd edn, 2020 Search PubMed.
- N. I. Fisher, Statistical analysis of circular data, Cambridge University Press, London, 1995 Search PubMed.
- K. V. Mardia and P. E. Jupp, Directional Statistics, Wiley, New York, 2000 Search PubMed.
- E. D. Cranston and D. G. Gray, Biomacromolecules, 2006, 7, 2522–2530 CrossRef CAS PubMed.
- S. van Berkel, J. S. Klitzke, M. A. Moradi, M. M. R. M. Hendrix, P. Schmit, P. van der Schoot and H. S. Schrekker, Thin Solid Films, 2021, 724, 138599 CrossRef CAS.
- S. H. Bae, S. Il Yoo, W. K. Bae, S. Lee, J. K. Lee and B. H. Sohn, Chem. Mater., 2008, 20, 4185–4187 CrossRef CAS.
- S. Il Yoo, J. H. Lee, B. H. Sohn, I. Eom, T. Joo, S. J. An and G. C. Yi, Adv. Funct. Mater., 2008, 18, 2984–2989 CrossRef.
- J. H. Swisher, L. Jibril, S. H. Petrosko and C. A. Mirkin, Nat. Rev. Mater., 2022, 7, 428–448 CrossRef CAS.
- S. S. Kim, Y. R. Kim, T. D. Chung and B. H. Sohn, Adv. Funct. Mater., 2014, 24, 2764–2771 CrossRef CAS.
- S. S. Kim, M. J. Park, J. H. Kim, G. Ahn, S. Ryu, B. H. Hong and B. H. Sohn, Chem. Mater., 2015, 27, 7003–7010 CrossRef CAS.
Footnote |
| † Electronic supplementary information (ESI) available. See DOI: https://doi.org/10.1039/d4nr00663a |
| This journal is © The Royal Society of Chemistry 2024 |

