 Open Access Article
Nanoengineering steel's durability: creating gradient nanostructured spheroidal carbides and lath-shaped nano-martensite via ultrasonic shot peening†
Fei
Yin
*abc,
Yuxuan
Yi
abc,
Chang
Yang
abc and
Gary J.
Cheng
 *de
*de
aHubei Longzhong Laboratory, Xiangyang, 441000, China. E-mail: fyin@whut.edu.cn
bHubei Key Laboratory of Advanced Technology for Automotive Components, Wuhan University of Technology, Wuhan, 430070, China
cSchool of Automotive Engineering, Wuhan University of Technology, Wuhan, 430070, China
dSchool of Industrial Engineering, Purdue University, West Lafayette, IN 47906, USA. E-mail: gjcheng@purdue.edu
eSchool of Materials Engineering, Purdue University, West Lafayette, IN 47906, USA
First published on 10th October 2024
Abstract
Surface nanoengineering can significantly improve the mechanical properties and performance of metals, such as strength, hardness, fatigue, wear resistance, etc. In this work, we tailored the surface microstructure of GCr15 bearing steel within a thickness of approximately 800 μm using room temperature ultrasonic shot peening (USP) technology. Microstructure characterization studies reveal the formation of gradient nanosized spheroidal carbides and lath-shaped nano-martensite in the GCr15 bearing steel during the USP process. The micro-sized martensite structure (∼1.8 μm) in the as-received GCr15 bearing steel was refined to lath-shaped nano-martensite with a thickness of ∼10 nm. The USP-induced transformation of carbides and the segregation of carbon elements within the peened surface layer of the GCr15 bearing steel were clearly observed. The sizes of carbides were reduced from ∼800 nm to ∼460 nm during the USP treatment. These phenomena were primarily attributed to the interactions between dislocations and carbides, as well as the interfacial wear occurring between the carbides and the matrix materials. The segregation of carbon elements within the USP-treated sample was ascribed to the interplay between dislocations concentrated at grain boundaries and the ensuing carbon diffusion within the cementite phase. As a result of surface nanoengineering, the microhardness of the USP-treated GCr15 bearing steel was improved by approximately 30% compared to its as-received counterparts and a significant enhancement in wear resistance was achieved. The wear rate coefficient for USP-treated GCr15 bearing steel is reduced by 43.19% and 84.62% after 4 and 8 minutes of peening, respectively. This study paves the way for exciting advancements in nanoengineering metals for superior durability.
1. Introduction
High chromium bearing steel has gained widespread recognition in the manufacturing industry, particularly in applications like bearing rings and ball screws, owing to its exceptional wear resistance, impressive corrosion resistance, and reliable dimensional stability.1,2 However, a prominent challenge associated with bearing steel pertains to its susceptibility to surface wear under extreme loads, which remains its primary mode of failure. Tailoring surface microstructures has been widely recognized to enhance surface hardness and strength and thus improve wear resistance.3 The concept of gradient nanostructured surface layers has exhibited remarkable potential in elevating the mechanical properties of materials. Such advantages encompass a remarkable synergy between strength and ductility,4–7 enhanced resistance to fatigue,8,9 and exceptional friction and wear characteristics.10–15 Gradient nanostructures, characterized by a spatially varying distribution of microstructures, such as grains or twins, where the grain size or twin thickness spans one or more orders of magnitude, have emerged as a critical area of research.16,17 Surface nanocrystallization of metals and alloys induced by severe plastic deformation (SPD) has proven to be a highly effective approach in creating gradient nanostructured surface layers.18–20 Past studies have demonstrated that SPD techniques can lead to exceptional wear resistance by refining the microstructure of materials.21,22 Laser shot peening, surface mechanical attrition treatment, etc. can be used to achieve gradient nanostructured surface layers on metals and alloys, e.g. stainless steel,23 copper,24,25etc. Gradient nanostructured surface layers can significantly increase the fatigue resistance of the metals and components. However, these surface nanocrystallization technologies require complicated equipment set-up and it is still a challenge to fabricate high-performance gradient nanostructured surface layers on hard-to-deform engineering bearing steels with high yield strength.A significant challenge remains in the fabrication of gradient nanostructured surface layers on high strength bearing steel with a yield strength of approximately 2.0 GPa and low ductility (less than 10%) through conventional surface treatment methods. To address this challenge, advanced high-energy surface treatment technologies, such as surface mechanical rolling treatment (SMRT) and ultrasonic shot peening (USP), have been developed. For example, Zhang et al.26,27 successfully generated a thick gradient nanograined surface layer on ultra-high strength bearing steel (GCr15) using SMRT, while Yin et al. achieved a super-strong M50 bearing steel with a gradient nanostructure through USP.22 However, the process of USP-induced surface nanocrystallization in GCr15 bearing steel remains unexplored, and the microstructural evolution of GCr15 bearing steel during the USP process, particularly the refinement of microstructures like carbides, austenite, and martensite, has received limited attention. Furthermore, the influence of the gradient nanostructured surface layer on the friction and wear resistance of GCr15 steel remains unclear.
This study aims to fabricate a gradient nanostructured surface layer on GCr15 steel using USP technology. Shot peening has been widely used for surface treatment of metals and alloys for fatigue resistance enhancement by introducing compressive residual stress into the surface of the targets. Conventional shot peening technology uses high-pressure air to accelerate steel shots, and a recycling system for steel shots is needed. Ultrasonic shot peening uses high-frequency (>20 kHz) ultrasonic signals as the power source to accelerate steel shots and impact the target surface within an enclosed chamber. Detailed characterization of carbides and phases within the gradient nanostructured surface layer enables us to develop a comprehensive understanding of microstructure evolution of this gradient nanostructured surface layer during USP. Furthermore, we conducted pin-on-disk wear tests at room temperature to evaluate the influence of gradient nanostructured surface layers on wear resistance. This research systematically explores the formation mechanisms of gradient nanostructures, the relationship between the gradient nanostructured surface layer and friction coefficient, as well as the wear resistance of gradient nanostructured GCr15 bearing steel. These findings serve as a valuable theoretical foundation for the potential application of USP technology to tailor surface microstructures and enhance the wear resistance of GCr15 high strength bearing steel in the near future.
2. Materials, ultrasonic shot peening and characterization
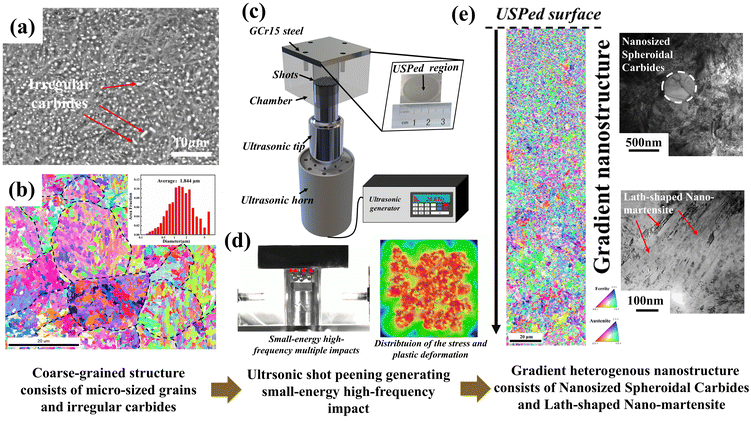
The as-received (AR) tempered GCr15 bearing steel was characterized by using scanning electron microscopy (SEM). Fig. 1(a) shows martensite and spheroidal carbides intricately embedded within a ferrite matrix. Fig. 1(b) shows an electron backscattering diffraction (EBSD) map of the AR-GCr15 steel, shedding light on its grain structure. The AR-GCr15 material displays grain sizes ranging from approximately 15 to 20 μm, coexisting with diminutive martensite phases varying in size from 0.2 μm to 5 μm, with an average martensite size of approximately 1.844 μm. Notably, grain boundaries are denoted by black dashed lines, and the martensite phases exhibit uniform orientation within the matrix. The chemical composition of the AR-GCr15 bearing steel can be found in Table 1.| C | Cr | Si | Mn | P | S | Ni | Cu | Mo | Fe |
|---|---|---|---|---|---|---|---|---|---|
| 0.97 | 1.47 | 0.24 | 0.31 | 0.16 | 0.03 | 0.03 | 0.02 | 0.01 | Bal. |
The schematic representation of the ultrasonic shot peening (USP) process is presented in Fig. 1(c). This process was performed at an ultrasonic frequency of 20 kHz and a power output of 1.5 kW. Detailed information regarding the USP methodology can be obtained from our previous works.18,28–31 During the USP treatment, GCr15 bearing steel samples underwent peening for varying durations of 2 minutes, 4 minutes, and 8 minutes. This revised approach incorporated the utilization of 4 mm-diameter shots, thereby imparting higher impact energy compared to the previously employed 3 mm-diameter shots. The USP technology is an efficient method to fabricate gradient nanostructured surface layers on metals and alloys and surface nanoengineering can be used in mechanical strengthening of other engineering bearing steels, e.g. M50 bearing steel and stainless steel. The core principle of the USP technique, as illustrated in Fig. 1(d), involves the introduction of low-energy, high-frequency, and repetitive impacts, mitigating the risk of surface damage during the surface nanocrystallization process. Fig. 1(d) illustrates the ultrasonic shot peening process for a steel sample within a transparent enclosed chamber captured using a Photron high-speed camera (Fastcam Nova S12) with a frame per second of 40![[thin space (1/6-em)]](https://www.rsc.org/images/entities/char_2009.gif) 000. Multiple impact simulations during the peening process were conducted on the ABAQUS platform. The detailed set-up of high-speed camera observation and FE simulation modelling can be referred to our previously published literature.32Fig. 1(e) shows the gradient nanostructured surface layer in the USP-treated GCr15 bearing steel, as assessed via electron backscattering diffraction (EBSD) analysis, revealing nanosized spheroidal carbides and lath-shaped nano-martensite structures.
000. Multiple impact simulations during the peening process were conducted on the ABAQUS platform. The detailed set-up of high-speed camera observation and FE simulation modelling can be referred to our previously published literature.32Fig. 1(e) shows the gradient nanostructured surface layer in the USP-treated GCr15 bearing steel, as assessed via electron backscattering diffraction (EBSD) analysis, revealing nanosized spheroidal carbides and lath-shaped nano-martensite structures.
All samples were mechanically polished and then etched for 20 seconds in ethanol solution containing 4% nitric acid. A scanning electron microscope (FEG 450) was used to observe the microstructure of the materials. Electron backscatter diffraction (EBSD) scans were performed using an FEI Quanta 450 equipped with an EDAX-TSL EBSD system with a step size of 150 nm. TEM characterization was performed on the FEI Talos 200X. EDS mapping of the sample was carried out using the STEM model. Thin foils were prepared along the cross-sectional direction of the USPed-8 min GCr15 sample at its topmost surface and at a depth of about 40 μm from the peened surface. X-ray diffraction (XRD) measurements were performed on a Rigaku MiniFlex 600 diffraction analyzer with a copper anode at a scanning speed of 5° min−1. Subsequently, we highlighted the major results.
3. Results
3.1 Gradient nanostructure of the GCr15 bearing steel
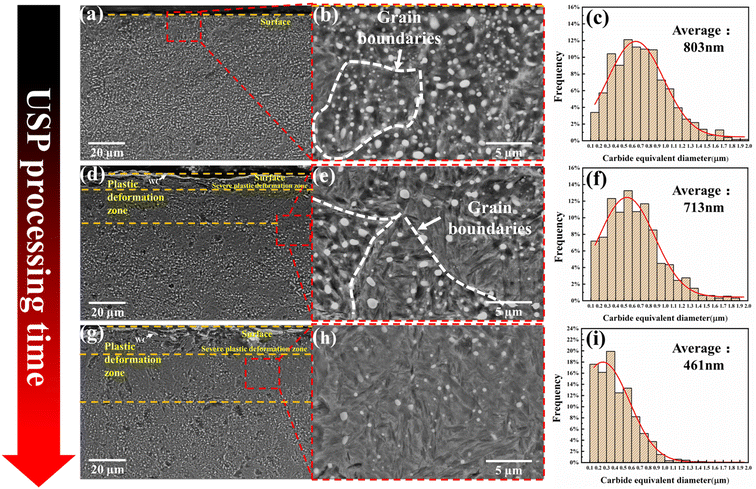
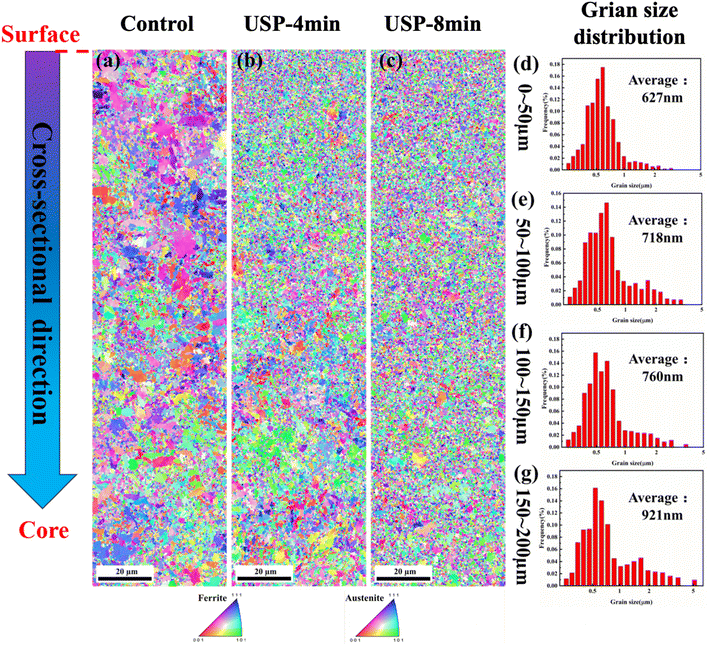
Fig. 2(a) shows a SEM image of the as-received GCr15 bearing steel (AR-GCr15), while Fig. 2(b) shows an enlarged view of the marked region in Fig. 2(a). Notably, grain boundaries are denoted by white dashed lines, and spheroidal carbide particles are observed to be uniformly distributed within the grains. The statistical analysis of the carbide size, as depicted in Fig. 2(c), reveals an average carbide size of approximately 800 nm. Fig. 2(d) and (g) show the SEM images of the GCr15 bearing steels subjected to peening for approximately 4 minutes and 8 minutes, respectively, along their cross-sectional direction. Evident in these images is the presence of a severely plastically deformed surface layer, as further illustrated in Fig. 2(e) and (h). With an increase in peening duration, grain boundaries become progressively less distinct as illustrated in Fig. 2 and Fig. S1.† The average carbide particle size exhibits a diminishing trend, reducing from 800 nm to 713 nm and further to 461 nm as the peening duration increases from 0 minutes to 4 minutes and 8 minutes, as shown in Fig. 2(f) and (i).Fig. 3(a)–(c) depict the electron backscattering diffraction (EBSD) mapping of the as-received coarse-grained bearing steel and gradient nanostructured bearing steel treated with 4 min and 8 min, along its cross-sectional direction, respectively. Gradient nanostructures (GNs) have been fabricated on the surface of the GCr15 bearing steel with the peening duration of 4 min and 8 min according to Fig. 3(a)–(c). With the increase of peening duration, the thickness of the GN surface layer increases and the gradient nanostructure can be further refined. Fig. 3(d)–(g) show a statistical analysis of martensite size within specific depth intervals from the peened surface, encompassing the 0–50 μm, 50–100 μm, 100–150 μm, and 150–200 μm regions, in the USPed GCr15 bearing steel with an 8 min peening duration. The corresponding average martensite sizes in these specified regions were measured at 627 nm, 718 nm, 760 nm, and 921 nm, respectively, as shown in Fig. 3(d)–(g). Statistical analysis of the martensite phase size with respect to the depth profile for the USPed GCr15 bearing steel with the peening duration of 4 min is shown in Fig. S2.† It is worth noting that the EBSD mapping employs a step size of 150 nm. Further comprehensive characterization studies of the USP-treated samples will be conducted employing transmission electron microscopy (TEM).
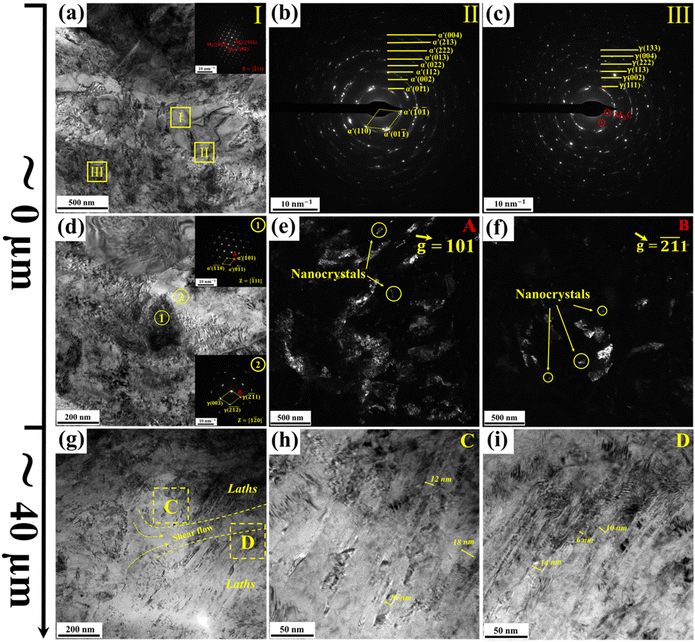
Fig. 4 illustrates the TEM characterization of the USPed sample with the peening duration of 8 min. Two TEM samples were prepared from its topmost surface and ∼40 μm depth from its topmost surface. Fig. 4(a) and (d) illustrate the bright-field (BF) images of the nanostructure of the sample at different magnifications. A high density of dislocations can be clearly identified in Fig. 4(a) and (d). To identify the phase condition of the nanostructure processed by USP, selected area electron diffraction (SAED) patterns were captured at areas I, II and III as marked by the yellow squares in Fig. 4(a). The inset in Fig. 4(a) shows the diffraction pattern of area I along the [![[2 with combining macron]](https://www.rsc.org/images/entities/char_0032_0304.gif) 11] axial zone, and the carbide (Fe3C) SAED pattern was indexed. Fig. 4(b) and (c) illustrate the SAD patterns of areas 2 and 3, respectively. According to the SAED analysis, there are the α martensite phase and the γ austenite phase in areas II and III. The diffraction rings suggest that the α phase and γ phase have been refined down to nanometers. It should be note that there are some spotty bits on the diffraction rings illustrated in Fig. 4(b) and (c), which is because the size of the SAED aperture used here is the smallest. Actually, the nanocrystals can be clearly identified in the dark-filed images illustrated in Fig. 4(e) and (f) as well. Fig. 4(d) illustrates the magnified characterization of the ultrasonic shot peening-induced nanostructure. The insets in Fig. 4(d) show the SAED patterns captured from areas ① and ②. Fig. 4(e) and (f) illustrate the dark-field (DF) images of the nanostructure with the
11] axial zone, and the carbide (Fe3C) SAED pattern was indexed. Fig. 4(b) and (c) illustrate the SAD patterns of areas 2 and 3, respectively. According to the SAED analysis, there are the α martensite phase and the γ austenite phase in areas II and III. The diffraction rings suggest that the α phase and γ phase have been refined down to nanometers. It should be note that there are some spotty bits on the diffraction rings illustrated in Fig. 4(b) and (c), which is because the size of the SAED aperture used here is the smallest. Actually, the nanocrystals can be clearly identified in the dark-filed images illustrated in Fig. 4(e) and (f) as well. Fig. 4(d) illustrates the magnified characterization of the ultrasonic shot peening-induced nanostructure. The insets in Fig. 4(d) show the SAED patterns captured from areas ① and ②. Fig. 4(e) and (f) illustrate the dark-field (DF) images of the nanostructure with the  of [101] and [
![[2 with combining macron]](https://www.rsc.org/images/entities/char_0032_0304.gif)
![[1 with combining macron]](https://www.rsc.org/images/entities/char_0031_0304.gif) 1], respectively, by moving the SAED aperture to the SAED spot marked by the red circles in the insets of Fig. 4(d). The nanosized α phase ranging from several nanometers to hundreds of nanometers can be identified from the DF images in Fig. 4(e). According to Fig. 4(f), the nanosized γ phase ranging from several to tens of nanometers has been fabricated by USP. A large number of lath-shaped grains ranging from several to tens of nanometers in thickness can be clearly identified in Fig. 4(g)–(i). At the location of 40 μm depth from the peening surface, the materials undergo severe plastically deformation (SPD) during the USP process. The large martensite structure was refined down to nanometers, resulting in lath-shaped martensite with a thickness of nanometers, as illustrated in Fig. 4(h) and (i).
1], respectively, by moving the SAED aperture to the SAED spot marked by the red circles in the insets of Fig. 4(d). The nanosized α phase ranging from several nanometers to hundreds of nanometers can be identified from the DF images in Fig. 4(e). According to Fig. 4(f), the nanosized γ phase ranging from several to tens of nanometers has been fabricated by USP. A large number of lath-shaped grains ranging from several to tens of nanometers in thickness can be clearly identified in Fig. 4(g)–(i). At the location of 40 μm depth from the peening surface, the materials undergo severe plastically deformation (SPD) during the USP process. The large martensite structure was refined down to nanometers, resulting in lath-shaped martensite with a thickness of nanometers, as illustrated in Fig. 4(h) and (i).
3.2 Formation of the nanosized spheroidal carbides
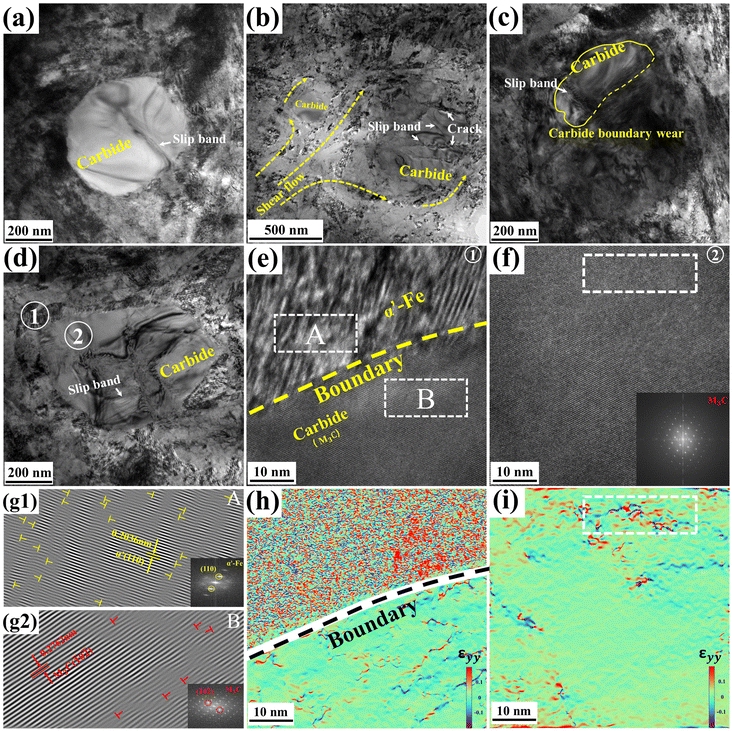
The plastic deformation induced by ultrasonic shot peening (USP) exerts a transformative influence on the pre-existing state of carbides within GCr15 steel. This transformation hinges upon carbide type and hardness, with each type exhibiting varying degrees of resistance to plastic deformation. It is well established that during the USP process, the presence of large irregular carbides can give rise to stress concentrations, thus increasing the susceptibility to macroscopic irregular carbide fracturing.33,34As shown in Fig. 5(a)–(d), our observations unveil conspicuous slip bands and fissures within the carbides. The development of these slip bands can be attributed to the propagation of a substantial number of dislocations across slip planes, an outcome of substantial plastic deformation. Fig. 5(b) illustrates distinct plastic flow patterns, notably evident between two adjacent carbides, while Fig. 5(c) shows a gradual blurring of the carbide perimeters, indicative of the substantial accumulation of dislocations within these regions. It is noteworthy that the internal plastic deformation assists in the decomposition of cementite, with larger-sized cementite being more prone to undergoing plastic deformation.35 For a more detailed examination, high-resolution transmission electron microscopy (HR-TEM) was used to scrutinize the two marked regions (areas 1 and 2) as designated by white circles in Fig. 5(d), as shown in Fig. 5(e) and (f). These inspections unveil the presence of a high density of dislocations or dislocation walls at the interface between the matrix and carbide, as demonstrated in Fig. 5(d). To further substantiate these findings, inverse fast Fourier transition (IFFT) analysis was performed on box-selected areas in Fig. 5(e), as shown in Fig. 5(g1) and (g2), thereby confirming the presence of a substantial accumulation of dislocations outside the carbide boundaries, with a limited number of dislocations penetrating into the carbides. This discrepancy arises from the relative hardness of the carbides, which effectively obstructs the progress of dislocations within the matrix and culminates in their accumulation in the vicinity of the carbide–matrix interface. Moreover, the geometric phase analysis (GPA) plots in Fig. 5(h) and (i) serve to corroborate the presence of a considerable number of dislocations concentrated at the boundary interfaces.
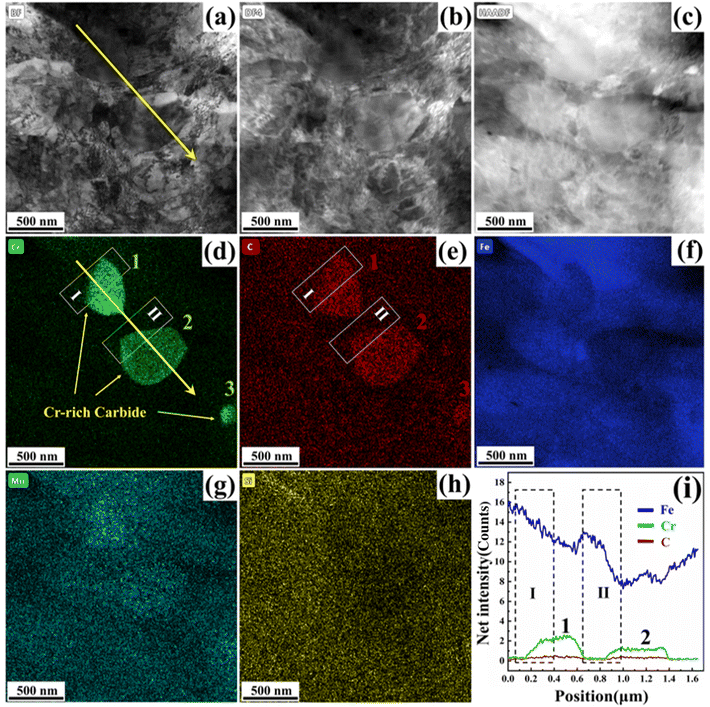
Fig. 6(a)–(c) show bright-field (BF), dark-field 4 (DF4), and high-angle annular dark-field (HAADF) images, respectively, shedding light on the plastic deformation undergone by the carbides during USP. These images serve to underscore the structural changes that transpire within the carbides, further corroborating the effect of USP-induced plastic deformation. The slip bands and dislocations in the carbides can be characterized as illustrated in Fig. 5. That's because the carbides can be deformed and refined during the USP process due to the severe plastic deformation. Our investigation extends to energy-dispersive X-ray spectroscopy (EDS) mapping presented in Fig. 6(d)–(h), which provides elemental insights into the composition of the carbides. Notably, these carbides are identified as high chromium carbides. In Fig. 6(d), a conspicuous alteration is observed in the upper left boundary of carbide No. 1. The distribution of Cr elements in this region appears disrupted in comparison to carbide No. 2, implying a potential decomposition process. It should be noted that the more advanced characterization method, e.g. time-resolved TEM, can be employed to better prove this statement in the future. Furthermore, the upper left boundary of the carbide exhibits blurring, with a less pronounced difference in the carbon element concentration at the boundary. This phenomenon can be attributed to elemental diffusion at the interface between the carbide and the matrix. This continuous decomposition of the carbides, coupled with mechanical mixing between the carbides and the martensite matrix, culminates in a progressive reduction in the chromium content within the deformed carbides. To quantitatively substantiate this transformation, a line scan indicated by the yellow arrow line in Fig. 6(d) is presented in Fig. 6(i). This analysis confirms that the Cr concentration within carbide No. 1 is noticeably lower than that in carbide No. 2, providing clear evidence of carbide dissolution. Consequently, this dissolution process contributes to the refinement of carbide size and the achievement of a more uniform morphology.
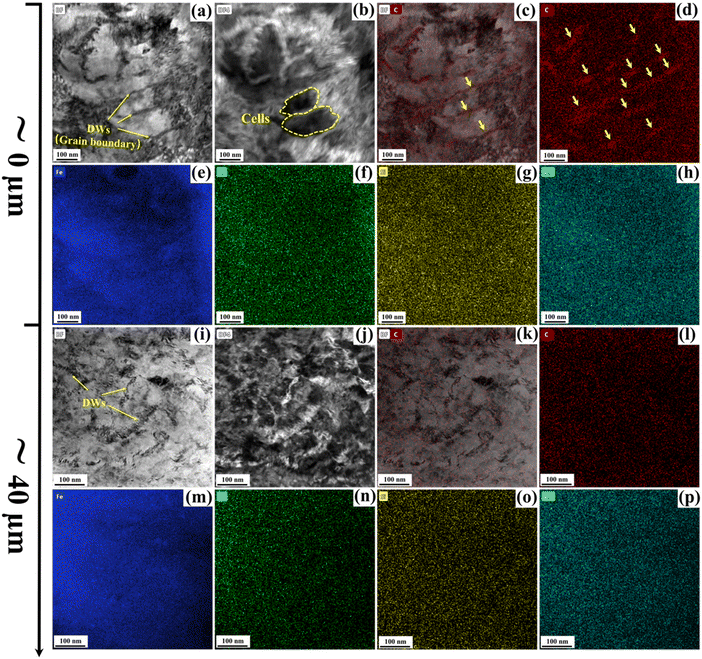
Fig. 7 provides an in-depth exploration of the microstructural features at both the topmost surface and a depth of 40 μm from the peened surface in the gradient nanostructured GCr15 bearing steel. The examination includes bright-field (BF) and high-angle annular dark-field scanning transmission electron microscopy (HAADF-STEM), and energy-dispersive X-ray spectroscopy (EDS) mapping. Fig. 7(a) shows the presence of dislocation walls formed at grain/phase boundaries, prominently marked by yellow arrows. These dislocation walls emerge at the nanoscale, underscoring the influence of severe plastic deformation (SPD) induced by ultrasonic shot peening (USP). Within the microstructure, Fig. 7(b) shows a notable accumulation of dislocations within cellular structures. These dislocation walls and cells are direct consequences of SPD, further affirming its impact on the material. In the topmost surface of the material, Fig. 7(c)–(h) exhibit carbon segregation at grain/phase boundaries. This segregation of carbon elements is particularly evident in regions where the grain/phase size has been refined to the nanometer scale. Such carbon segregation at the nanoscale level contributes to the stabilization of the nanosized structure generated through USP. This enhanced stability augments the wear resistance of the GCr15 bearing steel during dry sliding wear tests, especially under conditions of frictional heating. Conversely, at a depth of 40 μm from the peened surface, Fig. 7(i) and (j) show the presence of a substantial number of dislocation walls. Notably, in this region, there is a lack of significant carbon segregation, as depicted in Fig. 7(k)–(p). These observations offer valuable insights into the microstructural variations within the gradient nanostructured GCr15 bearing steel and its implications for material performance.
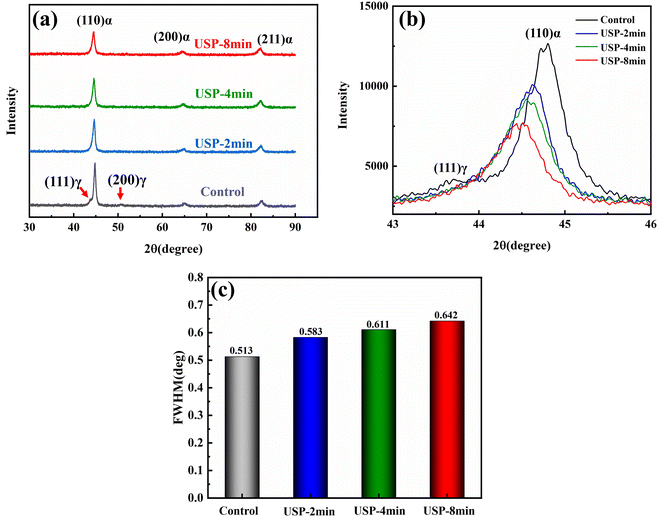
Fig. 8(a) illustrates the XRD patterns of the samples with different peening durations of 0 min, 2 min, 4 min and 8 min. The retained austenite γ (111) and γ (200) peaks disappeared in the surface layer after ultrasonic shot peening, implying a phase transformation phenomenon (γ → α phase). It is noted that the nanosized γ phase was identified by TEM in Fig. 4. Thus, the disappearance of the γ phase in the XRD pattern is ascribed to the low amount of the nanosized γ austenite phase in the surface layer. The width of the martensite α(110) peak increases with the increase of the peening duration from 2 min to 4 min and to 8 min, indicating microstructure refinement. The full width at half maximum (FWHM) of the α(110) peak of the bearing steel sample with the peening duration of 0 min, 2 min, 4 min and 8 min is 0.513, 0.583, 0.611 and 0.642, respectively. The left-ward shift of the α(110) peak in Fig. 8(b) indicates lattice expansion during the USP process. The lattice expansion can be explained by the phase transformation from the FCC γ → BCC α phase. It should be noted that the diffraction patterns in the XRD spectra have been normalized. Specifically, the intensity of the highest peak, i.e., the α (110) peak, has been set to the same value across all spectra, allowing for a more straightforward comparison of peak positions and peak broadening between the samples treated with different peening durations.
3.3 Microhardness
The microhardness measurement was carried out using an HVT-1000A tester equipped with a Vickers indenter with a maximum load of 200 g and a hold time of 10 s. The microhardness of the gradient nanostructured layer was measured by grinding the sample from its peened surface down to the core layer by layer. The microhardness measurements of the gradient nanostructured GCr15 bearing steels along their cross-sectional direction show a gradient distribution, as shown in Fig. 9. The maximum microhardness of the USPed samples is 955 HV, located at the topmost surface of the USPed sample with the peening duration of 8 min. The microhardness of the AR-GCr15 bearing steel is around 750 HV. With the increase of the peening duration, the maximum microhardness and thickness of the hardened layer increased gradually. The thickness of the gradient hardened surface layer can reach up to 800 μm, as illustrated in Fig. 9. Wang et al. reported a gradient nanostructured surface layer on the AISI52100 bearing steel using the surface mechanical rolling treatment at room temperature. According to their test results, the microhardness reaches ∼10.2 GPa at the treated surface and continuously decreases to the matrix value of ∼8.5 GPa with increasing depth. The thickness of the hardened surface layer in the sample was estimated to be ∼600 μm.23 The HV hardness can be transferred to the GPa hardness by multiplying a factor of 0.009807. Herein, the microhardness of the AR-GCr15 bearing steel is 7.36 GPa and the maximum microhardness of the USPed sample can reach as high as 9.36 GPa, which agrees well with that of the mechanical strengthened AISI-52100 bearing steel using the SMRT technology. The thickness of the mechanical strengthened surface layer on the USPed GCr15 bearing steel can reach as high as 0.8 mm, suggesting that a thicker mechanical strengthened surface layer can be fabricated on the high-strength GCr15 bearing steel via USP technology.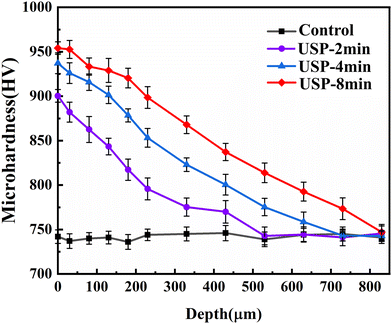 | ||
| Fig. 9 Microhardness distribution of the AR-GCr15 bearing steel and USPed GCr15 bearing steel with peening durations of 2 min, 4 min and 8 min along their cross-sectional direction. | ||
3.4 Pin-on-disk wear tests
The wear tests were carried out using a computerized ball-disk wear tester (HT-1000) at room temperature. The rotation speed is 700 rpm and the friction radius is 5 mm. The grinding ball is a silicon nitride ball (Si3N4) with a diameter of 6 mm. The test surface was cleaned in an acetone solution using an ultrasonic cleaner, and then the surface topography was characterized and measured before and after the wear test using an optical profiler (Bruker Contour GT-K 3D). The worn surface and wear debris were analyzed by optical microscopy (OM) and scanning electron microscopy (SEM).The surface topography of the as-received and USPed samples was measured using a Bruker Contour GT-K 3D optical profiler and the typical arithmetic mean surface roughness Ra was quantified according to EN ISO 4287 and EN ISO 16610-21. The test results in Fig. 10 suggest that the surface roughness of the USPed GCr15 bearing steel samples is higher than that of the polished sample. The Ra values of these samples are 0.551 μm, 2.937 μm and 3.304 μm, corresponding to the as-received AR-GCr15 bearing steel sample and the two USPed GCr15 bearing steel samples with the peening duration of 4 min and 8 min, respectively.
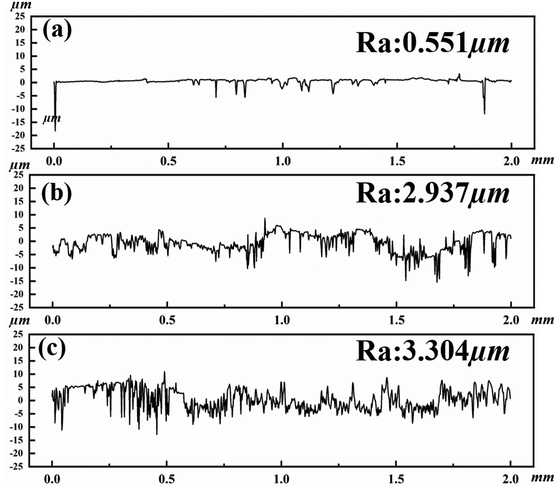 | ||
| Fig. 10 Surface roughness of (a) the polished AR-GCr15 bearing steel sample and the USPed GCr15 bearing steel sample with peening durations of (b) 4 min and (c) 8 min. | ||
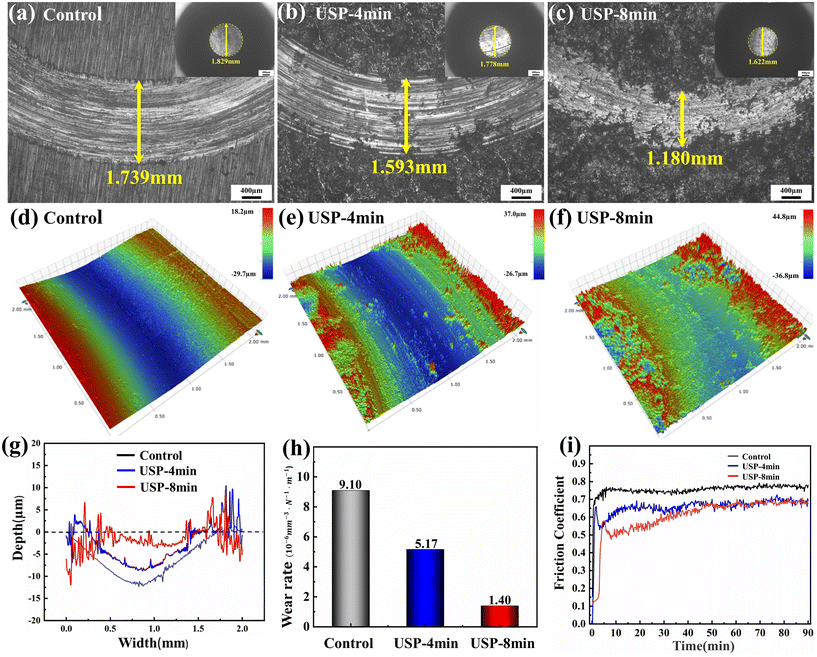
Fig. 11(a)–(c) illustrate the optical microscopy (OM) observations of the scratched surface of the AR-GCr15 bearing steel and two USPed GCr15 bearing steels with the peening duration of 4 min and 8 min, respectively. The dry sliding wear tests were conducted at room temperature for 1.5 hours. The scratch width of the AR-GCr15 bearing steel and the two USPed GCr15 bearing steels with the peening duration of 4 min and 8 min is 1.739 mm, 1.593 mm and 1.180 mm, respectively. The scratch width of the two USPed samples is smaller than that of the AR-GCr15 bearing steel sample, indicating an enhanced wear resistance. Fig. 11(d)–(f) and (g) illustrate the 3D and 2D surface profiles of the scratched surface of the AR-GCr15 bearing steel and the two USPed GCr15 bearing steels with the peening duration of 4 min and 8 min, respectively. Based on the 3D and 2D surface profiles of the scratches, the wear rate of the AR-GCr15 bearing steels was calculated according to eqn (1):
 | (1) |
4. Discussions
4.1 Mechanisms of microstructure refinement during USP
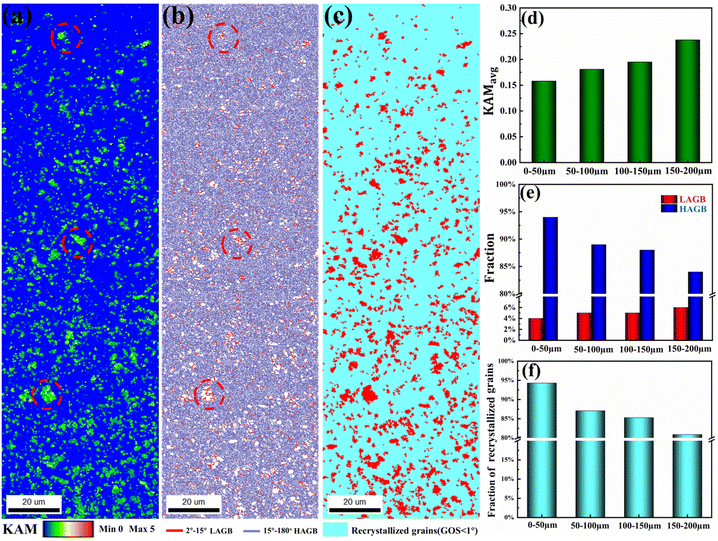
The application of ultrasonic shot peening (USP) to the surface layer of GCr15 steel generates a substantial degree of severe plastic deformation characterized by high strain rates. This process induces both element diffusion and dislocation annihilation along the sample's cross-sectional direction. Fig. 12(a) illustrates the distribution of the kernel average misorientation (KAM) in a USP-treated sample with an 8-minute peening duration, as determined by electron backscattering diffraction (EBSD) analysis. KAM is an indicator reflecting the net change in dislocation density resulting from plastic deformation, exhibiting a gradient distribution along the cross-sectional direction of the USP-treated samples. Fig. 12(d) shows the average KAM value at various locations within the USP-treated sample. Notably, the KAM value decreases from 0–50 μm, 50–100 μm, and 100–150 μm to 150–200 μm from the peened surface, showing values of 0.158, 0.181, 0.195, and 0.238, respectively. In essence, the topmost surface of the GCr15 bearing steel undergoes severe plastic deformation (SPD). This SPD process results in the accumulation and dynamic recovery of dislocations within refined sub-grains or dislocation cells. Concurrently, dislocations are absorbed by the grain boundaries of these sub-grains or dislocation cells, contributing to a reduction in KAM values at the topmost surface of the peened material.Fig. 12(b) shows the distribution of high-angle grain boundaries (HAGBs) and low-angle grain boundaries (LAGBs) identified through EBSD mapping. Fig. 12(e) shows the statistical analysis of the fractions of HAGBs and LAGBs at different locations within the USP-treated GCr15 bearing steel. The fraction of HAGBs increases progressively with the accumulation of plastic deformation. As the GCr15 bearing steel experiences substantial plastic strain at high strain rates during the USP process, dislocations are continually generated, mobilized, and interact, leading to the formation of dislocation walls/clusters and even HAGBs, corresponding to continuous dynamic recrystallization (cDRX), as confirmed by the EBSD characterization in Fig. 12(a) and (b). The grain orientation spread (GOS) mapping of the gradient nanostructures is depicted in Fig. 12(c). Fig. 12(f) illustrates the recrystallized grain fraction calculated from the GOS mapping at different locations within the USP-treated sample. The recrystallized grain fraction decreases as one progresses from the location 0–50 μm to 150–200 μm from the peened surface, showing values of 94.3%, 87.1%, 85.3%, and 80.9%, respectively. To summarize, the primary factors contributing to grain refinement and the formation of the gradient nanostructure within the GCr15 bearing steel are associated with the interaction between dislocations and grain boundaries.
4.2 Mechanisms of carbide refinement and segregation
The refinement of carbides within the GCr15 bearing steel during the ultrasonic shot peening (USP) process was elucidated through the observations presented in Fig. 5 and 6. Several factors contribute to the mechanisms governing carbide refinement during USP: (1) increased interface energy: Languillaume and Sauvage have highlighted that the instability of cementite during plastic deformation is a result of the increased free energy at the interface, coupled with the progressive thinning of carbide lamellae.36,37 Under the influence of the Gibbs–Thomson effect, carbon atoms diffuse through the cementite/matrix interface, ultimately leading to cementite decomposition. (2) Dislocation–carbide interaction: dislocations can instigate the decomposition of carbides as posited by Gavriyu et al.38 This decomposition behavior is triggered by dislocation slip occurring within the cementite structure, and it is governed by the principle that the binding energy between carbon atoms and iron atoms in cementite is lower than that of carbon atoms and dislocations. (3) Interfacial wear: the distinct difference in plastic deformability between the matrix and carbide results in carbide refinement through interfacial wear. During this process, carbon atoms from the carbide surface are transferred to the martensitic matrix, facilitating refinement.Deformation and fragmentation of carbides within the severely plastic-deformed (SPDed) layer led to an increase in the area-to-volume ratio of the matrix/carbide interface. Consequently, the interface energy between the carbide and the martensite matrix was increased. EDS mapping, as demonstrated in Fig. 6(d), reveals that carbide No.1 exhibits a blurred boundary with diffused carbon and chromium elements. Examination of the carbide boundary through TEM and HR-TEM characterization, as depicted in Fig. 5(d) and 6(e), underscores the substantial inhibition of dislocations at the boundary between the carbide and matrix materials. IFFT analysis in Fig. 5(g1) and (g2) indicates a substantial presence of dislocations in proximity to the boundary, with a crystallographic spacing of 0.203 nm identified as the (110) α phase. Notably, the IFFT analysis near the dislocation wall and within the carbide reveals marked lattice distortions, signifying intense interactions between dislocations and carbides. GPA analysis, as found in Fig. 5(e) and (f), provides further evidence of lattice distortion-induced strain within the matrix materials, which significantly exceeds that observed within the carbide. This observation implies that a significant accumulation of dislocations takes place at the boundary between the matrix materials and the carbide. Owing to the superior strength of the carbide, dislocations tend to aggregate at the boundary, subsequently forming dislocation walls. A smaller subset of dislocations traverses the boundary and infiltrates the carbide, as illustrated in Fig. 5(h) and (i). Consequently, the carbide undergoes breakage, decomposition, and refinement into smaller sizes due to the shear bands generated by the plastic flow, as demonstrated in Fig. 5.
The phenomenon of SPD-induced grain boundary segregation has been experimentally documented in various alloys.39,40 During the high-pressure torsion (HPT) processing of pearlitic steels, Sauvage observed the formation of equiaxial nanostructures and the decomposition of cementite.41 Notably, dislocation cell boundaries formed during HPT can capture carbon atoms released during cementite decomposition. These carbon-saturated dislocations at the α-Fe/Fe3C interface become embedded in the ferrite. In this study, a notably lower concentration of carbon elements is observed in the region approximately 40 μm below the peened surface. Notably, no element segregation is apparent in the GCr15 bearing steel within this region, as illustrated in Fig. 7(i)–(p). Conversely, at the uppermost peened surface layer, carbon element segregation at the nanoscale is prominently evident, as shown in Fig. 7(b) and (d). Element segregation at the nanoscale level can significantly enhance the mechanical properties of alloys.42–44 For example, SPD-induced grain boundary segregation in aluminum alloys enhances the flow strength of these alloys. In ferritic steels, carbon element segregation into grain boundaries augments the cohesive strength of these boundaries45,46 and increases the Hall–Petch coefficient ky for ferritic steels.46 S. Araki et al. have directly measured the critical shear stress required for dislocation emission from grain boundaries via nanoindentation. They have demonstrated that the increase in critical shear stress is positively correlated with the extent of carbon segregation at grain boundaries.47 Furthermore, carbon segregation into grain boundaries suppresses the dynamic recovery of sub-grains by reducing grain boundary energy, thereby maintaining the refined grain size.48 Thus, the observed carbon segregation in the nanostructured GCr15 bearing steel fabricated via USP in this study serves to enhance its stability during the SPD refinement process and augments its wear resistance.
4.3 Mechanism of enhanced wear resistance
According to the classical friction theory, the wear volume of the tested sample is proportional to its actual contact area, which is determined as follows:49| ΔV = fPL/H | (2) |
 | (3) |
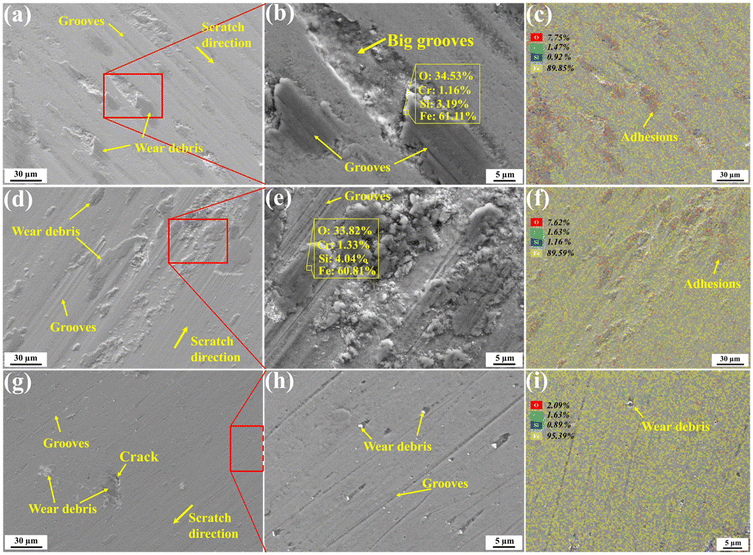
Another phenomenon during the wear tests is the decreased friction coefficient for the USPed GCr15 bearing steel. First, adhesion occurs on the surface of the friction pair; the tangential resistance Fa generated by shearing occurs on the friction pair.54 The friction coefficient contributed by this part can be expressed by μa, which is related to the surface properties of the friction pair and the contact area between them.55 The peaks and valleys of the USPed sample surface can reduce the contact area between the friction pair, reducing μa. Secondly, the frictional resistance Fp resulting from the asperities on the hard surface or the plows generated by the wear particles can be expressed by μp. Fig. 13 illustrates the worn surface of the GCr15 bearing steel with the peening duration of 0 min, 4 min and 8 min. There are many abrasive particles on the worn surface of the AR GCr15 bearing steel and big grooves on the worn surface as illustrated in Fig. 13(a) and (b). On the worn surface of the GCr15 bearing steel sample with the peening duration of 4 min, there are some abrasive debris and furrows. The size and width of these debris and furrows are smaller than that on the worn surface of the AR-GCr15 bearing steel sample as illustrated in Fig. 13(d) and (e). A significant reduction in wear debris and grooves was also observed on the worn surface of the GCr15 bearing steel sample with the USP duration of 8 min (Fig. 13(g) and (h)). Previous studies have shown that the micro texture on the surface can effectively accommodate the wear debris generated at the friction interface by the microgrooves, and significantly reduce the furrow effect.56,57 In this work, the USP can generate a peak–valley surface topography on the GCr15 bearing steel sample. The concave–convex surface topography can accommodate the wear debris and reduce the μp. Thirdly, the frictional resistance Fd generated by the deformation of the surface of the friction pair can be represented by μd, which is related to the surface roughness of the friction pair material and the contact stress between them.58 USP plastically deforms the surface of GCr15 steel, resulting in a rough surface compared with the polished AR control sample as illustrated in Fig. 10. There will be a large average contact stress, that is, the stress concentration caused by the rough surface for the USPed samples, which will increase the friction coefficient μd. In summary, the total friction coefficient μ can be regarded as the combination of these three friction coefficients, namely μ = μa + μp + μd. The application of ultrasonic shot peening (USP) induces notable changes in the friction characteristics of the GCr15 bearing steel. Specifically, USP results in an increase in the dynamic friction coefficient (μd), while causing reductions in the adhesive friction coefficient (μa) and ploughing friction coefficient (μp). The evolution of friction coefficients over time, as depicted in Fig. 11(i), exhibits a gradual rise, consistent with the gradual wear of the peak–valley structure generated by USP and the formation of an ultra-strong nanostructured surface layer. It is pertinent to acknowledge that most steels are thermodynamically unstable in ambient air and can readily undergo oxidation upon exposure to atmospheric oxygen. This oxidation process becomes increasingly pronounced under the conditions of sliding action and the associated frictional heating. Importantly, the oxidative activation energy during sliding contact is found to be approximately half that of the activation energy under static conditions.
The examination of the worn surface through energy-dispersive X-ray spectroscopy (EDS) analysis reveals the impact of USP on reducing oxidative wear, as evidenced in Fig. 13(c), (f), and (i). Remarkably, the worn surface of the USP-treated GCr15 bearing steel, particularly the sample treated for 8 minutes (USP-8 min), exhibits a remarkably uniform distribution of oxygen elements, as demonstrated in Fig. 13(i). It is worth noting that during the wear test, the actual contact area for the USP-8 min sample can be envisioned as discrete point contacts, primarily due to the distinctive peak–valley surface roughness. Furthermore, the results of EDS point analyses conducted on wear chips at specific locations, denoted by yellow squares in Fig. 13(b) and (e), indicate elevated oxygen and silicon contents in comparison to the matrix materials. This observation suggests that the oxide particles originate from a mixture of GCr15 steel and the balls used in the wear test. These oxide particles can function as wear debris and exert an adverse effect on the material's wear resistance. In contrast, the worn surface of the USP-treated GCr15 bearing steel with an 8-minute peening duration exhibits a conspicuous absence of oxide particles and oxidation elements, as evident in Fig. 13(h) and (i). Thus, the presence of the ultra-strong gradient nanostructured surface layer, crafted through USP, significantly enhances the oxidation resistance of the worn surface. This enhancement bodes well for the overall wear resistance of the material.
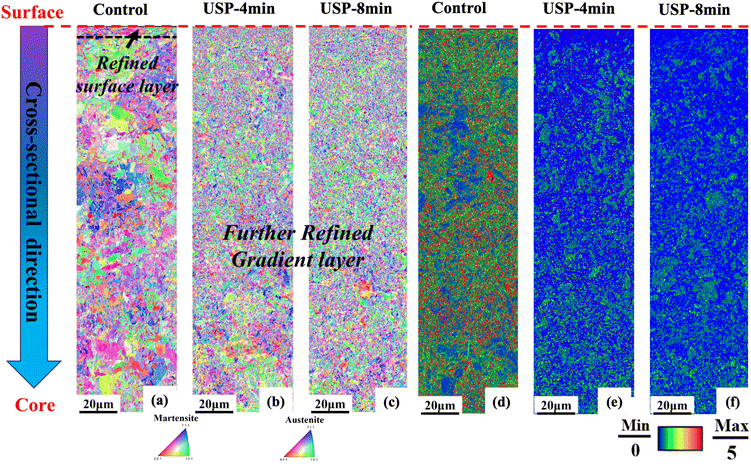
Fig. 14 illustrates the EBSD characterization of the GCr15 bearing steel samples after 1.5 hour sliding wear tests from the worn surface to the matrix along their cross-sectional direction. The inverse pole figure (IPF) and kernel average misorientation (KAM) mapping of the tested control sample are shown in Fig. 14(a) and (d), respectively. The GCr15 bearing steel sample undergone severe plastic deformation during the pin-on-disk sliding wear test, which results in refinement of the microstructure at its topmost surface as illustrated in Fig. 14(a). Meanwhile, the KAM value of the tested control sample increases significantly as illustrated in Fig. 14(d). That's because of the increased dislocation density resulting from the SPD during the sliding pin-on-disk wear test, which agrees well with our findings on M50 bearing steel.22 For the USPed samples, the gradient nanostructures were further refined during the pin-on-disk sliding wear tests as illustrated in Fig. 14(b) and (e). Meanwhile, there is not significant change of the KAM value of the USPed bearing steel, suggesting a stable microstructure of the gradient nanostructured bearing steel sample during the sliding wear tests.
5. Conclusions
We successfully achieved the fabrication of gradient nanostructured bearing steel through the innovative application of ultrasonic shot peening (USP) technology. Systematic investigations involving advanced materials characterization and comprehensive mechanical testing revealed microstructural transformations, mechanical reinforcement, and wear performance of the USP-treated bearing steel. The GCr15 bearing steel underwent substantial microstructural refinement during the USP process, achieving an ultra-strong gradient nanostructured surface layer within a thickness of approximately 800 μm. The USP-induced transformation of carbides and the segregation of carbon elements within the peened surface layer of the GCr15 bearing steel were clearly observed. These phenomena were primarily attributed to the interactions between dislocations and carbides, as well as the interfacial wear occurring between the carbides and the matrix materials. The segregation of carbon elements within the USP-treated sample was ascribed to the interplay between dislocations concentrated at grain boundaries and the ensuing carbon diffusion within the cementite phase.In the case of USP treatment with an 8-minute duration, the lath-shaped martensite thickness was reduced to about 10 nm, and the carbides were refined to around 460 nm. As a result, the microhardness of the resulting gradient heterogeneous nanostructured GCr15 bearing steel exhibited a remarkable improvement of about 30% compared to the as-received counterpart. The refined carbides and carbon element segregation collectively contributed to the notable improvement in the wear resistance of the GCr15 bearing steel. An appreciable reduction in the friction coefficient, by at least 16% within the initial 45 minutes, was realized for the USP-treated sample with an 8-minute peening duration in comparison to the untreated as-received GCr15 bearing steel. Furthermore, the wear scratch width and wear mass loss exhibited reductions of 32% and 80%, respectively, in the USP-treated sample compared to its as-received, untreated counterparts. This marked enhancement in wear resistance can be primarily attributed to the presence of the ultra-strong surface layer characterized by a gradient heterogeneous nanostructure, consisting of nanosized spheroidal carbides and lath-shaped nano-martensite, meticulously produced through the ultrasonic shot peening technology.
Data availability
The authors confirm that the data supporting the findings of this study are available within the article and/or its ESI.†Conflicts of interest
There are no conflicts to declare.Acknowledgements
This work was financially supported by the National Key Research and Development Program of China (No. 2020YFA0714900), the National Natural Science Foundation of China (No. 51975441), the Independent Innovation Projects of the Hubei Longzhong Laboratory (2022ZZ-26 and 2024KF-18), the Fundamental Research Funds for the Central Universities (WUT: 2020IVA020), and the Innovative Research Team Development Program of the Ministry of Education of China (IRT_17R83).References
- H. Bhadeshia, Steels for bearings, Prog. Mater. Sci., 2012, 57(2), 268–435 Search PubMed.
- E. V. Zaretsky, Rolling bearing steels–a technical and historical perspective, Mater. Sci. Technol., 2012, 28(1), 58–69 Search PubMed.
- Y. Cao, J. Sun, F. Ma, Y. Chen, X. Cheng, X. Gao and K. Xie, Effect of the microstructure and residual stress on tribological behavior of induction hardened GCr15 steel, Tribol. Int., 2017, 115, 108–115 Search PubMed.
- Y. Lin, Q. Yu, J. Pan, F. Duan, R. O. Ritchie and Y. Li, On the impact toughness of gradient-structured metals, Acta Mater., 2020, 193, 125–137 Search PubMed.
- K. Lu, Making strong nanomaterials ductile with gradients, Science, 2014, 345(6203), 1455–1456 Search PubMed.
- R. Cao, Q. Yu, J. Pan, Y. Lin, A. Sweet, Y. Li and R. O. Ritchie, On the exceptional damage-tolerance of gradient metallic materials, Mater. Today, 2020, 32, 94–107 Search PubMed.
- J. Zhao, Q. Kan, L. Zhou, G. Kang, H. Fan and X. Zhang, Deformation mechanisms based constitutive modelling and strength-ductility mapping of gradient nano-grained materials, Mater. Sci. Eng., A, 2019, 742, 400–408 Search PubMed.
- Z. Wang, N. Tao, S.-s. Li, W. Wang, G. Liu, J. Lu and K. Lu, Effect of surface nanocrystallization on friction and wear properties in low carbon steel, Mater. Sci. Eng., A, 2003, 352(1–2), 144–149 Search PubMed.
- Z. Ma, J. Liu, G. Wang, H. Wang, Y. Wei and H. Gao, Strength gradient enhances fatigue resistance of steels, Sci. Rep., 2016, 6(1), 22156 Search PubMed.
- X. Chen, Z. Han and K. Lu, Friction and wear reduction in copper with a gradient nano-grained surface layer, ACS Appl. Mater. Interfaces, 2018, 10(16), 13829–13838 Search PubMed.
- X. Chen, Z. Han, X. Li and K. Lu, Lowering coefficient of friction in Cu alloys with stable gradient nanostructures, Sci. Adv., 2016, 2(12), e1601942 Search PubMed.
- X. Zhao, B. Zhao, Y. Liu, Y. Cai and C. Hu, Research on friction and wear behavior of gradient nano-structured 40Cr steel induced by high frequency impacting and rolling, Eng. Failure Anal., 2018, 83, 167–177 Search PubMed.
- P. Wang, Z. Han and K. Lu, Enhanced tribological performance of a gradient nanostructured interstitial-free steel, Wear, 2018, 402, 100–108 Search PubMed.
- S. A. Chamgordani, R. Miresmaeili and M. Aliofkhazraei, Improvement in tribological behavior of commercial pure titanium (CP-Ti) by surface mechanical attrition treatment (SMAT), Tribol. Int., 2018, 119, 744–752 Search PubMed.
- D. Ba, F. Meng and X. Liu, Friction and wear behaviors of surface nanocrystalline layer prepared on medium manganese surfacing layer under oil lubrication, Tribol. Int., 2014, 80, 210–215 Search PubMed.
- W. Ji, R. Zhou, P. Vivegananthan, M. S. Wu, H. Gao and K. Zhou, Recent progress in gradient-structured metals and alloys, Prog. Mater. Sci., 2023, 101194 Search PubMed.
- Q. Pan and L. Lu, Synthesis and deformation mechanics of gradient nanostructured materials, Natl. Sci. Open, 2022, 1(1), 20220010 Search PubMed.
- F. Yin, G. J. Cheng, R. Xu, K. Zhao, Q. Li, J. Jian, S. Hu, S. Sun, L. An and Q. Han, Ultrastrong nanocrystalline stainless steel and its Hall-Petch relationship in the nanoscale, Scr. Mater., 2018, 155, 26–31 Search PubMed.
- F. Yin, S. Hu, R. Xu, S. Xiang, L. Hua and G. J. Cheng, Ultrastrong medium entropy alloy with simultaneous strength-ductility improvement via heterogeneous nanocrystalline structures, Mater. Sci. Eng., A, 2021, 823, 141631 Search PubMed.
- X. Lu, J. Zhao, Z. Wang, B. Gan, J. Zhao, G. Kang and X. Zhang, Crystal plasticity finite element analysis of gradient nanostructured TWIP steel, Int. J. Plast., 2020, 130, 102703 Search PubMed.
- Z. Dong, F. Wang, D. Qian, F. Yin, H. Wang, X. Wang, S. Hu and J. Chi, Enhanced Wear Resistance of the Ultrastrong Ultrasonic Shot-Peened M50 Bearing Steel with Gradient Nanograins, Metals, 2022, 12(3), 424 Search PubMed.
- F. Yin, P. Han, Q. Han, H. Wang, L. Hua and G. J. Cheng, Ultrastrong gradient M50 bearing steel with lath-shape nano-martensite by ultrasonic shot peening and its enhanced wear resistance at elevated temperature, Mater. Des., 2024, 112786 Search PubMed.
- P. Peyre, X. Scherpereel, L. Berthe, C. Carboni, R. Fabbro, G. Béranger and C. Lemaitre, Surface modifications induced in 316L steel by laser peening and shot-peening. Influence on pitting corrosion resistance, Mater. Sci. Eng., A, 2000, 280(2), 294–302 Search PubMed.
- Z. Yin, X. Yang, X. Ma, J. Moering, J. Yang, Y. Gong, Y. Zhu and X. Zhu, Strength and ductility of gradient structured copper obtained by surface mechanical attrition treatment, Mater. Des., 2016, 105(5), 89–95 Search PubMed.
- K. Lu and J. Lu, Nanostructured surface layer on metallic materials induced by surface mechanical attrition treatment, Mater. Sci. Eng., A, 2004, 375–377, 38–45 Search PubMed.
- K. Zhang and Z. Wang, Strain-induced formation of a gradient nanostructured surface layer on an ultrahigh strength bearing steel, J. Mater. Sci. Technol., 2018, 34(9), 1676–1684 Search PubMed.
- K. Zhang, Z. Wang and K. Lu, Enhanced fatigue property by suppressing surface cracking in a gradient nanostructured bearing steel, Mater. Res. Lett., 2017, 5(4), 258–266 Search PubMed.
- F. Yin, S. Hu, L. Hua, X. Wang, S. Suslov and Q. Han, Surface nanocrystallization and numerical modeling of low carbon steel by means of ultrasonic shot peening, Metall. Mater. Trans. A, 2015, 46, 1253–1261 Search PubMed.
- F. Yin, M. Rakita, S. Hu and Q. Han, Overview of ultrasonic shot peening, Surf. Eng., 2017, 33(9), 651–666 Search PubMed.
- F. Yin, S. Hu, R. Xu, X. Han, D. Qian, W. Wei, L. Hua and K. Zhao, Strain rate sensitivity of the ultrastrong gradient nanocrystalline 316L stainless steel and its rate-dependent modeling at nanoscale, Int. J. Plast., 2020, 129, 102696 Search PubMed.
- F. Yin, X. Zhang, F. Chen, S. Hu, K. Ming, J. Zhao, L. Xie, Y. Liu, L. Hua and J. Wang, Understanding the microstructure refinement and mechanical strengthening of dual-phase high entropy alloy during ultrasonic shot peening, Mater. Des., 2023, 111771 Search PubMed.
- P. Li, S. Hu, Y. Liu, L. Hua and F. Yin, Surface nanocrystallization and numerical modeling of 316L stainless steel during ultrasonic shot peening process, Metals, 2022, 12(10), 1673 Search PubMed.
- X. Yue, S. Hu, X. Wang, Y. Liu, F. Yin and L. Hua, Understanding the nanostructure evolution and the mechanical strengthening of the M50 bearing steel during ultrasonic shot peening, Mater. Sci. Eng., A, 2022, 836, 142721 Search PubMed.
- C. Wang, K. Luo, J. Wang and J. Lu, Carbide-facilitated nanocrystallization of martensitic laths and carbide deformation in AISI 420 stainless steel during laser shock peening, Int. J. Plast., 2022, 150, 103191 Search PubMed.
- Y. Qin, D. Mayweg, P.-Y. Tung, R. Pippan and M. Herbig, Mechanism of cementite decomposition in 100Cr6 bearing steels during high pressure torsion, Acta Mater., 2020, 201, 79–93 Search PubMed.
- J. Languillaume, G. Kapelski and B. Baudelet, Cementite dissolution in heavily cold drawn pearlitic steel wires, Acta Mater., 1997, 45(3), 1201–1212 Search PubMed.
- X. Sauvage, J. Copreaux, F. Danoix and D. Blavette, Atomic-scale observation and modelling of cementite dissolution in heavily deformed pearlitic steels, Philos. Mag. A, 2000, 80(4), 781–796 Search PubMed.
- V. Gavriljuk, Decomposition of cementite in pearlitic steel due to plastic deformation, Mater. Sci. Eng., A, 2003, 345(1–2), 81–89 Search PubMed.
- X. Sauvage, A. Ganeev, Y. Ivanisenko, N. Enikeev, M. Murashkin and R. Valiev, Grain boundary segregation in UFG alloys processed by severe plastic deformation, Adv. Eng. Mater., 2012, 14(11), 968–974 Search PubMed.
- D. A. Basha, R. Sahara, H. Somekawa, J. M. Rosalie, A. Singh and K. Tsuchiya, Interfacial segregation induced by severe plastic deformation in a Mg–Zn–Y alloy, Scr. Mater., 2016, 124, 169–173 Search PubMed.
- X. Sauvage and Y. Ivanisenko, The role of carbon segregation on nanocrystallisation of pearlitic steels processed by severe plastic deformation, J. Mater. Sci., 2007, 42, 1615–1621 Search PubMed.
- G. Sha, K. Tugcu, X. Liao, P. Trimby, M. Murashkin, R. Valiev and S. Ringer, Strength, grain refinement and solute nanostructures of an Al–Mg–Si alloy (AA6060) processed by high-pressure torsion, Acta Mater., 2014, 63, 169–179 Search PubMed.
- R. Valiev, N. Enikeev, M. Y. Murashkin, V. Kazykhanov and X. Sauvage, On the origin of the extremely high strength of ultrafine-grained Al alloys produced by severe plastic deformation, Scr. Mater., 2010, 63(9), 949–952 Search PubMed.
- W. Xu, X. Liu, X. Li and K. Lu, Deformation induced grain boundary segregation in nanolaminated Al–Cu alloy, Acta Mater., 2020, 182, 207–214 Search PubMed.
- J. Wang, R. Janisch, G. K. Madsen and R. Drautz, First-principles study of carbon segregation in bcc iron symmetrical tilt grain boundaries, Acta Mater., 2016, 115, 259–268 Search PubMed.
- S. Suzuki, S. Tanii, K. Abiko and H. Kimura, Site competition between sulfur and carbon at grain boundaries and their effects on the grain boundary cohesion in iron, Metall. Mater. Trans. A, 1987, 18, 1109–1115 Search PubMed.
- S. Araki, K. Mashima, T. Masumura, T. Tsuchiyama, S. Takaki and T. Ohmura, Effect of grain boundary segregation of carbon on critical grain boundary strength of ferritic steel, Scr. Mater., 2019, 169, 38–41 Search PubMed.
- Y. Li, D. Raabe, M. Herbig, P.-P. Choi, S. Goto, A. Kostka, H. Yarita, C. Borchers and R. Kirchheim, Segregation stabilizes nanocrystalline bulk steel with near theoretical strength, Phys. Rev. Lett., 2014, 113(10), 106104 Search PubMed.
- K. Jia and T. Fischer, Sliding Wear of Conventional and Nanostructured Cemented Carbides, Wear, 1997, 203, 310–318 Search PubMed.
- X. Chen, Z. Han, X. Y. Li and K. Lu, Friction of stable gradient nano-grained metals, Scr. Mater., 2020, 185, 82–87 Search PubMed.
- W. Cui, G. Qin, J. Duan and H. Wang, A graded nano-TiN coating on biomedical Ti alloy: Low friction coefficient, good bonding and biocompatibility, Mater. Sci. Eng., C, 2017, 71, 520–528 Search PubMed.
- M. Chandross, J. F. Curry, T. F. Babuska, P. Lu, T. A. Furnish, A. B. Kustas, B. L. Nation, W. L. Staats and N. Argibay, Shear-induced softening of nanocrystalline metal interfaces at cryogenic temperatures, Scr. Mater., 2018, 143, 54–58 Search PubMed.
- Z. N. Farhat, Y. Ding, D. O. Northwood and A. T. Alpas, Effect of grain size on friction and wear of nanocrystalline aluminum, Mater. Sci. Eng., A, 1996, 206(2), 302–313 Search PubMed.
- N. Suh and H. Sin, The Genesis of Friction, Wear, 1981, 69, 91–114 Search PubMed.
- D.-E. Kim and N. Suh, On microscopic mechanisms of friction and wear, Wear, 1991, 149, 199–208 Search PubMed.
- A. Borghi, E. Gualtieri, D. Marchetto, L. Moretti and S. Valeri, Tribological effects of surface texturing on nitriding steel for high-performance engine applications, Wear, 2008, 265(7), 1046–1051 Search PubMed.
- T. Ibatan, M. S. Uddin and M. A. K. Chowdhury, Recent development on surface texturing in enhancing tribological performance of bearing sliders, Surf. Coat. Technol., 2015, 272, 102–120 Search PubMed.
- Q. Ding, L. Wang, L. Hu, T. Hu and Y. Wang, The pairing-dependent effects of laser surface texturing on micro tribological behavior of amorphous carbon film, Wear, 2012, 274, 43–49 Search PubMed.
Footnote |
| † Electronic supplementary information (ESI) available. See DOI: https://doi.org/10.1039/d4nr02994a |
| This journal is © The Royal Society of Chemistry 2024 |

