 Open Access Article
Creative Commons Attribution 3.0 Unported Licence
Photochromism of phenazine-2,3-diol derivatives through excited state intermolecular proton transfer based on keto–enol tautomerization†
Kazuki
Ohira
 ,
Kumpei
Kozuka
,
Naoki
Kaneda
,
Masahiro
Yamamoto
,
Keiichi
Imato
,
Kumpei
Kozuka
,
Naoki
Kaneda
,
Masahiro
Yamamoto
,
Keiichi
Imato
 and
Yousuke
Ooyama
 *
*
Applied Chemistry Program, Graduate School of Advanced Science and Engineering, Hiroshima University, 1-4-1 Kagamiyama, Higashi-Hiroshima 739-8527, Japan. E-mail: yooyama@hiroshima-u.ac.jp
First published on 11th April 2024
Abstract
Photochromism through excited-state intermolecular proton transfer (ESInterPT) processes based on keto–enol tautomerization was found in phenazine-2,3-diol PD1 and its monoalkoxy derivative PD2 in a glassy matrix at 77 K: the colorless solutions of enol forms PD1-E and PD2-E at 298 K transformed into orange-colored solutions of keto forms PD1-K and PD2-K upon photoirradiation (λ = 385 nm) at 77 K. Furthermore, this report is the first to achieve the single-crystal X-ray structural analyses of phenazine-2,3-diol PD1 and its monoalkoxy derivative PD2, since the report on the synthesis of PD1 70 years ago. Indeed, it was found that PD1 and PD2 molecules exist in the keto form (PD1-K) and the enol form (PD2-E), respectively, in the crystal, and the neighboring PD1-K and PD2-E molecules are linked by one-dimensional intermolecular NH⋯O and OH⋯N hydrogen bonding, respectively. The fact suggests strongly that for PD1 and PD2, the formation of continuous intermolecular hydrogen bonding in aggregates such as in a glassy matrix at 77 K is involved in the keto–enol tautomerization of phenazine-2,3-diol derivatives based on ESInterPT. More interestingly, the color and the photoabsorption spectrum of the solids obtained by sublimation of crystals of PD2-E are similar to those for the crystals of PD1-K, indicating that the PD2 molecule exists in the keto form (PD2-K) in the solid of the sublimate. Therefore, this study provides a valuable insight for a greater understanding of the keto–enol tautomerization of diazaacene-diol derivatives and their photophysical properties in the solution and in the solid state.
Introduction
Excited-state proton transfer (ESPT)1 is a fundamental process in chemistry and biology that has gained significant attention due to its diverse applications,2 including in white light-emitting diodes (LEDs),3 light-driven proton pumps by bacteriorhodopsin,4 and fluorescent protein-based biosensors for cation detection.5 From a molecular structure perspective, the ESPT process can be classified into intramolecular and intermolecular proton transfer processes (ESIntraPT and ESInterPT, Scheme 1). In most cases, these processes are caused by tautomer species possessing different electron density distributions such as keto–enol tautomerization.6 If the keto–enol tautomerization based on the ESPT processes occurs in a chromophore, such a dye molecule can induce a color change due to alternation of the π electronic state, that is, so-called photochromism. In addition, tautomerization in a fluorophore often induces a significant redshift in the fluorescence wavelength, leading to a substantial Stokes shift (SS) in the range of 6000–12![[thin space (1/6-em)]](https://www.rsc.org/images/entities/char_2009.gif) 000 cm−1. However, the ESIntraPT process requires the presence of intramolecular hydrogen bonding between proton donor and acceptor groups, that is, it is limited to molecules containing 5- or 6-membered ring hydrogen bonding structures, such as 3-hydroxyflavone,7 2-hydroxybenzophenone,8 and 2-(2′-hydroxyphenyl)benzothiazole (Scheme 1a).9 On the other hand, the ESInterPT process has been found in molecules without 5- or 6-membered ring hydrogen bonding structures, including 3-hydroxy-2-naphthanilide,10 lumazine,11 anthracen-2-yl-3-phenylurea,12 7-hydroxyquinoline,13 7-azaindole,14 and 2-hydroxyphenazine (Scheme 1b and c).15 Among them, Ogawa et al. revealed that 2-hydroxyphenazine exhibits photochromic properties by ESInterPT:15 when a 2-methyltetrahydrofuran (2-MeTHF) solution containing 2-hydroxyphenazine was irradiated with UV light at 365 nm at 77 K, a new photoabsorption band appeared in the long-wavelength region (ca. 450–600 nm) with a decrease in the absorbance of the short-wavelength photoabsorption band (ca. 400–450 nm). Indeed, the color changes from pale yellow to purple-red with UV light irradiation. They proposed that the color change was due to the ESInterPT from the enol (E) to the keto (K) forms in hydrogen-bonded aggregates, because the long-wavelength photoabsorption bands are assigned to the keto (K) form (Scheme 1c). Moreover, it has been reported that the keto–enol tautomerization of 7-hydroxyquinoline (7HQ) takes place through the ESPT along a hydrogen-bonded ammonia wire and a hydrogen-bonded alcohol chain which is mediated by protic solvent molecules.16 However, studies based on experimental data for photochromism through the ESInterPT process are limited.
000 cm−1. However, the ESIntraPT process requires the presence of intramolecular hydrogen bonding between proton donor and acceptor groups, that is, it is limited to molecules containing 5- or 6-membered ring hydrogen bonding structures, such as 3-hydroxyflavone,7 2-hydroxybenzophenone,8 and 2-(2′-hydroxyphenyl)benzothiazole (Scheme 1a).9 On the other hand, the ESInterPT process has been found in molecules without 5- or 6-membered ring hydrogen bonding structures, including 3-hydroxy-2-naphthanilide,10 lumazine,11 anthracen-2-yl-3-phenylurea,12 7-hydroxyquinoline,13 7-azaindole,14 and 2-hydroxyphenazine (Scheme 1b and c).15 Among them, Ogawa et al. revealed that 2-hydroxyphenazine exhibits photochromic properties by ESInterPT:15 when a 2-methyltetrahydrofuran (2-MeTHF) solution containing 2-hydroxyphenazine was irradiated with UV light at 365 nm at 77 K, a new photoabsorption band appeared in the long-wavelength region (ca. 450–600 nm) with a decrease in the absorbance of the short-wavelength photoabsorption band (ca. 400–450 nm). Indeed, the color changes from pale yellow to purple-red with UV light irradiation. They proposed that the color change was due to the ESInterPT from the enol (E) to the keto (K) forms in hydrogen-bonded aggregates, because the long-wavelength photoabsorption bands are assigned to the keto (K) form (Scheme 1c). Moreover, it has been reported that the keto–enol tautomerization of 7-hydroxyquinoline (7HQ) takes place through the ESPT along a hydrogen-bonded ammonia wire and a hydrogen-bonded alcohol chain which is mediated by protic solvent molecules.16 However, studies based on experimental data for photochromism through the ESInterPT process are limited.
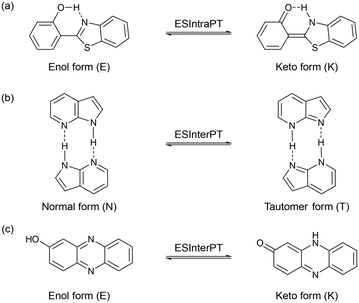 | ||
| Scheme 1 Schematic representation of (a) ESIntraPT for 2-(2′-hydroxyphenyl)benzothiazole, (b) ESInterPT for 7-azaindole, and (c) ESInterPT for 2-hydroxyphenazine. | ||
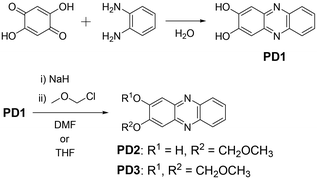
In our previous study,17 we designed and developed phenazinone derivatives PZ1 and PZ2 having a similar structure to the keto form of phenazine-2,3-diol PD1 and its monoalkoxy derivative PD2, respectively (Fig. 1 and 2). It was found that in THF, PZ1 and PZ2 exhibited an intense photoabsorption band (photoabsorption maximum λabsmax = ca. 480 nm and the molar extinction coefficient (ε) = ca. 11![[thin space (1/6-em)]](https://www.rsc.org/images/entities/char_2009.gif) 000 M−1 cm−1) originating from the phenazinone skeleton, while PD1 showed a weak photoabsorption band with an ε of ca. 1700 M−1 cm−1 at around 480 nm which is assigned to the formation of phenoxide ions by the partial deprotonation of the hydroxy groups.18 This decisive result inspired us to explore the possibility of ESPT in phenazine-2,3-diol derivatives which would offer an important insight into the photochromism of diazaacene-diols such as diaza-naphthalene and diaza-anthracence derivatives with two hydroxy groups.
000 M−1 cm−1) originating from the phenazinone skeleton, while PD1 showed a weak photoabsorption band with an ε of ca. 1700 M−1 cm−1 at around 480 nm which is assigned to the formation of phenoxide ions by the partial deprotonation of the hydroxy groups.18 This decisive result inspired us to explore the possibility of ESPT in phenazine-2,3-diol derivatives which would offer an important insight into the photochromism of diazaacene-diols such as diaza-naphthalene and diaza-anthracence derivatives with two hydroxy groups.
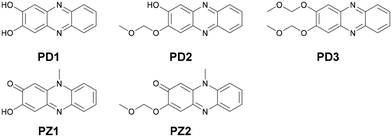 | ||
| Fig. 1 Chemical structures of phenazine-2,3-diol derivatives PD1–3 and phenazinone derivatives PZ1 and PZ2. | ||
For this purpose, in this study, we performed photoabsorption and fluorescence spectral measurements of phenazine-2,3-diol derivatives PD1–3 in solution, a glassy matrix at 77 K, and the solid state, in comparison with those of phenazinone derivatives PZ1 and PZ2 (Fig. 1 and Scheme 2, see the ESI† for a detailed synthetic procedure). It is expected that PD1 and PD2 with hydroxy groups will exhibit photochromic properties based on keto–enol tautomerization similar to 2-hydroxyphenazine possessing ESInterPT, whereas PD3 without hydroxy groups does not show such photochromic characteristics. Meanwhile, this report is the first to achieve the single-crystal X-ray structural analyses of PD1 and PD2, although the synthesis of PD1 was reported 70 years ago and its characterization was finally determined by NMR spectral analysis 15 years ago.19 Indeed, it was found that the PD1 molecule exists in the keto form (PD1-K) in the crystal, but the PD2 molecule exists in the enol form (PD2-E) in the crystal (Fig. 2). Herein, we report an investigation of the photochromic properties of PD1 and PD2 through the ESInterPT processes based on keto–enol tautomerization.
Results and discussion
Optical properties
The photoabsorption and fluorescence spectra of PD1–3, PZ1, and PZ2 in THF are shown in Fig. 3, and their optical data are summarized in Table 1. PD1–3, PZ1, and PZ2 showed a moderate and narrow photoabsorption band (λabsmax = 361–390 nm and an ε of ca. 10![[thin space (1/6-em)]](https://www.rsc.org/images/entities/char_2009.gif) 500–17
500–17![[thin space (1/6-em)]](https://www.rsc.org/images/entities/char_2009.gif) 500 M−1 cm−1), which is assigned to the S0 → S3 (ππ*) transition originating from the phenazine skeleton or a partial phenazinone skeleton through time-dependent density functional theory (TD-DFT) calculations (Fig. 16, Table S13, and Fig. S26†) as discussed later. Moreover, PD1, PZ1, and PZ2 exhibited another λabsmax at longer wavelength regions: a broad photoabsorption band with an ε of 1700 M−1 cm−1 at 480 nm for PD1, an ε of 10
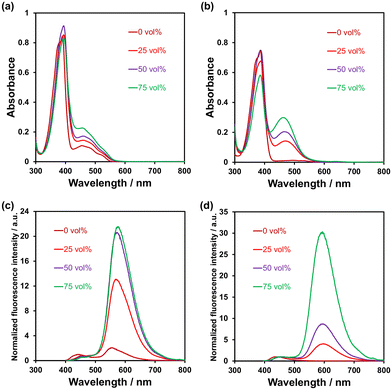
500 M−1 cm−1), which is assigned to the S0 → S3 (ππ*) transition originating from the phenazine skeleton or a partial phenazinone skeleton through time-dependent density functional theory (TD-DFT) calculations (Fig. 16, Table S13, and Fig. S26†) as discussed later. Moreover, PD1, PZ1, and PZ2 exhibited another λabsmax at longer wavelength regions: a broad photoabsorption band with an ε of 1700 M−1 cm−1 at 480 nm for PD1, an ε of 10![[thin space (1/6-em)]](https://www.rsc.org/images/entities/char_2009.gif) 900 M−1 cm−1 at 478 nm for PZ1, and an ε of 8300 M−1 cm−1 at 487 nm for PZ2. The TD-DFT calculations revealed that for PZ1 and PZ2, the photoabsorption band in longer wavelength regions is due to the S0 → S1 (ππ*) transition originating from the phenazinone skeleton (Table S13 and Fig. S26†). On the other hand, for PD1, the weak photoabsorption band at around 480 nm is ascribable to the formation of phenoxide ions by the partial deprotonation of the hydroxy groups (Fig. 5).17,18 Indeed, as evidence of the formation of phenoxide ions, for PD1, an increase in the absorbance at around 480 nm was observed with increasing water content in the THF solution (Fig. 4a); meanwhile, when water was added to the THF solution of PD2, a photoabsorption band appeared at 480 nm and the absorbance increased with the increase in water content (Fig. 4b). On the other hand, such a photoabsorption spectral change was not observed upon addition of water to the THF solution of PD3 (Fig. S30a†). Moreover, for the DMSO solution of PD1 and PD2, the photoabsorption band at around 480 nm increased upon addition of NaOH aq. and decreased upon addition of HCl aq. (Fig. S28d and S29d†), which suggests an increase and a decrease in phenoxide ions, respectively. On the other hand, such a photoabsorption spectral change was not observed in the DMSO solution of PD3 upon addition of HaOH aq. or HCl aq. (Fig. S30c†). Evidently, these results indicate that the enhancements of the absorbance at around 480 nm upon the addition of water to the PD1 and PD2 solutions are attributed to the formation of the phenoxide ion species PD1-P and PD2-P with the partially deprotonated hydroxy moiety (Fig. 5), as discussed later in 1H NMR spectral measurements. Thus, for PD1, the reasonable reason for the appearance of the photoabsorption band originating from the phenoxide ions in absolute THF could be attributable to the contribution of PD1-P′ with intramolecular hydrogen bonding and/or intramolecular proton transfer (Fig. 5a), leading to stabilization of the phenoxide species by charge dispersion.20
900 M−1 cm−1 at 478 nm for PZ1, and an ε of 8300 M−1 cm−1 at 487 nm for PZ2. The TD-DFT calculations revealed that for PZ1 and PZ2, the photoabsorption band in longer wavelength regions is due to the S0 → S1 (ππ*) transition originating from the phenazinone skeleton (Table S13 and Fig. S26†). On the other hand, for PD1, the weak photoabsorption band at around 480 nm is ascribable to the formation of phenoxide ions by the partial deprotonation of the hydroxy groups (Fig. 5).17,18 Indeed, as evidence of the formation of phenoxide ions, for PD1, an increase in the absorbance at around 480 nm was observed with increasing water content in the THF solution (Fig. 4a); meanwhile, when water was added to the THF solution of PD2, a photoabsorption band appeared at 480 nm and the absorbance increased with the increase in water content (Fig. 4b). On the other hand, such a photoabsorption spectral change was not observed upon addition of water to the THF solution of PD3 (Fig. S30a†). Moreover, for the DMSO solution of PD1 and PD2, the photoabsorption band at around 480 nm increased upon addition of NaOH aq. and decreased upon addition of HCl aq. (Fig. S28d and S29d†), which suggests an increase and a decrease in phenoxide ions, respectively. On the other hand, such a photoabsorption spectral change was not observed in the DMSO solution of PD3 upon addition of HaOH aq. or HCl aq. (Fig. S30c†). Evidently, these results indicate that the enhancements of the absorbance at around 480 nm upon the addition of water to the PD1 and PD2 solutions are attributed to the formation of the phenoxide ion species PD1-P and PD2-P with the partially deprotonated hydroxy moiety (Fig. 5), as discussed later in 1H NMR spectral measurements. Thus, for PD1, the reasonable reason for the appearance of the photoabsorption band originating from the phenoxide ions in absolute THF could be attributable to the contribution of PD1-P′ with intramolecular hydrogen bonding and/or intramolecular proton transfer (Fig. 5a), leading to stabilization of the phenoxide species by charge dispersion.20
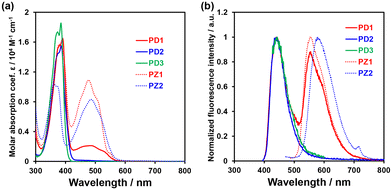 | ||
| Fig. 3 (a) Photoabsorption and (b) fluorescence (λex = 390 nm for PD1, 385 nm for PD2, 385 nm for PD3, 378 nm for PZ1, and 361 nm for PZ2) spectra of PD1–3, PZ1, and PZ2 (1.0 × 10⁻⁴ M) in THF. | ||
| Dye | λ absmax/nm (ε/M−1 cm−1) | λ flmax/nm (Φfla) |
τ
fl![[thin space (1/6-em)]](https://www.rsc.org/images/entities/char_2009.gif) /ns
/ns |
|---|---|---|---|
| a Fluorescence quantum yields (λex = 390 nm and 480 nm for PD1, 385 nm for PD2, 385 nm for PD3, 378 nm for PZ1, and 361 nm for PZ2) were determined using a calibrated integrating sphere system. b Fluorescence lifetimes. c Photoexcited at 366 nm. d Photoexcited at 451 nm. e In our previous study.17 | |||
| PD1 | 390 (17![[thin space (1/6-em)]](https://www.rsc.org/images/entities/char_2009.gif) 500) 500) |
440, 555 (<0.02) | 2.13, 3.54c |
| 480 (1700) | 558 (0.09) | 2.89d | |
| PD2 | 385 (15![[thin space (1/6-em)]](https://www.rsc.org/images/entities/char_2009.gif) 500) 500) |
443 (<0.02) | 2.41c |
| PD3 | 385 (16![[thin space (1/6-em)]](https://www.rsc.org/images/entities/char_2009.gif) 500) 500) |
443 (<0.02) | 2.70c |
| PZ1 | 378 (15![[thin space (1/6-em)]](https://www.rsc.org/images/entities/char_2009.gif) 700) 700) |
554 (003) | 3.40d |
478 (10![[thin space (1/6-em)]](https://www.rsc.org/images/entities/char_2009.gif) 900) 900) |
|||
| PZ2 | 361 (10![[thin space (1/6-em)]](https://www.rsc.org/images/entities/char_2009.gif) 500) 500) |
579 (0.04) | 3.26d |
| 487 (8300) | |||
In the corresponding fluorescence spectra upon photoexcitation (λex) at 361–390 nm (Fig. 3b), PD1, PD2, and PD3 showed a fluorescence maximum (λflmax) at around 440 nm originating from the phenazine skeleton, and PZ1 and PZ2 showed a λflmax at around 554–579 nm originating from the phenazinone skeleton. It should be noted here that PD1 exhibited another fluorescence band with λflmax at 555 nm and its fluorescence intensity increased with increasing water content in THF solution (Fig. 4c), as in the case of photoabsorption spectra. Similarly, for PD2, the appearance of a fluorescence band with λflmax at 579 nm upon addition of water to the THF solution and the enhancement of fluorescence intensity with the increase in water content were observed (Fig. 4d). Furthermore, for PD1 in THF with and without water and PD2 in THF with water, fluorescence bands at 550–580 nm were also observed with λex at 480 nm for PD1 and at 463–497 nm for PD2 (Fig. S28 and S29†). Therefore, based on these results, the fluorescence bands of PD1 and PD2 at 550–580 nm can be assigned to fluorescence emission originating from their phenoxide species PD1-P (PD1-P′) and PD2-P (Fig. 5). Interestingly, the fluorescence quantum yields (Φfl ≤ 0.04 for PD2, PD3, PZ1 and PZ2) for the fluorescence band originating from the phenazine or phenazinone skeleton are considerably lower than that (Φfl = 0.09 for PD1) for the fluorescence band originating from phenoxide species (Table 1). Furthermore, the formation of the phenoxide ion species PD1-P and PD2-P with the partially deprotonated hydroxy moiety, that is, the existence of the enol (PD1 and PD2)–phenoxide ion (PD1-P and PD2-P) equilibrium is evident from the temperature-dependent photoabsorption and fluorescence spectral measurements of PD1–3 in 2-methylTHF (2-MeTHF). For the solutions of PD1 and PD2, the photoabsorption and fluorescence bands originating from phenoxide species in a longer wavelength region decrease with decreasing temperature, but for PD3, the photoabsorption and fluorescence bands originating from the phenazine skeleton monotonically increase with increasing temperature (Fig. S32–S34†).
The time-resolved fluorescence lifetime measurements demonstrated that the fluorescence lifetime (τfl) values of PD1–3, PZ1, and PZ2 were estimated to be 2.13 ns (λflmax = 440 nm) and 3.54 ns (λflmax = 555 nm) with λex at 366 nm and 2.89 ns (λflmax = 558 nm) with λex at 451 nm for PD1, 2.41 ns (λex = 366 nm) for PD2, 2.70 ns (λex = 366 nm) for PD3, 3.40 ns (λex = 451 nm) for PZ1, and 3.26 ns (λex = 451 nm) for PZ2 (Table 1 and Fig. S35†). The fact clearly indicates that the phenazine-2,3-diol and phenazinone derivatives in solvent at room temperature (298 K) exhibit fluorescence emission properties with the τfl values in the order of ns.
1H NMR spectral measurements
In order to determine the chemical species of PD1 and PD2 in solvent, we performed 1H NMR spectral measurements on PD1 and PD2 in THF-d8 with and without the addition of deuterated water (D2O), in comparison with those on PZ1 and PZ2 (Fig. 6 and S9–S14†). The 1H NMR spectra of PD1 in THF-d8 both with and without the addition of D2O are broadened (Fig. 6a). On the other hand, the 1H NMR spectra of PD2 show sharp signals in THF-d8 without D2O, but they become broad signals upon the addition of D2O to the THF-d8 solution (Fig. 6b). Meanwhile, the 1H NMR spectra of PD1 and PD2 are totally different from those of PZ1 and PZ2 which show sharp signals: the chemical shifts (δ) of the proton (Ha) adjacent to the hydroxy group at 7.1–7.3 ppm and the proton (Hf) adjacent to the methoxymethoxy group at 7.4–7.6 ppm for PD1 and PD2 show a considerable downfield shift, compared to the corresponding ones (the α-proton (Ha) of the carbonyl moiety at 6.1–6.3 ppm and the proton (Hf) adjacent to the hydroxy group at 6.8–7.0 ppm) for PZ1 and PZ2. Moreover, it is worth mentioning here that for PD1 and PD2, the ratio of the integrated signal of Ha decreases with an increase in D2O content in the THF-d8 solution (the integrated intensity of Ha = 1, 0.84, 0.82, and 0.78 for 0, 25, 50 and 75 vol% water content, respectively), indicating hydrogen/deuterium exchange (H/D exchange) between D2O and the enolate ion Keto1 in a resonance hybrid, as shown in Scheme 3, that is, phenoxide ions (PD1-P and PD2-P), Keto1 and the phenazinone structure Keto2 are present as keto–enol anion resonance structures formed through the enol–enolate ion equilibrium. The fact indicates that not only do PD1 and PD2 exist mainly as the phenoxide ion and the diol or mono-ol structure through the enol–enolate ion equilibrium between them, respectively, but also Keto2 is the most minor contributor in the resonance hybrid and thus the formation of the phenazinone structure is negligible in the solutions. Not surprisingly, such H/D exchange was not observed in the case of PD3 (Fig. S14†).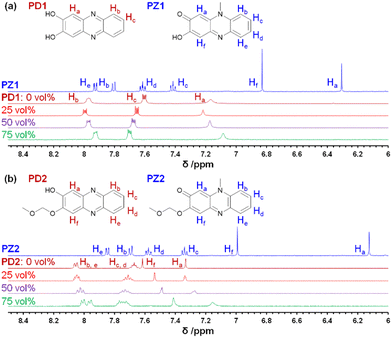 | ||
| Fig. 6 1H NMR spectra of (a) PD1 in THF-d8 without D2O and with 25–75 vol% D2O content and PZ1 in THF-d8 and (b) PD2 in THF-d8 without D2O and with 25–75 vol% D2O content and PZ2 in THF-d8. | ||
 | ||
| Scheme 3 Proposed mechanism for the formation of deuterated PD1-D and PD2-D by hydrogen/deuterium exchange through the enol–enolate ion equilibrium. | ||
ESInterPT and photochromic properties
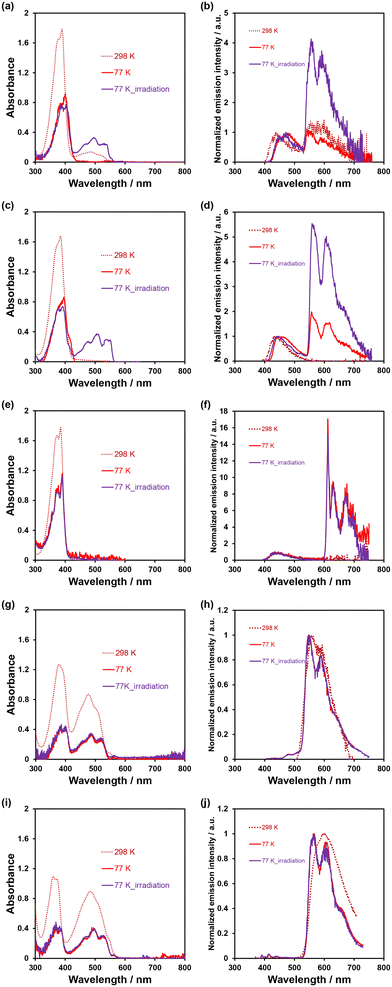
In order to investigate the ESInterPT and photochromic properties of phenazine-2,3-diol (PD1) and its alkoxy derivatives (PD2 and PD3), we conducted photoabsorption and photoluminescence spectral measurements of PD1–3, PZ1, and PZ2 in 2-MeTHF at room temperature (298 K) and in a glassy matrix of 2-MeTHF at 77 K (Fig. 7) before and after photoirradiation with monochromic light at 385 nm. The photoabsorption and photoluminescence spectral properties of PD1–3, PZ1, and PZ2 in 2-MeTHF at 298 K were similar to those in THF at 298 K (Fig. 3 and 7). Meanwhile, the photoabsorption spectra of PD1–3, PZ1, and PZ2 at 77 K were similar to those at 298 K, but they exhibited a vibronically-structured photoabsorption band (Fig. 7a, c, e, g, and i). Interestingly, for PD1, the broad photoabsorption band at 480 nm disappeared at 77 K (Fig. 7a), indicating a complete shift in the enol–enolate ion equilibrium from the enolate ion form (PD1-P) to the enol form (PD1-E) (Scheme 3). It is worth noting here that upon photoirradiation (λ = 385 nm) at 77 K, the photoabsorption spectra of PD1 and PD2 exhibited new vibronically-structured photoabsorption bands in the range of 400 nm–550 nm (Fig. 7a and c) which are similar to those of PZ1 and PZ2, whereas the photoabsorption spectra of PD3, PZ1, and PZ2 did not undergo appreciable changes in the absorbance and shape (Fig. 7e, g, and i). This result indicates the formation of keto forms PD1-K and PD2-K upon photoirradiation at 77 K, that is, the photochromism of PD1 and PD2 through the ESInterPT processes based on keto–enol tautomerization from PD1-E and PD2-E to PD1-K and PD2-K, respectively (Fig. 2). Actually, upon photoirradiation (λ = 385 nm) at 77 K, the colorless solutions of PD1 and PD2 transformed into orange-colored solutions (Fig. 8a–f), which are similar in color to the solutions of PZ1 and PZ2 (Fig. S41 and S42†). When the orange-colored solutions were left to stand at room temperature, they recovered to their original colorless form. On the other hand, PD3 solution remained colorless even after photoirradiation (λ = 385 nm) at 77 K (Fig. 8g–i).The photoluminescence spectral measurement before and after photoirradiation at 77 K provided conclusive evidence for the formation of keto forms of PD1 and PD2 based on keto–enol tautomerization. Indeed, in the corresponding photoluminescence spectra of PD1 and PD2, new vibronically-structured photoluminescence bands appeared in the range of 500–750 nm after photoirradiation (λ = 385 nm) at 77 K, although they are also observed before photoirradiation (λ = 385 nm) because of the photoabsorption bands at 400–550 nm (Fig. 7a and c) which emerged upon photoexcitation (λex = 400 nm for PD1 and 395 nm for PD2) during the photoluminescence spectral measurement. For PD3 at 77 K, a new vibronically-structured photoluminescence band appeared in the range of 600–750 nm, but the photoluminescence band remained constant in intensity and shape even after photoirradiation (λ = 385 nm). On the other hand, the photoluminescence spectra of PZ1 and PZ2 at 77 K exhibited vibronically-structured photoluminescence bands in the range of 500–750 nm (Fig. 7h and j), but they are similar in intensity and shape before and after photoirradiation (λ = 385 nm) at 77 K. Furthermore, in order to assign the origins of photoluminescence bands of PD1–3, PZ1, and PZ2 at 77 K, we performed phosphorescence spectral measurements with an initial delay of 100 μs and time resolved phosphorescence decay analysis (Fig. S43–S46†). For PD3 at 77 K, a phosphorescence band with a long lifetime (τpl = 37.3 ms, Fig. S43 and S44†) was observed in the range of 600–750 nm which is similar to the photoluminescence spectrum without initial delay (Fig. 7f). Obviously, the fact reveals that for PD3 at 77 K, the vibronically-structured photoluminescence band at 600–750 nm could be assigned to the phosphorescence emission originating from the phenazine skeleton. However, for PZ1 and PZ2 before and after photoirradiation (λ = 385 nm) at 77 K, the phosphorescence spectrum was not observed, thus the photoluminescence bands at 500–750 nm are assigned to the fluorescence emission originating from the phenazinone skeleton, as in the case of 298 K. On the other hand, PD1 and PD2 before and after photoirradiation (λ = 385 nm) at 77 K exhibited phosphorescence bands with long lifetimes (τpl = 28.6 ms for PD1 and 32.0 ms for PD2) in the range of 600–750 nm which are different in the range of emission wavelengths from the photoluminescence spectrum (500–750 nm) without initial delay (Fig. 7b and d) but are similar in that to the photoluminescence (phosphorescence) spectrum (600–750 nm) of PD3 at 77 K (Fig. 7f). These observations indicate that for the photoluminescence characteristics of PD1 and PD2 upon photoirradiation (λ = 385 nm) at 77 K, the photoluminescence bands at 500–750 nm are assigned to the fluorescence emission originating from the partially formed PD1-K and PD2-K, and the photoluminescence bands at 600–750 nm are assigned to the phosphorescence emission originating from the residual PD1-E and PD2-E, whereas the photoluminescence bands before photoirradiation (λ = 385 nm) at 77 K are mainly due to the phosphorescence emission originating from PD1-E and PD2-E. Therefore, this result strongly supports the photochromism of PD1 and PD2 through the ESInterPT processes based on keto–enol tautomerization in the glassy matrix at 77 K. Furthermore, the appearance of photoabsorption bands originating from the keto forms PD1-K and PD2-K upon photoirradiation (λ = 385 nm) at 77 K was observed even in a low-concentration solution of 10 μM (Fig. S40†). The fact indicates that an aggregate of the enol form (PD1-E and PD2-E) is formed through the intermolecular hydrogen bonding in the glassy matrix at a low temperature, and then ESInterPT proceeds rapidly because in the excited state, the keto form becomes more stable than the enol form, as reported by Ogawa et al.15
Single crystal X-ray structural analysis
One would make the assumption that the ESInterPT process requires the presence of intermolecular hydrogen bonding between proton donors and acceptors. Thus, to investigate the formation of the hydrogen bonding for PD1 and PD2 in the aggregate state, single-crystal X-ray structural analyses for PD1 and PD2 were performed, in comparison with those for PZ1 and PZ2 in our previous study17 (Fig. 9 and 10). Surprisingly, this report is the first to achieve the crystal structural analyses of phenazine-2,3-diol PD1 and its monoalkoxy derivative PD2, although the synthesis of PD1 was reported 70 years ago19a and its characterization was fully determined by NMR spectral analysis 15 years ago.19b A crystal of PD1 was obtained by sublimation of a powdery solid, because recrystallization from solution provided the powdery solid. Meanwhile, a crystal of PD2 was prepared by recrystallization from an ethanol solution. It is worth mentioning here that the PD1 molecule exists in the keto form (PD1-K) in the crystal, but the PD2 molecule exists in the enol form (PD2-E) in the crystal (Fig. 9a and b), although the crystal structure of PD2-E has two crystallographically independent molecules in which each molecule has slightly different bond lengths and angles (Fig. S3†). Actually, for PD1, the observed O(1)–C(2) and O(2)C(3) bond lengths are 1.272(2) Å and 1.344(3) Å, respectively, which are typical C![[double bond, length as m-dash]](https://www.rsc.org/images/entities/char_e001.gif) O double bond and C−O single bond lengths, respectively.21 Indeed, the C
O double bond and C−O single bond lengths, respectively.21 Indeed, the C![[double bond, length as m-dash]](https://www.rsc.org/images/entities/char_e001.gif) O double bond and C–O single bond lengths of PD1-K are similar to those (1.2566(18) Å and 1.2418(16) Å for O(1)–C(2) bond length and 1.3436(18) Å and 1.3582(15) Å for O(2)–C(3) bond length, respectively) of PZ1 and PZ2 (Fig. 9c and d). On the other hand, for PD2-E, the observed bond lengths of O(1)–C(2) and O(2)–C(3) are 1.3451(16) Å and 1.3623(16) Å, respectively, indicating C–O single bond lengths. Thus, our work first verified the existence of keto and enol forms for phenazine2,3-diol and its alkoxy derivative by single-crystal X-ray structural analyses. Furthermore, it was found that the PD1-K molecule is in the syn-conformation where the hydrogen atom of the hydroxy group is directed toward the oxygen atom of the carbonyl group, indicating the formation of intramolecular hydrogen bonding between them (O(2)H(2)⋯O(1) angle = ca. 117.73° and O(1)⋯O(2) distance = 2.577 Å), as in the case of PZ1 (O(2)H(2)⋯O(1) angle = ca. 114.89° and O(1)⋯O(2) distance = 2.696 Å). Meanwhile, the PD2-E molecule is in the anti-conformation where the hydrogen atom of the hydroxy group faces in the direction opposite to the oxygen atom of the methoxymethoxy group, indicating a lack of intramolecular hydrogen bonding between them. As a result, syn-PD1-K molecules form the intermolecular NH⋯O hydrogen bonding with N(1)H(1)⋯O(1) angle = ca. 164° and N(1)⋯O(1) distance = 2.690 Å between the hydrogen atom of the amino moiety and the oxygen atom of the carbonyl group (Fig. 10a). On the other hand, anti-PD2-E molecules form the intermolecular OH⋯N hydrogen bonding with O(1)H(1)⋯N(1) angle = ca. 174° and O(1)⋯N(1) distance = 2.722 Å between the hydrogen atom of the hydroxy group and the nitrogen atom of the phenazine skeleton (Fig. 10b). Hence, neighboring syn-PD1-K and anti-PD2-E molecules are linked by the intermolecular NH⋯O hydrogen bonding and OH⋯N hydrogen bonding, respectively, to form one-dimensional molecular chains. Meanwhile, PZ1 molecules form a dimer by the intermolecular OH⋯O hydrogen bonding with O(2)H(2)⋯O(1) angle = ca. 147° and O(2)⋯O(1) distance = 2.698 Å between the hydrogen atom of the hydroxy group and the oxygen atom of the carbonyl group (Fig. 10c). Of course, such intramolecular and intermolecular hydrogen bonding were not observed in the crystal of PZ2 (Fig. 10d). Thus, the fact suggests strongly that for PD1 and PD2, the formation of continuous intermolecular hydrogen bonding in the aggregate is involved in the keto–enol tautomerization of phenazine-2,3-diol derivatives based on ESInterPT.
O double bond and C–O single bond lengths of PD1-K are similar to those (1.2566(18) Å and 1.2418(16) Å for O(1)–C(2) bond length and 1.3436(18) Å and 1.3582(15) Å for O(2)–C(3) bond length, respectively) of PZ1 and PZ2 (Fig. 9c and d). On the other hand, for PD2-E, the observed bond lengths of O(1)–C(2) and O(2)–C(3) are 1.3451(16) Å and 1.3623(16) Å, respectively, indicating C–O single bond lengths. Thus, our work first verified the existence of keto and enol forms for phenazine2,3-diol and its alkoxy derivative by single-crystal X-ray structural analyses. Furthermore, it was found that the PD1-K molecule is in the syn-conformation where the hydrogen atom of the hydroxy group is directed toward the oxygen atom of the carbonyl group, indicating the formation of intramolecular hydrogen bonding between them (O(2)H(2)⋯O(1) angle = ca. 117.73° and O(1)⋯O(2) distance = 2.577 Å), as in the case of PZ1 (O(2)H(2)⋯O(1) angle = ca. 114.89° and O(1)⋯O(2) distance = 2.696 Å). Meanwhile, the PD2-E molecule is in the anti-conformation where the hydrogen atom of the hydroxy group faces in the direction opposite to the oxygen atom of the methoxymethoxy group, indicating a lack of intramolecular hydrogen bonding between them. As a result, syn-PD1-K molecules form the intermolecular NH⋯O hydrogen bonding with N(1)H(1)⋯O(1) angle = ca. 164° and N(1)⋯O(1) distance = 2.690 Å between the hydrogen atom of the amino moiety and the oxygen atom of the carbonyl group (Fig. 10a). On the other hand, anti-PD2-E molecules form the intermolecular OH⋯N hydrogen bonding with O(1)H(1)⋯N(1) angle = ca. 174° and O(1)⋯N(1) distance = 2.722 Å between the hydrogen atom of the hydroxy group and the nitrogen atom of the phenazine skeleton (Fig. 10b). Hence, neighboring syn-PD1-K and anti-PD2-E molecules are linked by the intermolecular NH⋯O hydrogen bonding and OH⋯N hydrogen bonding, respectively, to form one-dimensional molecular chains. Meanwhile, PZ1 molecules form a dimer by the intermolecular OH⋯O hydrogen bonding with O(2)H(2)⋯O(1) angle = ca. 147° and O(2)⋯O(1) distance = 2.698 Å between the hydrogen atom of the hydroxy group and the oxygen atom of the carbonyl group (Fig. 10c). Of course, such intramolecular and intermolecular hydrogen bonding were not observed in the crystal of PZ2 (Fig. 10d). Thus, the fact suggests strongly that for PD1 and PD2, the formation of continuous intermolecular hydrogen bonding in the aggregate is involved in the keto–enol tautomerization of phenazine-2,3-diol derivatives based on ESInterPT.
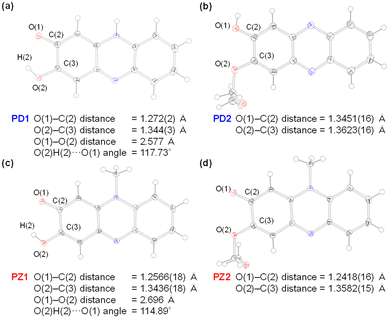 | ||
| Fig. 9 X-ray crystal structures of (a) PD1, (b) PD2, (c) PZ1, and (d) PZ2 measured at 100 K. Ellipsoids are shown at the 50% probability level. | ||
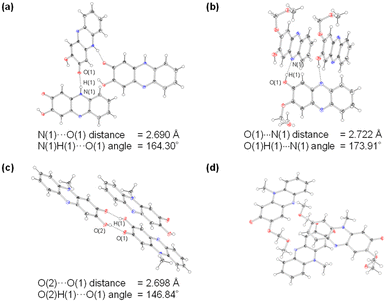 | ||
| Fig. 10 Crystal packing structures of (a) PD1, (b) PD2, (c) PZ1, and (d) PZ2 measured at 100 K. The hydrogen bonds are indicated by dotted lines. Ellipsoids are shown at the 50% probability level. | ||
Solid-state optical properties
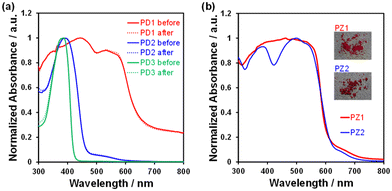
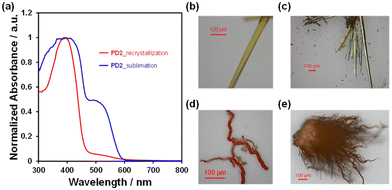
In order to explore the expression of chromism based on the keto–enol tautomerization of PD1–3 in the solid state, we performed UV-vis diffuse reflectance-absorption and fluorescence spectral measurements of the solids before and after photoirradiation (λ = 385 nm) at 298 K and 77 K and differential scanning calorimetry (DSC) of the solids after heating and cooling. The colors at 298 K were dark red for PD1-K, yellow for PD2-E, and white for PD3 (Fig. 11a, e, and i). Thus, the color of PD1-K is similar to those of PZ1 and PZ2 which is attributed to the formation of the keto form in the crystal (Fig. 11m and n). Indeed, the photoabsorption band of PD1-K in the solid state is significantly broadened in a longer wavelength region with an onset of ca. 650 nm (Fig. 12a) compared with those in THF (Fig. 3a), but it is similar to those of PZ1 and PZ2 in the solid state (Fig. 12b). On the other hand, the photoabsorption maximum wavelengths (λabs–solidmax) of PD2-E and PD3 in the solid state appeared at around 385 nm, which are similar to those in THF (Fig. 3a). It was found that for PD1–3, there were no changes in their colors and photoabsorption spectra before and after photoirradiation (λ = 385 nm) at 298 K and 77 K (Fig. 11b–d, f–h, j–i, and 12a), although we could not obtain the photoabsorption spectra at 77 K due to technical difficulties. Meanwhile, the precise observation of fluorescence spectra for PD1–3, PZ1, and PZ2 in the solid state was difficult due to their feeble solid-state fluorescence properties.The DSC analysis of PD1–3 provided a valuable insight into the chromism of phenazine-2,3-diol derivatives based on the keto–enol tautomerization (Fig. 13a). The DSC curves of PD1–3 showed that in the cooling process from 25 °C to −80 °C, there is no observable peak for the DSC traces. In the heating process from 25 °C to 250 °C, the DSC trace of PD1-K has no observable peak; meanwhile, the DSC trace of PD3 has only one sharp endothermic melting (Tm) peak at 137 °C. On the other hand, the DSC trace of PD2-E shows an endothermic peak associated with sublimation (Ts) at 181 °C, and then an exothermic oxidative decomposition (Td)22 at 188 °C which is also supported by thermogravimetry and differential thermal analysis (TG-DTA) (Fig. 13b and S56†). Interestingly, for PD2, a wire-like solid was obtained as the sublimate (Fig. 14d and e) by heating the needle-like crystal (Fig. 14b and c) of PD2-E at 133 °C under vacuum. The wire-like solid of the sublimate for PD2 shows a red color and a broad photoabsorption band in a longer wavelength region with an onset of ca. 600 nm (Fig. 14a), which are similar to the colors and the photoabsorption spectra of the crystals of PD1-K as well as PZ1 and PZ2 (Fig. 12); meanwhile, for the solid of the sublimate, the 1H NMR spectrum in DMSO-d6 was assigned to the enol form of PD2 and the HRMS analysis demonstrated the presence of a PD2 base peak (Fig. S57, S62, and S63†). Furthermore, the solids of the sublimate for PD2 have a different DSC trace and X-ray powder diffraction (XRD) pattern from the crystals of PD2-E; the sublimate of PD2 showed Ts at 169 °C and then Td at 181 °C and different diffraction peaks in the range of 2θ = 20–30° from the crystals of PD2-E (Fig. S58 and S59†). Thus, this result suggests that the PD2 molecule exists in the keto form (PD2-K) in the solid of the sublimate, while unfortunately, we could not perform X-ray structural analysis due to an insufficient size of the wire-like solid (Fig. 14d, and e) and it was also difficult to characterize the sublimate as PD2-K by FT-IR spectral analysis (Fig. S49†). It is worth mentioning again that the needle-like crystal of PD1, which was obtained by sublimation of the powdery solid, is composed of the PD1-K molecule in the keto form (Fig. 9a and 10a). Meanwhile, for the keto–enol tautomerization in the solid state, Ogawa et al. have reported that salicylideneanilines show solid-state thermochromism which is ascribed to the tautomeric equilibrium between the enol and cis-keto forms; the cis-keto form exists in the crystal at 298 K, but at a low temperature (77 K), the cis-keto form shows a decrease in pollution due to the formation of the enol form.23 Thus, although PD1 and PD2 did not show thermochromism as well as photochromism in the crystalline state, we believe that this interesting result provides a valuable insight for a greater understanding of the keto–enol tautomerization of phenazine-2,3-diol derivatives and their photophysical properties in the solution and in the solid state.
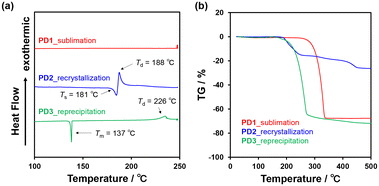 | ||
| Fig. 13 (a) DSC curves (heating process from 25 °C to 250 °C at a scan rate of 1 °C min−1) and (b) TG curves (heating process from 25 °C to 500 °C at a scan rate of 10 °C min−1) of PD1–3. | ||
Theoretical calculations
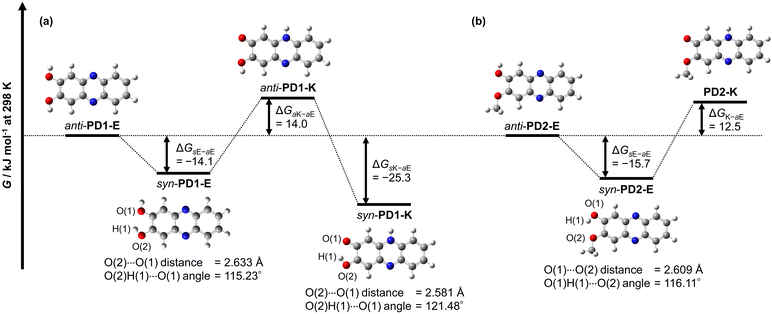
The thermodynamic stabilities of PD1-E, PD1-K, PD2-E, and PD2-K were estimated using density functional theory (DFT) calculations at the B3LYP/6-311G(d,p) level,24 where for the convenience of calculations, the methoxymethoxy group of PD2-E and PD2-K was replaced with the methoxy group (Fig. 15). In order to compare with the conformers syn-PD1-K and anti-PD2-E in the crystals, we included the conformers for PD1-E, PD1-K, and PD2-E in the DFT calculations; for the enol form PD1-E, anti-PD1-E and syn-PD1-E are in the anti-conformation and syn-conformation, respectively, where the two hydrogen atoms of hydroxy groups face in the opposite directions for the former but in the same direction for the latter. For the keto form PD1-K, anti-PD1-K and syn-PD1-K are in the anti-conformation and syn-conformation, respectively, that is, the hydrogen atom of the hydroxy group faces in the direction opposite to the oxygen atom of the carbonyl group for the former but is directed toward that for the latter. On the other hand, for the enol form PD2-E, anti-PD2-E and syn-PD2-E are in the anti-conformation and syn-conformation, respectively, where the hydrogen atom of the hydroxy group faces in the direction opposite to the oxygen atom of the methoxy group for the former but is directed toward that for the latter. Based on the optimized geometries, understandably, there is no formation of intramolecular hydrogen bonding between the two hydroxy groups, the hydroxy group and the carbonyl group, or the hydroxy group and the methoxy group for anti-PD1-E, anti-PD1-K, anti-PD2-E, as well as PD2-K. On the other hand, the angles of O(2)H(1)⋯O(1) for syn-PD1-E and syn-PD1-K and O(2)H(1)⋯O(1) for syn-PD2-E, which involve the formation of intramolecular hydrogen bonding, are ca. 115°, ca. 121°, and ca. 116°, respectively. The fact indicates the existence of intramolecular hydrogen bonding between the two hydroxy groups for syn-PD1-E, and the hydroxy group and the carbonyl group for syn-PD1-K, and the hydroxy group and the methoxy group for syn-PD2-E.Meanwhile, the Gibbs free energies (G) for anti-PD1-E and anti-PD2-E are set as zero in each category to estimate the difference (ΔG) in the G between anti-PD1-E or anti-PD2-E and the other conformer or the tautomer (Fig. 15). The obtained ΔG values of syn-PD1-E, anti-PD1-K, and syn-PD1-K were estimated to be −14.1 kJ mol−1, 14.0 kJ mol−1, and −25.3 kJ mol−1, respectively (Fig. 15a). This result indicates that syn-PD1-E and syn-PD1-K are thermodynamically stabilized by the formation of intramolecular hydrogen bonding, compared to anti-PD1-E and anti-PD1-K. Thus, this result reveals that of the conformers and the tautomers of PD1, syn-PD1-K, which exists in the crystal (Fig. 9a and 10a), is thermodynamically the most stable. For PD2, on the other hand, the obtained ΔG values showed that the enol forms anti-PD2-E and syn-PD2-E are thermodynamically more stable than the keto form PD2-K, and also indicated that anti-PD2-E, which exists in the crystal, is thermodynamically less stable than syn-PD2-E with a ΔG value of −15.7 kJ mol−1 which is stabilized by the formation of the intermolecular hydrogen bonding (Fig. 15b). Thus, based on this result, it is suggested that the formation of one-dimensional intermolecular hydrogen bonding by the most stable tautomer syn-PD1-K constructs a thermodynamically stable crystal structure. For PD2, anti-PD2-E can form intermolecular hydrogen bonding because the hydrogen atom of the hydroxy group faces in the direction opposite to the oxygen atom of the methoxy group, but it is difficult for syn-PD2-E to form intermolecular hydrogen bonding due to its structure with intramolecular hydrogen bonding. Consequently, it was suggested that the crystal structure constructed by anti-PD2-E is thermodynamically stabilized by the formation of one-dimensional intermolecular hydrogen bonding (Fig. 9b and 10b), although anti-PD2-E is thermodynamically less stable than syn-PD2-E.
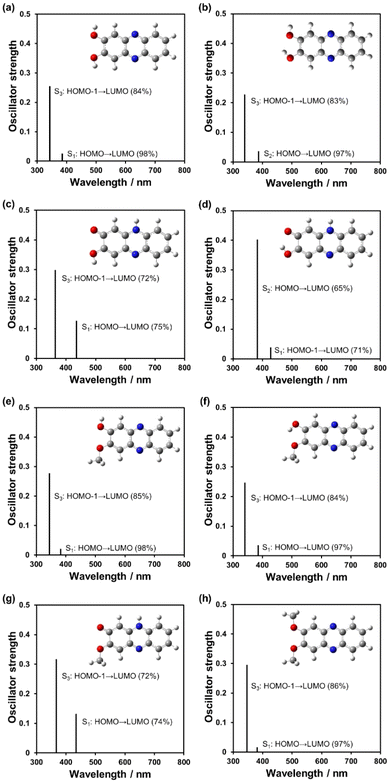
To further understand the optical properties of phenazine-2,3-diol derivatives, time-dependent DFT (TDDFT) calculations were performed for the conformers and the tautomers PD1-E, PD1-K, PD2-E, and PD2-K and PD3 (Fig. 16, Fig. S26 and Table S13†). All the enol tautomers, anti-PD1-E, syn-PD1-E, anti-PD2-E, and syn-PD2-E, and PD3 showed S0 → S3 (ππ*) transitions at around 360 nm with oscillator strengths (f) = 0.25–0.30 (Fig. 16b and f, e.g., syn-PD1-E and syn-PD2-E), which are mainly attributed to the transitions (ca. 85%) from the HOMO–1 to the LUMO, where both the HOMO–1 and LUMO are delocalized over the phenazine skeleton including the hydroxy and the methoxy group. On the other hand, for the keto tautomers, the differences in transition characteristics were observed depending on the direction (anti- or syn-) of the hydrogen atom of the hydroxy group. All the keto tautomers, anti-PD1-K, syn-PD1-K, and PD2-K, showed S0 → S1 (ππ*) transitions at around 440 nm with the oscillator strengths (f) of 0.13 for anti-PD1-K and PD2-K, and 0.039 for syn-PD1-K, which are mainly attributed to the transitions from the HOMO to the LUMO for anti-PD1-K and PD2-K (ca. 75%), and the transition from the HOMO–1 to the LUMO for syn-PD1-K (71%). Both the HOMO and LUMO of anti-PD1-K, syn-PD1-K, and PD2-K are delocalized over the phenazinone skeleton including the hydroxy group or/and the methoxy group, and the HOMO–1 of syn-PD1-K is delocalized on the partial phenazinone skeleton and the hydroxy group, excluding the carbonyl moiety. Moreover, these keto tautomers showed S0 → S3 (ππ*) transitions at around 360 nm with oscillator strengths (f) = 0.30–0.32 for anti-PD1-K and PD2-K, and the S0 → S2 (ππ*) transitions at around 380 nm with the oscillator strength (f) = 0.40 for syn-PD1-K, which are mainly attributed to the transitions from the HOMO–1 to the LUMO (72%) for anti-PD1-K and PD2-K, and the transition from the HOMO to the LUMO for syn-PD1-K (65%). Such transition characteristics were also observed between anti-PZ1 and syn-PZ1 (Fig. S23, S24, and S25†). Consequently, the TDDFT calculations revealed that for PD1 and PD2, the keto forms show photoabsorption bands in a longer wavelength region, compared to the enol forms, and thus are in good agreement with the photoabsorption spectra of PD1, PD2, and PD3 in 2-MeTHF, indicating the existence of the enol form at 298 K and the existence of the keto form in a glassy matrix at 77 K (Fig. 7a, c, and e). Therefore, our work first verified that phenaznine-2,3-diol and its monoalkoxy derivative exhibit photochromism through the ESInterPT processes based on keto–enol tautomerization.
Conclusions
In this study, we verified that phenazine-2,3-diol PD1 and its monoalkoxy derivative PD2 exhibit photochromism through the ESInterPT processes based on keto–enol tautomerization in a glassy matrix at 77 K. Indeed, it was found that the colorless solutions of enol forms PD1-E and PD2-E at 298 K and 77 K transformed into orange-colored solutions of keto forms PD1-K and PD2-K upon photoirradiation (λ = 385 nm) at 77 K. In a glassy matrix at 77 K, PD1 and PD2 exhibit phosphorescence emission originating from the enol forms before photoirradiation but exhibit fluorescence emission originating from the keto forms after photoirradiation, confirming the ESInterPT processes based on keto–enol tautomerization. Furthermore, it is worth mentioning that PD1 and PD2 molecules exist in the keto form (PD1-K) and the enol form (PD2-E) that construct the one-dimensional intermolecular NH⋯O hydrogen bonding and OH⋯N hydrogen bonding, respectively, in the crystal. More interestingly, based on the photoabsorption spectrum, the DSC trace, and the XRD pattern of the solid obtained by sublimation of the crystals of PD2-E, it was suggested that the PD2 molecule exists in the keto form (PD2-K) in the solid of the sublimate. The facts indicate strongly that for PD1 and PD2, the formation of continuous intermolecular hydrogen bonding in aggregates such as in a glassy matrix at 77 K is involved in the keto–enol tautomerization of phenazine-2,3-diol derivatives based on ESInterPT. Therefore, this study not only provides a valuable insight for a greater understanding of ESInterPT based on the keto–enol tautomerization of phenazine-2,3-diol derivatives but also offers an important insight into the photochromism of diazaacene-diols such as diaza-naphthalene and diaza-anthracence derivatives with two hydroxy groups. Indeed, the investigation of the expression of thermochromism as well as photochromism of phenazine-2,3-diol derivatives in the solid state is ongoing in our laboratory.Data availability
The full experimental details, synthetic procedures, characterization data, the 1H, 13C-NMR, FT-IR, and HRMS spectra of products, single-crystal X-ray structural analyses, differential scanning calorimetry (DSC), thermogravimetry (TG) and differential thermal analysis (TG-DTA), photoabsorption and fluorescence spectra, computational details, and supplementary discussions associated with this article are provided in the ESI.†Author contributions
Y.O. conceived the project and directed the experimental studies. K. O. performed almost all the experiments and carried out DFT calculations. K. K. and M. Y. helped with synthesis and purification of compounds. N. K. helped with differential scanning calorimetry (DSC), thermogravimetry (TG) and differential thermal analysis (TG-DTA). K. I. conducted photoabsorption and fluorescence spectral measurements at 77 K. The manuscript was written through contributions of all authors.Conflicts of interest
There are no conflicts to declare.Acknowledgements
This work was supported by Grants-in-Aid for Scientific Research (B) from the Japan Society for the Promotion of Science (JSPS) KAKENHI Grant Number 22H02123 and by the Yashima Environment Technology Foundation. K. O. was supported by JST, the Establishment of University Fellowships towards the Creation of Science Technology Innovation, Grant Number JPMJF2129.References
-
(a) J. Zhao, S. Ji, Y. Chen, H. Guo and P. Yang, Phys. Chem. Chem. Phys., 2012, 14, 8803–8817 RSC
; (b) J. Piechowska, K. Virkki, B. Sadowski, H. Lemmetyinen, N. V. Tkachenko and D. T. Gryko, J. Phys. Chem. A, 2014, 118, 144–151 CrossRef CAS PubMed
; (c) M. R. Aronoff, B. VanVeller and R. T. Raines, Org. Lett., 2013, 15, 5382–5385 CrossRef CAS PubMed
; (d) M. Takahashi, K. Sakai, K. Sambe and T. Akutagawa, J. Phys. Chem. B, 2022, 126, 3116–3124 CrossRef CAS PubMed
; (e) K. Sakai, N. Miyamoto, M. Ogawa, K. Kawano and T. Akutagawa, J. Phys. Chem. A, 2021, 125, 4784–4792 CrossRef CAS PubMed
; (f) A. Bhattacharyya, S. C. Makhal and N. Guchhait, Chem. Phys., 2019, 520, 61–69 CrossRef CAS
; (g) P. Jurek, H. Jędrzejewska, M. F. Rode and A. Szumna, Chem. – Eur. J., 2022, 29, e202203116 CrossRef PubMed
; (h) T. Mutai, H. Sawatani, T. Shida, H. Shono and K. Araki, J. Org. Chem., 2013, 78, 2482–2489 CrossRef CAS PubMed
; (i) J. Massue, D. Jacquemin and G. Ulrich, Chem. Lett., 2018, 47, 1083–1089 CrossRef CAS
; (j) D. Göbel, D. Duvinage, T. Stauch and B. J. Nachtsheim, J. Mater. Chem. C, 2020, 8, 9213–9225 RSC
.
-
(a) Y. Zhang, H. Yang, H. Ma, G. Bian, Q. Zang, J. Sun, C. Zhang, Z. An and W.-Y. Wong, Angew. Chem., Int. Ed., 2019, 58, 8773–8778 CrossRef CAS PubMed
; (b) I. Allison, M. Mamada, A. Shukla, S. K. M. McGregor, R. B. Roseli, I. Gale, V. P. Rahane, E. G. Moore, E. H. Krenske, N. Jain, C. Adachi, E. B. Namdas and S.-C. Lo, J. Mater. Chem. C, 2023, 11, 15861–15872 RSC
.
-
(a) S.-H. Hwang, H. Kim, H. Ryu, I. Serdiuk, D. Lee and T.-L. Choi, J. Am. Chem. Soc., 2022, 144, 1778–1785 CrossRef CAS PubMed
; (b) K. Sakai, T. Ishikawa and T. Akutagawa, J. Mater. Chem. C, 2013, 1, 7866–7871 RSC
.
-
(a) S. Hayashi, E. Tajkhorshid and K. Schulten, Biophys. J., 2002, 83, 1281–1297 CrossRef CAS PubMed
; (b) E. Nango, A. Royant, M. Kubo, T. Nakane, C. Wickstrand, T. Kimura, T. Tanaka, K. Tono, C. Song, R. Tanaka, T. Arima, A. Yamashita, J. Kobayashi, T. Hosaka, E. Mizohata, P. Nogly, M. Sugahara, D. Nam, T. Nomura, T. Shimamura, D. Im, T. Fujiwara, Y. Yamanaka, B. Jeon, T. Nishizawa, K. Oda, M. Fukuda, R. Andersson, P. Båth, R. Dods, J. Davidsson, S. Matsuoka, S. Kawatake, M. Murata, O. Nureki, S. Owada, T. Kameshima, T. Hatsui, Y. Joti, G. Schertler, M. Yabashi, A.-N. Bondar, J. Standfuss, R. Neutze and S. Iwata, Science, 2016, 354, 1552–1557 CrossRef CAS PubMed
.
-
(a) S. R. Tachibana, L. Tang, L. Zhu, W. Liu, Y. Wang and C. Fang, J. Phys. Chem. B, 2018, 122, 11986–11995 CrossRef CAS PubMed
; (b) M. H. Lee, J. S. Kim and J. L. Sessier, Chem. Soc. Rev., 2015, 44, 4185–4191 RSC
.
-
(a) X.-C. Chen, T. Tao, Y.-G. Wang, Y.-X. Peng, W. Huang and H.-F. Qian, Dalton Trans., 2012, 41, 11107–11115 RSC
; (b) J. Cai, Z. Li, Y. Qiu, Z. OuYang, W. Lin, L. Yang, W. Feng, X. Yu and W. Dong, New J. Chem., 2016, 40, 9370–9379 RSC
; (c) J. Cheng, D. Liu, W. Li, L. Bao and K. Han, J. Phys. Chem. C, 2015, 119, 4242–4251 CrossRef CAS
.
-
(a) D. McMorrow and M. Kasha, J. Phys. Chem., 1984, 88, 2235–2243 CrossRef CAS
; (b) X. Zhao, X. Li, S. Liang, X. Dong and Z. Zhang, RSC Adv., 2021, 11, 28851–28862 RSC
; (c) X. Bi, B. Liu, L. McDonald and Y. Pang, J. Phys. Chem. B, 2017, 121, 4981–4986 CrossRef CAS PubMed
.
-
(a) H. Wang, Y. Xiao, Z. Xie, H. Sun, X. Zhang, J. Wanga and R. Huang, Front. Chem., 2021, 9, 766179 CrossRef CAS PubMed
; (b) M. T. Ignasiak, C. Houée-Levin, G. Kciuk, B. Marciniak and T. Pedzinski, ChemPhysChem, 2015, 16, 628–633 CrossRef CAS PubMed
.
-
(a) P. F. Barbara, L. E. Brus and P. M. Rentzepis, J. Am. Chem. Soc., 1980, 102, 5631–5635 CrossRef CAS
; (b) S. Pijeau, D. Foster and E. G. Hohenstein, J. Phys. Chem. A, 2017, 121, 4595–4605 CrossRef CAS PubMed
; (c) S. Barman, S. K. Mukhopadhyay, M. Gangopadhyay, S. Biswas, S. Dey and N. D. P. Singh, J. Mater. Chem. B, 2015, 3, 3490–3497 RSC
.
- X. Zhang, L. Guo, F.-Y. Wu and Y.-B. Jiang, Org. Lett., 2003, 5, 2667–2670 CrossRef CAS PubMed
.
- I. Presiado, Y. Erez, R. Gepshtein and D. Huppert, J. Phys. Chem. C, 2010, 114, 3634–3640 CrossRef CAS
.
- K. Togasaki, T. Arai and Y. Nishimura, J. Phys. Chem. A, 2020, 124, 6617–6628 CrossRef CAS PubMed
.
-
(a) M. Miura, J. Harada and K. Ogawa, J. Phys. Chem. A, 2007, 111, 9854–9858 CrossRef CAS PubMed
; (b) S. Slavova and L. Antonov, Phys. Chem. Chem. Phys., 2024, 26, 7177–7189 RSC
.
-
(a) K. Sakota, A. Hara and H. Sekiya, Phys. Chem. Chem. Phys., 2004, 6, 32–36 RSC
; (b) X.-f. Yu, S. Yamazaki and T. Taketsugu, Phys. Chem. Chem. Phys., 2017, 19, 23289–23301 RSC
.
-
(a) K. Ogawa, M. Miura, T. Nakayama and J. Harada, Chem. Lett., 2003, 32, 840–841 CrossRef CAS
; (b) D. L. Wisman, H. Kim, C. Kim, T. W. Morris, D. Lee and S. L. Tait, Chem. – Eur. J., 2021, 27, 13887–13893 CrossRef CAS PubMed
.
-
(a) C. Tanner, C. Manca and S. Leutwyler, Science, 2003, 302, 1736–1739 CrossRef CAS PubMed
; (b) O.-H. Kwon, Y.-S. Lee, B. K. Yoo and D.-J. Jang, Angew. Chem., Int. Ed., 2006, 45, 415–419 CrossRef CAS PubMed
; (c) Y. Matsumoto, T. Ebata and N. Mikami, J. Phys. Chem. A, 2002, 106, 5591–5599 CrossRef CAS
; (d) P.-T. Chou, C.-Y. Wei, C.-R. C. Wang, F.-T. Hung and C.-P. Chang, J. Phys. Chem. A, 1999, 103, 1939–1949 CrossRef CAS
.
- K. Ohira, M. Yamamoto, K. Imato and Y. Ooyama, New J. Chem., 2023, 47, 2711–2718 RSC
.
-
(a) K. Takagi, A. Mizuno, H. Yoshimura and M. Matsuoka, Dyes Pigm., 1990, 14, 203 CrossRef CAS
; (b) K. Imato, K. Ohira, M. Yamaguchi, T. Enoki and Y. Ooyama, Mater. Chem. Front., 2020, 4, 589–596 RSC
; (c) K. Ohira, K. Imato and Y. Ooyama, Mater. Chem. Front., 2021, 14, 5298–5304 RSC
.
-
(a) I. Yosioka and H. Otomasu, Pharm. Bull., 1954, 2, 53–59 CrossRef CAS PubMed
; (b) C. Seillan, H. Brisset and O. Siri, Org. Lett., 2008, 10, 4013–4016 CrossRef CAS PubMed
.
-
(a) T.-B. Wei, W.-T. Li, Q. Li, J.-X. Su, W.-J. Qu, Q. Lin, H. Yao and Y.-M. Zhang, Tetrahedron Lett., 2016, 57, 2767–2771 CrossRef CAS
; (b) C. Grieco, A. T. Hanes, L. Blancafort and B. Kohler, J. Phys. Chem. A, 2019, 123, 5356–5366 CrossRef CAS PubMed
.
- C. Seillan, P. Marsal and O. Siri, Org. Biomol. Chem., 2010, 8, 3882–3887 RSC
.
-
(a) S.-H. Liu, R.-L. Guo, W.-C. Chen, H.-Y. Hou and C.-M. Shu, J. Loss Prev. Process Ind., 2021, 70, 104403 CrossRef CAS
; (b) X.-R. Li, X.-L. Wang and H. Koseki, J. Hazard. Mater., 2008, 159, 13–18 CrossRef CAS PubMed
.
-
(a) J. Harada, T. Fujiwara and K. Ogawa, J. Am. Chem. Soc., 2007, 129, 16216–16221 CrossRef CAS PubMed
; (b) T. Fujiwara, J. Harada and K. Ogawa, J. Phys. Chem. B, 2004, 108, 4035–4038 CrossRef CAS
; (c) T. Fujiwara, J. Harada and K. Ogawa, J. Phys. Chem. A, 2009, 113, 1822–1826 CrossRef CAS PubMed
; (d) J. Harada, H. Uekusa and Y. Ohashi, J. Am. Chem. Soc., 1999, 121, 5809–5810 CrossRef CAS
; (e) K. Ogawa and J. Harada, J. Mol. Struct., 2003, 647, 211–216 CrossRef CAS
; (f) J. Harada and K. Ogawa, Chem. Soc. Rev., 2009, 38, 2244–2252 RSC
; (g) K. Ogawa and T. Fujiwara, Chem. Lett., 1999, 28, 657–658 CrossRef
; (h) K. Ogawa, J. Harada, I. Tamura and Y. Noda, Chem. Lett., 2000, 29, 528–529 CrossRef
; (i) K. Ogawa, Y. Kasahara, Y. Ohtani and J. Harada, J. Am. Chem. Soc., 1998, 120, 7107–7108 CrossRef CAS
.
-
M. J. Frisch, G. W. Trucks, H. B. Schlegel, G. E. Scuseria, M. A. Robb, J. R. Cheeseman, G. Scalmani, V. Barone, G. A. Petersson, H. Nakatsuji, X. Li, M. Caricato, A. V. Marenich, J. Bloino, B. G. Janesko, R. Gomperts, B. Mennucci, H. P. Hratchian, J. V. Ortiz, A. F. Izmaylov, J. L. Sonnenberg, D. Williams-Young, F. Ding, F. Lipparini, F. Egidi, J. Goings, B. Peng, A. Petrone, T. Henderson, D. Ranasinghe, V. G. Zakrzewski, J. Gao, N. Rega, G. Zheng, W. Liang, M. Hada, M. Ehara, K. Toyota, R. Fukuda, J. Hasegawa, M. Ishida, T. Nakajima, Y. Honda, O. Kitao, H. Nakai, T. Vreven, K. Throssell, J. A. Montgomery Jr., J. E. Peralta, F. Ogliaro, M. J. Bearpark, J. J. Heyd, E. N. Brothers, K. N. Kudin, V. N. Staroverov, T. A. Keith, R. Kobayashi, J. Normand, K. Raghavachari, A. P. Rendell, J. C. Burant, S. S. Iyengar, J. Tomasi, M. Cossi, J. M. Millam, M. Klene, C. Adamo, R. Cammi, J. W. Ochterski, R. L. Martin, K. Morokuma, O. Farkas, J. B. Foresman and D. J. Fox, Gaussian 16, Revision B.01, Gaussian, Inc., Wallingford CT, 2016 Search PubMed
.
Footnote |
| † Electronic supplementary information (ESI) available. CCDC 2328436, 2328438, 2328440 and 2328442. For ESI and crystallographic data in CIF or other electronic format see DOI: https://doi.org/10.1039/d4ob00387j |
| This journal is © The Royal Society of Chemistry 2024 |


