 Open Access Article
Creative Commons Attribution 3.0 Unported Licence
Comment on “Limonene as a renewable unsaturated hydrocarbon solvent for living anionic polymerization of β-myrcene” by A. Dev, A. Rösler and H. Schlaad, Polym. Chem., 2021, 12, 3084
Akhil
Dev
 ,
Alexander
Rösler
 and
Helmut
Schlaad
 *
*
University of Potsdam, Institute of Chemistry, Karl-Liebknecht-Straße 24-25, 14476 Potsdam, Germany. E-mail: schlaad@uni-potsdam.de
First published on 10th October 2024
Abstract
Addition and correction for ‘Limonene as a renewable unsaturated hydrocarbon solvent for living anionic polymerization of β-myrcene’ by Akhil Dev et al., Polym. Chem. 2021, 12, 3084–3087; https://doi.org/10.1039/d1py00570g.
We earlier reported on the living anionic polymerization of β-myrcene at room temperature using sec-butyllithium as the initiator and DL-limonene as a bio-sourced unsaturated hydrocarbon solvent.1 First kinetic studies, based on three experiments conducted with constant monomer-to-initiator ratio, suggested that the reaction order with respect to initial initiator (not active chain end) concentration is 0.9 ± 0.1, and polymyrcenyllithium chains should therefore be present as single chains and not forming associates − this is not correct.
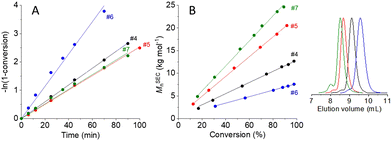
The results of additional kinetic experiments with 1 M or 2 M monomer solutions and different initiator concentrations of 10.0–39.6 mM are summarized in Table 1, #4–7 (the re-evaluated kinetic data of the original three experiments1 are included in Table 1 as #1–3). Monomer conversions were determined by 1H NMR spectroscopy,1 and apparent rate constants of propagation (kapp) were obtained from the slopes of the linear pseudo first-order time-conversion plots (Fig. 1A). Number-average molar masses of polymyrcenes were determined by size exclusion chromatography (SEC) with 1,4-polyisoprene calibration (MSECn, Fig. 1B), and concentrations of active chain ends ([P*]0) were calculated from the initial initiator concentrations times the ratio of calculated over experimental number-average molar masses (Mcaln/MSECn) at a given monomer conversion xp.
 | ||
| Fig. 1 (A) Pseudo first-order time-conversion plots for the sec-butyllithium initiated anionic polymerizations of β-myrcene in DL-limonene at room temperature (Table 1, #4–7). (B) Evolution of the number-average molar mass, MSECn, as a function of monomer conversion and SEC traces of the final polymyrcene samples #4–7. | ||
| # | [Myr]0 (M) | [sBuLi]0 (mM) |
x
p![[thin space (1/6-em)]](https://www.rsc.org/images/entities/char_2009.gif) a (%) a (%) |
M
caln![[thin space (1/6-em)]](https://www.rsc.org/images/entities/char_2009.gif) b (kg mol−1) b (kg mol−1) |
M
SECn![[thin space (1/6-em)]](https://www.rsc.org/images/entities/char_2009.gif) c (kg mol−1) c (kg mol−1) |
Đ | [P*]0![[thin space (1/6-em)]](https://www.rsc.org/images/entities/char_2009.gif) e (mM) e (mM) |
k
app![[thin space (1/6-em)]](https://www.rsc.org/images/entities/char_2009.gif) (min−1)
(min−1) |
|---|---|---|---|---|---|---|---|---|
| a Monomer conversion for the last sample of the kinetic experiment, by 1H NMR spectroscopy. b Calculated number-average molar mass, Mcaln = ([Myr]0/[sBuLi]0·xp·136.2 + 58)/1000 kg mol−1. c Number-average molar mass of the final polymyrcene sample, by SEC with 1,4-polyisoprene standard (PSS, Mainz, Germany) calibration. d Dispersity index of the final polymyrcene sample, by SEC. e Concentration of active chain ends, [P*]0 = [sBuLi]0·Mcaln/MSECn. f Apparent rate constant of propagation, kapp = slope of linear pseudo first-order time-conversion plot. | ||||||||
| 1 | 2.79 | 60.3 | 92 | 5.86 | 6.91 | 1.07 | 51.1 | 0.0744 |
| 2 | 1.22 | 26.5 | 92 | 5.83 | 6.34 | 1.05 | 24.4 | 0.0367 |
| 3 | 0.64 | 13.9 | 89 | 5.64 | 7.80 | 1.05 | 10.1 | 0.0187 |
| 4 | 1.02 | 19.5 | 98 | 7.04 | 12.70 | 1.04 | 10.8 | 0.0296 |
| 5 | 1.00 | 10.0 | 92 | 12.59 | 20.50 | 1.04 | 6.1 | 0.0253 |
| 6 | 1.95 | 39.6 | 98 | 6.63 | 7.58 | 1.05 | 34.6 | 0.0570 |
| 7 | 2.00 | 19.7 | 89 | 12.36 | 24.60 | 1.05 | 9.9 | 0.0259 |
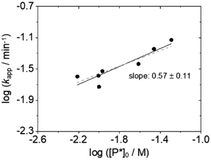
With this larger data set (Table 1) we obtain the bilogarithmic plot of kappvs. [P*]0 in Fig. 2, according to which the reaction order with respect to active chain ends is close to one half, suggesting that the polymyrcenyllithium chains are present as dimeric associates and not, as proposed earlier, as single chains.
 | ||
| Fig. 2 Bilogarithmic plot of the apparent rate constant kappvs. the concentration of active chains [P*]0; slope of linear regression line (solid line): 0.57 ± 0.11 (slope of dashed line: 0.5). | ||
We apologize for any inconvenience or debate this may have caused.
Data availability
Data available upon request.Conflicts of interest
There are no conflicts to declare.References
- A. Dev, A. Rösler and H. Schlaad, Polym. Chem., 2021, 12, 3084–3087 RSC.
| This journal is © The Royal Society of Chemistry 2024 |
