Acrylate–methacrylate radical copolymerization kinetics of sparingly water-soluble monomers in polar and nonpolar solvents†
Noushin
Rajabalinia
 ,
Fatemeh
Salarhosseini
and
Robin A.
Hutchinson
 *
*
Department of Chemical Engineering, Queen's University, 19 Division St., Kingston, ON K7L 3N6, Canada. E-mail: robin.hutchinson@queensu.ca
First published on 22nd October 2024
Abstract
The properties of waterborne polymer dispersions synthesized by emulsion radical polymerization are influenced by reactions in both the aqueous medium and the growing particles. Mathematical models representing the process often do not consider the difference in the propagation rate coefficient (kp) of monomers in the two phases, despite the body of evidence demonstrating that solvent polarity influences monomer–monomer and monomer-solvent hydrogen-bonding that affects both kp homopropagation values and copolymerization reactivity ratios. Therefore, it is vital to develop experimental approaches to systematically measure the influence of solvent on the copolymerization kinetics of hydrophobic monomers under conditions that are similar to emulsion systems. In this work, we study the copolymerization of methyl acrylate (MA) with di(ethylene glycol) methyl ether methacrylate (DEGMEMA) as models for the common emulsion monomers butyl acrylate and methyl methacrylate. As well as varying solvent choice and monomer concentration, MA/DEGMEMA copolymerization kinetics are compared to those of MA with methacrylic acid (MAA) to determine the influence of monomer functionality on its relative reactivity. The findings suggest that the copolymer composition of all methacrylate–acrylate systems – whether involving functional or non-functional monomers – converge to a single curve in protic polar aqueous solution.
Introduction
Waterborne polymer dispersions, used in a broad range of industries1 including (meth)acrylate dispersions for coatings and adhesives,2 are mostly synthesized by emulsion radical polymerization via a complex polymerization mechanism. Although most polymer formation occurs within the dispersed particles, reactions in the aqueous medium play an important role in controlling particle nucleation and radical entry into the particles.3 Despite the commercial importance of producing dispersions with desired performance characteristics, unsolved issues remain that prevent detailed kinetic models from capturing all of the important features of the process.4 In particular, the current understanding and mathematical models fail to accurately represent particle nucleation and the resulting particle size distribution of the synthesized polymer dispersions.5 Some of these difficulties arise from an inadequate treatment of the kinetics of chain growth in the aqueous phase.Using a water-soluble initiator, the initial chain growth of newly formed radicals occurs in the aqueous medium6 under conditions for which the propagation coefficient rate (kp) describing the addition of the sparingly-soluble monomer to the growing oligomers is chain-length dependent (CLD).7 Oligomer growth in the water continues until the growing chain either enters a micelle or polymer particle,6,8 or reaches a critical chain length and becomes insoluble in water by the process known as homogeneous nucleation.9 Despite significant efforts to develop first-principle representations of radical entry10,11 to and radical exit5 from the particles, their reliability is still debatable12 because of the lack of accounting for the CLD and/or solvent dependency of kp in water compared to in the particles.
A significant body of work has emerged using specialized pulsed-laser polymerization techniques to demonstrate that solvent polarity can significantly affect chain growth,13,14 with the kp of water-soluble monomers more than a magnitude higher in water compared to in organic media;15i.e., within the growing polymer particles. However, less is known about the influence of water on the propagation kinetics of monomers with limited solubility in aqueous solution, such as those typically used in emulsion polymerization. Agboluaje et al. compared the relative influence of polar solvents – both alcohols and water – on kp values of sparingly soluble non-functional 2-methoxyethyl acrylate (MEA) and methyl acrylate (MA) to that of fully water-soluble acrylic acid (AA).16 While transitioning from bulk to solution polymerization with 5–10 wt% of monomer in alcohol resulted in a 2-fold kp increase for MA and MEA, the value for AA decreased by a factor of 2. The difference in behavior was explained by competitive hydrogen bonding effects: alcohol enhances the reactivity of the non-functional acrylates through H-bonding with monomer but reduces the reactivity of AA by disruption of the monomer dimerization that occurs in bulk. On the other hand, it was found that kp for 5 wt% MA, MEA and AA in water was 16, 8, and 4.6 times higher than bulk, respectively, with the values for the three monomers converging to 160–200 × 103 L mol−1 s−1 at 25 °C.16 This difference in the relative influence of water on the propagation of non-functional and functional monomers is expected to be important for emulsion systems, which often involves the copolymerization of monomers with limited water solubility (e.g., styrene, butyl acrylate, methyl methacrylate) with water-soluble functional monomers (e.g., 2-hydroxyethyl (meth)acrylate, (meth)acrylic acid).17
As homopropagation kp values of functional and non-functional monomers show different sensitivities towards water, it is not surprising that solvent nature also affects the reactivity ratios of monomers in radical copolymerization and thus copolymer composition, as has been reported for methyl methacrylate (MMA) copolymerized with methacrylic acid (MAA)18 and AA19 in a variety of organic solvents. More recently, Agboluaje et al. demonstrated that the relative incorporation of 2-hydroxyethyl methacrylate (HEMA) into HEMA/MEA copolymer is reduced in alcohols and methanol–water mixtures compared to the copolymer synthesized in bulk,20 as also found for HEMA copolymerized with butyl methacrylate (BMA)21 and 2-hydroxyethyl acrylate (HEA) copolymerized with both butyl acrylate (BA)22 and BMA.23 The HEMA/MEA study also demonstrated that solvent polarity had a much stronger influence on the composition-averaged propagation rate coefficient in the system (i.e., polymerization rate) than on the system reactivity ratios (i.e., copolymer composition).20 Deglmann et al. computationally studied the effect of medium on copolymer composition, demonstrating that the experimental variations in reactivity ratios with solvent choice are captured by considering thermodynamic nonidealities, as captured by the activity coefficients of the two monomers and transition states involved.24
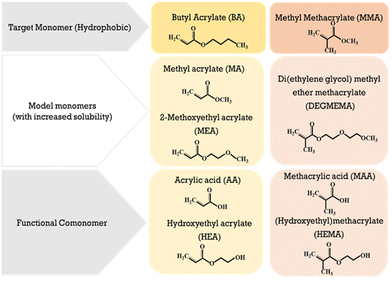
With regards to emulsion system, the time required for an oligomer to reach a critical chain growth will depend both on chain growth rates and copolymer composition, as the difference in the hydrophobicity of comonomers influences oligomeric solubility and thus radical entry.25 While the emulsion copolymerization of MMA and BA has been widely studied due to its wide application as coatings and adhesives,26 to the best of our knowledge their reactivity ratios in aqueous solution have not been measured due to their hydrophobicity. In this work we take the first steps to determining these values under conditions as similar as possible to those in the aqueous phase of emulsion polymerization. Our strategy is to substitute MMA and BA with non-functional monomers of similar structure but with increased water solubility, as shown in Fig. 1. With a water solubility of ∼5 wt%, MA is a natural substitute for BA, and we select di(ethylene glycol) methyl ether methacrylate (DEGMEMA) as a non-functional methacrylate with increased water solubility (∼6 wt%) compared to MMA. These selections are based upon our previous findings that the influence of solvent polarity on the reactivity of non-functional monomers is similar (e.g., MEA vs. MA16 and MEA vs. BA22).
In addition to our interest on the influence of solvent on MA/DEGMEMA copolymerization, we would like to quantify the influence of monomer functionality on relative reactivity during the transition from non-polar to polar solvents. Both hydroxy-functional (HEA and HEMA) and acid functional (AA and MAA) monomers are commonly added to many emulsion systems. Thus, we compare the combined influence of solvent selection and methacrylate functionality on the relative reactivities of MA/MAA and MA/DEGMEMA. In situ NMR is used to track individual monomer consumption rates up to high conversion, thus providing a measure of both reaction rate (i.e., overall rate of conversion) and of the system reactivity ratios (estimated from the relative rates of comonomer consumption).
Experimental section
Materials
All chemicals in this study were used as received without further purification. Methyl acrylate [MA] (99%, contains ≤100 ppm monomethyl ether hydroquinone [MEHQ] as inhibitor, Sigma-Aldrich), methacrylic acid [MAA] (99% contains 250 ppm MEHQ, Aldrich), di(ethylene glycol) methyl ether methacrylate [DEGMEMA] (95%, Aldrich), 2,2′-azobis(2-methylpropionitrile) [AIBN] (98%, Aldrich), 2,2′-azobis(2-methylpropionamidine) dihydrochloride [V-50] (97%, Aldrich), 1,3,5-trioxane (99%, Tokyo Chemical Industry Co., Ltd), dimethyl sulfoxide-d6 [DMSO-d6] (99.5% isotropic, Thermo Scientific), toluene-d8 (99.5% atom D, Cambridge Isotope Laboratories, Inc.), ethanol-d1 [EtOD, C2H5OD] (≥99.5% atom D, Sigma-Aldrich) and deuterium oxide [D2O] (Sigma-Aldrich) were used.In situ 1H NMR polymerizations
The effect of altering comonomer composition, monomer functionality, solvent type and concentration on compositional drift to high conversion has been studied in the copolymerization of MA with MAA and with DEGMEMA, as summarized in Tables S1 and S2 in ESI.† The initiator was switched from oil-soluble AIBN to water-soluble V-50 when the D2O fraction in D2O/EtOD mixtures was ≥50 wt%.NMR mixtures were prepared based on the given formulations in Tables S1 and S2† by adding the corresponding amounts of monomers, solvent(s) and initiator to a glass vial at ambient temperature. Each solution was well mixed using a vortex mixer to ensure sample homogeneity. No purging with an inert gas was performed as the presence of small amount of oxygen retards the start of the polymerization, with the inhibition time allowing the tracking of conversion from the start of reaction.27,28 0.5–1 ml of each sample was transferred to a Wilmard® 5 mm NMR tube and was stored in the fridge prior to the in situ NMR experiments.
In situ
1H NMR experiments were performed using Bruker 500, 600 and 700 MHz NMR spectrometers equipped with TopSpin 4 NMR processing software. As the focus of the study was the influence of solvent and monomer selection on copolymer composition, and it has been reported that temperature has a negligible effect on acrylate–methacrylate reactivity ratios,23 all experiments were performed at 60 °C. The NMR sample chamber was equilibrated to the reaction temperature before the samples were inserted. After sample equilibration to the reaction temperature in the chamber, the software was locked to the deuterated defined solvent and the sample was shimmed and tuned within 3 to 5 min of inserting the tube to ensure the quality of the acquired spectra, as sharp peaks and a flat baseline are critical for quantitative analysis of the spectrum. Acquisition parameters were set to a relaxation delay (d1) of 20 s to prevent error arising from peak saturation,29 with 8 scans per acquisition to provide a spectrum with a good signal to noise ratio every 3–4 min. Each reaction was followed up to the highest attainable monomer conversion (always >65%) without losing spectra quality due to loss of shimming. The reproducibility of the experimental procedure and data analysis was verified by repeating some solvent/comonomer formulations three times. Fig. S1† provides an example set of data collected for MA/MAA (wmon = 0.2) in a mixture containing equal mass fractions of D2O![[thin space (1/6-em)]](https://www.rsc.org/images/entities/char_2009.gif) and
and![[thin space (1/6-em)]](https://www.rsc.org/images/entities/char_2009.gif) EtOD (αEtOD = 0.5) for two different initial comonomer compositions (fMA,0 = 0.20 and 0.50), plotting both overall monomer conversion (X) vs. time and the evolution of fMAvs. X.
EtOD (αEtOD = 0.5) for two different initial comonomer compositions (fMA,0 = 0.20 and 0.50), plotting both overall monomer conversion (X) vs. time and the evolution of fMAvs. X.
Following the procedures described by Preusser and Hutchinson,30 the change in comonomer composition with overall monomer conversion as well as the change in overall monomer conversion with time was calculated from the decrease in intensity of distinct peaks corresponding to the two monomers in the system. Details for the specific monomer/solvent systems in the current work are provided in Section S1 to S5 of the ESI.†
Reactivity ratio estimation
The drifts in comonomer composition vs. overall monomer conversions were used to estimate reactivity ratios – i.e., the relative propensity of radical-i to react with monomer-i compared to monomer-j: | (1) |
 | (2) |
 | (3) |
Following the terminology recently introduced by an IUPAC working group on “Experimental Methods and Data Evaluation Procedures for the Determination of Radical Copolymerization Reactivity Ratios”,32 this procedure can be referred to as the f0–f–X method, as the reactivity ratio estimates determined from the fit of the f vs. X data are also dependent on the values of f1,0 specified as the initial condition when solving eqn (2). For all experiments conducted in this study, the f1,0 determined in the lab via gravimetry was used in the parameter estimations, with the excellent agreement between the NMR-measured and lab values illustrated by the examples provided in ESI Sections S1–S5.† The r1 and r2 values were estimated for each solvent/monomer/comonomer mixture (e.g., MA/MAA with wmon = 0.1 in DMSO-d6) by combining data from three experiments with f1,0 set to 0.20, 0.50, and 0.80. We assume that each f1–X data measurement is independent, as every NMR spectrum is analyzed separately with no dependence on the values determined from the previous spectrum.
The validity of the estimated reactivity ratios using this methodology is checked for some of the data sets by using material balances to estimate cumulative copolymer composition (Fcum1) according to eqn (4):
 | (4) |
As a further check on both the experimental and estimation procedures, separate JCRs were calculated for the Fig. S1† repeat experiments conducted for MA/MAA in D2O![[thin space (1/6-em)]](https://www.rsc.org/images/entities/char_2009.gif) :
:![[thin space (1/6-em)]](https://www.rsc.org/images/entities/char_2009.gif) EtOD (αEtOD = 0.5) with wmon = 0.2, as shown as Fig. S1(c).† The three JCRs overlap, with the small differences seen related to the range of data covered for the same initial conditions run for varying reaction times: the shorter 40 minute experiments cover a reduced f1 range compared to those run for longer reaction times to higher conversion. Our approach for subsequent experiments was to follow the reaction to the highest possible overall conversion while still achieving good quality NMR spectra, thus covering a sufficient composition range to ensure the validity of the estimated reactivity ratios.34
EtOD (αEtOD = 0.5) with wmon = 0.2, as shown as Fig. S1(c).† The three JCRs overlap, with the small differences seen related to the range of data covered for the same initial conditions run for varying reaction times: the shorter 40 minute experiments cover a reduced f1 range compared to those run for longer reaction times to higher conversion. Our approach for subsequent experiments was to follow the reaction to the highest possible overall conversion while still achieving good quality NMR spectra, thus covering a sufficient composition range to ensure the validity of the estimated reactivity ratios.34
With these verifications of our methodology, the remaining reactivity ratios reported in this work are determined using the DNI procedure and parameter estimation tools in PREDICI.
Results and discussion
The original plan was to use in situ NMR to track MA/DEGMEMA and MA/MAA copolymerization in a series of deuterated solvents progressing from non-polar toluene-d8 to D2O, as shown in Fig. 2. However, NMR shimming was not sufficiently stable for some reaction mixtures in toluene-d8 (e.g., MA/MAA with wmon = 0.1 and 0.5 and MA/DEGMEMA with wmon = 0.5). In addition, it is necessary that the monomer/polymer/solvent system stays homogeneous throughout the complete experiment to have confidence in the data analysis. Thus, some conditions were not fully analyzed due to polymer precipitation that occurred in pure D2O and D2O-rich EtOD![[thin space (1/6-em)]](https://www.rsc.org/images/entities/char_2009.gif) :
:![[thin space (1/6-em)]](https://www.rsc.org/images/entities/char_2009.gif) D2O mixtures. Nonetheless, much can be learned by comparing the behavior of the two comonomer systems in non-aqueous and EtOD
D2O mixtures. Nonetheless, much can be learned by comparing the behavior of the two comonomer systems in non-aqueous and EtOD![[thin space (1/6-em)]](https://www.rsc.org/images/entities/char_2009.gif) :
:![[thin space (1/6-em)]](https://www.rsc.org/images/entities/char_2009.gif) D2O mixtures with increased polarity. Analysis and discussion of the polymerization rates (i.e., monomer conversion profiles) is deferred until later, as we first focus on comonomer composition drifts and estimation of reactivity ratios.
D2O mixtures with increased polarity. Analysis and discussion of the polymerization rates (i.e., monomer conversion profiles) is deferred until later, as we first focus on comonomer composition drifts and estimation of reactivity ratios.
 | ||
| Fig. 2 Target solvents, systematically increasing polarity as solvent is changed from organic to aqueous. | ||
Copolymerization in non-aqueous solutions
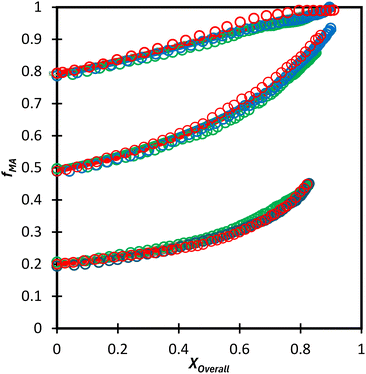
We first compare the MA/MAA and MA/DEGMEMA systems in DMSO-d6 (wmon = 0.5 and 0.1, CAIBN = 0.2 wt%), also reporting results for MA/DEGMEMA in toluene-d8 (wmon = 0.1, CAIBN = 2.0 wt%). Fig. 3 compares the evolution of fMAvs. X from the copolymerization of MA/DEGMEMA, as measured in toluene-d8 (wmon = 0.1) and in DMSO-d6 (wmon = 0.5 and 0.1). In all cases, as expected for a methacrylate–acrylate copolymerization, DEGMEMA is preferentially consumed such that fMA increases with increasing conversion. Moreover, the data sets overlap, following the same trajectories in monomer composition for both solvents and for the two monomer levels in DMSO-d6. Table 1 summarizes the reactivity ratios estimated from fitting of the three data sets using the three estimation methods. Despite the overlap in the fMAvs. X curves, there are minor differences between the best fit mean values of rMA and rDEGMEMA that exceed the reported 95% confidence intervals. The 95% joint confidence region (JCR) ellipsoids calculated by the Excel ML macro and the Contour program are compared in Fig. 4(a) to the 95% confidence intervals (indicated by error bars) for rMA and rDEGMEMA estimated using the DNI method. The plot range in Fig. 4(a) is set to facilitate visual comparison with later results. The size of the uncertainties is similarly very small (e.g., ±0.02) for all three estimation methods, a result related to the large number of experimental points (∼100) in each 3-experiment set collected by the in situ NMR method. To explore the sensitivity of the JCR to the size of the data set, the number of points was reduced by a factor of 5 (i.e., from 1 point per every 2% of overall conversion to 1 point per 10% of overall conversion) for the ML fit. While the rMA and rDEGMEMA estimates were unchanged, the JCR increased in area significantly to encompass the reactivity ratio values estimated by both Contour and DNI (Fig. 4a).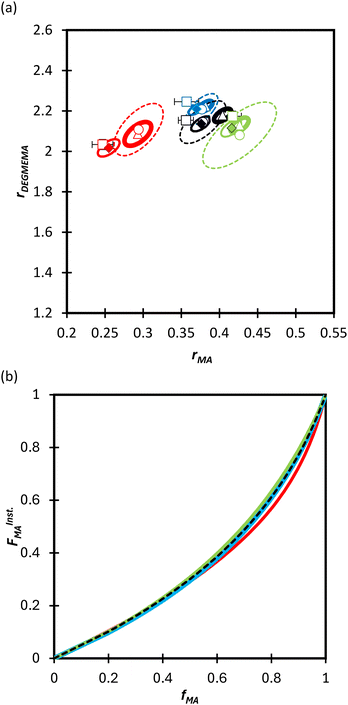 | ||
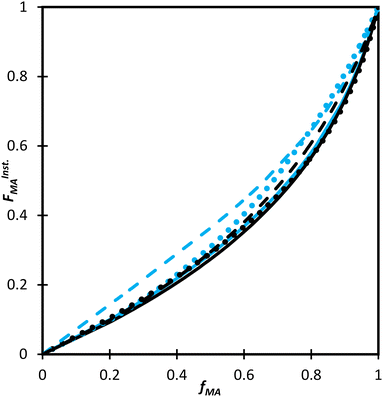
| Fig. 4 (a) 95% joint confidence regions from estimation of the reactivity ratios and (b) FInstMAvs. fMA calculated for the copolymerization of MA/DEGMEMA in toluene-d8 with wmon = 0.1 (green), in DMSO-d6 with wmon = 0.5 (red) and 0.1 (blue), and all data combined (black). The JCRs were obtained by different parameter estimation techniques (see Table 1 and text): ML considering all (solid thicker lines with Δ indicating best-fit values) and a reduced number of experimental data (dashed lines, ○), Contour (solid thinner lines, ✦), and DNI (□, with error bars). FInstMA is derived using estimated reactivity ratios from the DNI fit. | ||
| Solvent | w mon,0 | DNI | ML | ML (reduced points)a | Contour | ||||
|---|---|---|---|---|---|---|---|---|---|
| r MA | r DEGMEMA | r MA | r DEGMEMA | r MA | r DEGMEMA | r MA | r DEGMEMA | ||
| a One data point per 10% overall conversion. | |||||||||
| Toluene-d8 | 0.1 | 0.42 ± 0.01 | 2.17 ± 0.02 | 0.43 ± 0.01 | 2.13 ± 0.02 | 0.43 ± 0.02 | 2.08 ± 0.06 | 0.42 ± 0.01 | 2.12 ± 0.02 |
| DMSO-d6 | 0.5 | 0.25 ± 0.01 | 2.03 ± 0.02 | 0.29 ± 0.01 | 2.08 ± 0.02 | 0.29 ± 0.01 | 2.10 ± 0.05 | 0.26 ± 0.06 | 2.02 ± 0.02 |
| DMSO-d6 | 0.1 | 0.36 ± 0.01 | 2.25 ± 0.02 | 0.38 ± 0.01 | 2.22 ± 0.02 | 0.38 ± 0.01 | 2.21 ± 0.03 | 0.37 ± 0.01 | 2.21 ± 0.01 |
| All three sets | 0.36 ± 0.01 | 2.16 ± 0.02 | 0.40 ± 0.01 | 2.18 ± 0.01 | 0.38 ± 0.01 | 2.15 ± 0.04 | 0.38 ± 0.01 | 2.14 ± 0.02 | |
Even with the larger JCRs, the rMA estimates from the three DEGMEMA/MA data sets (in DMSO-d6 with wmon = 0.5 and 0.1 and in toluene-d8 with wmon = 0.1) do not overlap. Nonetheless, the three data sets are well represented by a single pair of values, rMA = 0.36 ± 0.01 and rDEGMEMA = 2.16 ± 0.02, estimated from a fit of the combined data, as shown by the predicted composition drifts in Fig. 3, with plots of the fit to the individual data sets included as Fig. S7.† In addition, the FMAvs. fMA curve (generated according to eqn (3)) using the best-fit reactivity ratios from the combined data set show very little difference to those generated from the individual fits, as shown in Fig. 4(b). FMAvs. fMA plots comparing each case separately to the overall fit are shown as Fig. S8,† with experimental points added to indicate the range in fMA covered by following the reactions to high conversions. The maximum relative difference in FMA values is 7%, found when comparing the overall fit to the fit for DMSO-d6 with wmon = 0.5, as might be expected from a visual inspection of the JCRs in Fig. 4(a). Thus, while a variation in the value of rMA with solvent level cannot be ruled out, its influence on comonomer composition drift and corresponding copolymer compositions is small.
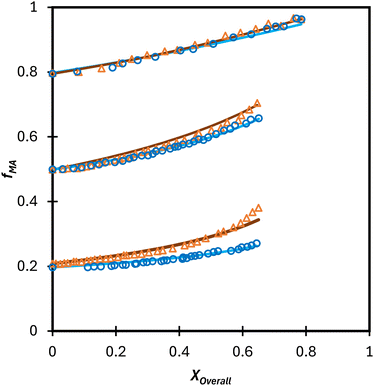
Turning our attention to the MA/MAA system, Fig. 5 shows the compositional drift measured in DMSO-d6 up to high conversion with wmon = 0.5 and 0.1. It is evident that increasing the monomer concentration to wmon = 0.5 increases the relative consumption rate of MAA, as indicated by the sharper increase in fMA with conversion, especially evident for fMA,0 = 0.2. The reactivity ratio estimates are summarized in Table 2, with the best-fit curves added to Fig. 5. As found for MA/DEGMEMA and shown in Fig. 6(a), the JCR and mean values from the three parameter estimation methods agree well for each MA/MAA data set. However, there is a significant difference between the best fit values, especially rMAA, for the two data sets. Thus, unlike for MA/DEGMEMA, overall monomer concentration affects copolymer composition for MA/MAA copolymerized in DMSO-d6, such that the data cannot be well-represented by a single pair of values.
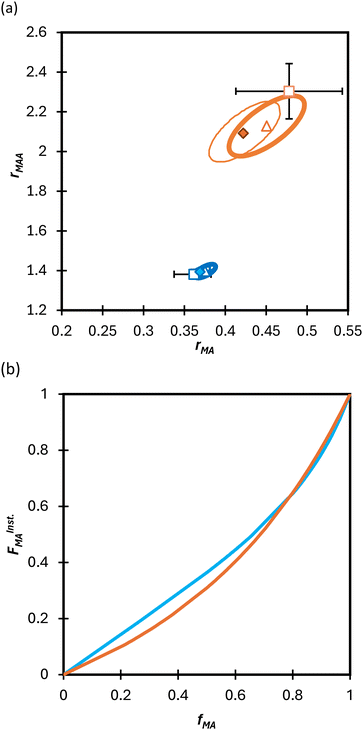 | ||
| Fig. 6 (a) 95% joint confidence regions from estimation of the reactivity ratios and (b) FInstMAvs. fMA calculated for the copolymerization of MA/MAA in DMSO-d6 with wmon = 0.5 (orange) and 0.1 (blue). The JCRs were obtained by different parameter estimation techniques (see Table 2 and text): ML (solid thicker lines with Δ indicating best-fit values), Contour (solid thinner lines,⧫), and DNI (□, with error bars). FInstMA is derived using estimated reactivity ratios from the DNI fit. | ||
| w mon,0 | DNI | Meyer-Lowry | Contour | |||
|---|---|---|---|---|---|---|
| r MA | r MAA | r MA | r MAA | r MA | r MAA | |
| 0.5 | 0.48 ± 0.06 | 2.30 ± 0.14 | 0.45 ± 0.02 | 2.13 ± 0.06 | 0.42 ± 0.02 | 2.10 ± 0.08 |
| 0.1 | 0.36 ± 0.02 | 1.38 ± 0.02 | 0.37 ± 0.01 | 1.40 ± 0.01 | 0.37 ± 0.01 | 1.39 ± 0.01 |
While both the rMAA and rMA values are higher for wmon = 0.5 compared to 0.1, the increase in rMAA is much greater. This observation can be explained by consideration of competitive complexation between the MAA carboxyl functionally with itself (i.e., dimerization), and with the electron-donor solvent DMSO-d6. As shown in Fig. 7, both interactions decrease the electron density on the vinylic bond. However, DMSO-d6 is an aprotic (electron-donor) solvent which results in a net decrease in rMAA as DMSO-d6 content increases due to the balance between two competing influences: the formation of a π-complex between the acid radical and DMSO-d6 reduces MAA addition relative to MA, while formation of H-complexes between the monomer and the solvent facilitates it.35 Moreover, the lower enthalpy of MAA dimerization compared to its hydrogen bonding to DMSO-d6 increases the probability of dimerization as wmon increases, thus increasing the relative incorporation of MAA to MA to the copolymer and the value of rMAA. Comparing the reactivity ratio of MA/MAA (Table 2) with MA/DEGMEMA (Table 1) reveals that the best-fit value for MA/DEGMEMA (rDEGMEMA = 2.16, Table 1) is between the two MA/MAA estimates (rMAA = 1.38 for wmon = 0.1 and 2.30 for wmon = 0.5, Table 2). As a non-functional monomer, DEGMEMA does not participate in dimerization or complex formation, thus showing no dependence on monomer concentration in DMSO-d6.
 | ||
| Fig. 7 Proposed complexation between methacrylic acid and (a) itself, i.e., dimerization, and (b) H-bounding between MAA and DMSO. | ||
Copolymerization in aqueous solution
Moving towards aqueous solution, a series of in situ NMR experiments have been performed for both comonomer systems in a solvent mixture of D2O![[thin space (1/6-em)]](https://www.rsc.org/images/entities/char_2009.gif) :
:![[thin space (1/6-em)]](https://www.rsc.org/images/entities/char_2009.gif) EtOD (αEtOD = 0.5). To study the effect of solvent concentration, wmon,0 was varied between 0.05 and 0.5 for MA/MAA, with all solutions remaining homogeneous over the complete range of conversion. As shown in Fig. 8(a), the increase in fMA with conversion is independent of wmon,0. Although there were slight variations in the estimated values of r summarized in Table 3, no systematic variation in either rMAA or rMA was observed as the solution was diluted from wmon,0 = 0.5 to 0.05. As demonstrated in Fig. 8(a), the composition drifts are well represented by a single pair of values, rMAA = 2.17 ± 0.01 and rMA = 0.28 ± 0.01, estimated from a fit of the combined data set. While corresponding MA/DEGMEMA data were only collected for wmon,0 = 0.5 and 0.1, the same conclusion can be drawn: the measured drifts in fMA shown in Fig. 8(b) are well-fit with rDEGMEMA = 2.37 ± 0.01 and rMA = 0.27 ± 0.01 (Table 3).
EtOD (αEtOD = 0.5). To study the effect of solvent concentration, wmon,0 was varied between 0.05 and 0.5 for MA/MAA, with all solutions remaining homogeneous over the complete range of conversion. As shown in Fig. 8(a), the increase in fMA with conversion is independent of wmon,0. Although there were slight variations in the estimated values of r summarized in Table 3, no systematic variation in either rMAA or rMA was observed as the solution was diluted from wmon,0 = 0.5 to 0.05. As demonstrated in Fig. 8(a), the composition drifts are well represented by a single pair of values, rMAA = 2.17 ± 0.01 and rMA = 0.28 ± 0.01, estimated from a fit of the combined data set. While corresponding MA/DEGMEMA data were only collected for wmon,0 = 0.5 and 0.1, the same conclusion can be drawn: the measured drifts in fMA shown in Fig. 8(b) are well-fit with rDEGMEMA = 2.37 ± 0.01 and rMA = 0.27 ± 0.01 (Table 3).
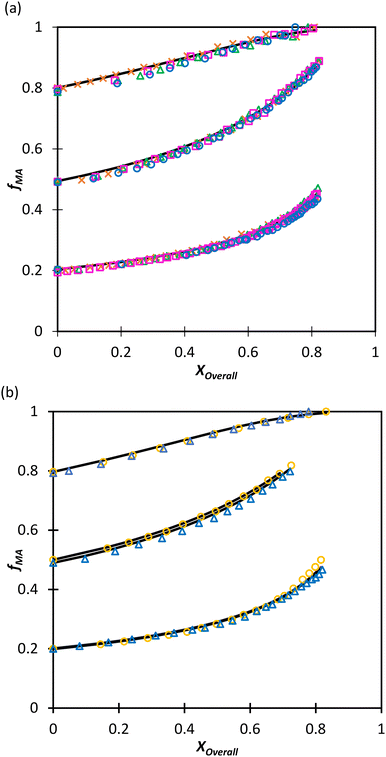 | ||
Fig. 8 Drift in MA comonomer composition (fMA) with overall monomer conversion for copolymerization of MA in D2O![[thin space (1/6-em)]](https://www.rsc.org/images/entities/char_2009.gif) : :![[thin space (1/6-em)]](https://www.rsc.org/images/entities/char_2009.gif) EtOD with αEtoD = 0.5 with: (a) MAA and wmon,0 of 0.50 (×), 0.20 (Δ), 0.10 (□) and 0.05 (○); (b) DEGMEMA with wmon,0 = 0.50 (Δ) and 0.10 (○). Lines are calculated using the reactivity ratios fits estimated from the combined data sets for each system (see Table 3). αEtOD refers to wt% of EtOD in D2O EtOD with αEtoD = 0.5 with: (a) MAA and wmon,0 of 0.50 (×), 0.20 (Δ), 0.10 (□) and 0.05 (○); (b) DEGMEMA with wmon,0 = 0.50 (Δ) and 0.10 (○). Lines are calculated using the reactivity ratios fits estimated from the combined data sets for each system (see Table 3). αEtOD refers to wt% of EtOD in D2O![[thin space (1/6-em)]](https://www.rsc.org/images/entities/char_2009.gif) : :![[thin space (1/6-em)]](https://www.rsc.org/images/entities/char_2009.gif) EtOD mixture. EtOD mixture. | ||
![[thin space (1/6-em)]](https://www.rsc.org/images/entities/char_2009.gif) :
:![[thin space (1/6-em)]](https://www.rsc.org/images/entities/char_2009.gif) EtOD with αEtOD = 0.5
EtOD with αEtOD = 0.5
| w mon,0 | MA/MAA | MA/DEGMEMA | ||
|---|---|---|---|---|
| r MA | r MAA | r MA | r DEGMEMA | |
| 0.5 | 0.27 ± 0.02 | 2.11 ± 0.06 | 0.27 ± 0.04 | 2.56 ± 0.08 |
| 0.2 | 0.28 ± 0.02 | 2.22 ± 0.04 | NA | NA |
| 0.1 | 0.30 ± 0.01 | 2.34 ± 0.03 | 0.27 ± 0.02 | 2.28 ± 0.03 |
| 0.05 | 0.26 ± 0.02 | 1.97 ± 0.03 | NA | NA |
| Combined data | 0.28 ± 0.01 | 2.17 ± 0.03 | 0.27 ± 0.03 | 2.37 ± 0.05 |
Not only are the composition drifts independent of monomer level for both MA/MAA and MA/DEGMEMA in the polar D2O![[thin space (1/6-em)]](https://www.rsc.org/images/entities/char_2009.gif) :
:![[thin space (1/6-em)]](https://www.rsc.org/images/entities/char_2009.gif) EtOD mixture, the FMAvs. fMA curves for the two systems almost overlap, as shown in Fig. 9. In addition, the best-fit reactivity ratios are very similar to those reported for the copolymerization of MEA with HEMA in alcohol/water mixtures, rHEMA = 2.4 ± 0.2 and rMEA = 0.28 ± 0.02;20 the values in that study were estimated from the fitting of eqn (3) to low conversion f–F data, with the larger uncertainty arising from the reduced number of datapoints. The results support the conclusion that the copolymerization behavior of all methacrylate–acrylate systems – whether functional (e.g., HEMA or MAA) or non-functional (DEGMEMA; MA or MEA) – becomes uniform in protic polar aqueous solution, even though differences are seen when copolymerization behavior is compared to bulk,20 or in solvents such as toluene-d8 and DMSO-d6 (Fig. 9). It is notable that switching from DMSO-d6 or toluene-d8 to D2O
EtOD mixture, the FMAvs. fMA curves for the two systems almost overlap, as shown in Fig. 9. In addition, the best-fit reactivity ratios are very similar to those reported for the copolymerization of MEA with HEMA in alcohol/water mixtures, rHEMA = 2.4 ± 0.2 and rMEA = 0.28 ± 0.02;20 the values in that study were estimated from the fitting of eqn (3) to low conversion f–F data, with the larger uncertainty arising from the reduced number of datapoints. The results support the conclusion that the copolymerization behavior of all methacrylate–acrylate systems – whether functional (e.g., HEMA or MAA) or non-functional (DEGMEMA; MA or MEA) – becomes uniform in protic polar aqueous solution, even though differences are seen when copolymerization behavior is compared to bulk,20 or in solvents such as toluene-d8 and DMSO-d6 (Fig. 9). It is notable that switching from DMSO-d6 or toluene-d8 to D2O![[thin space (1/6-em)]](https://www.rsc.org/images/entities/char_2009.gif) :
:![[thin space (1/6-em)]](https://www.rsc.org/images/entities/char_2009.gif) EtOD has little influence on MA/DEGMEMA copolymer composition, suggesting that the H-bonding introduced by the solvent affects both monomers equally. In contrast, DMSO-d6 and the aqueous solution influence the relative reactivities of MAA and MA to a different extent, resulting in an observable shift in copolymer composition in the two solvents, as also seen when comparing the bulk MEA/HEMA to its copolymerization behavior in alcohol/water mixtures.20
EtOD has little influence on MA/DEGMEMA copolymer composition, suggesting that the H-bonding introduced by the solvent affects both monomers equally. In contrast, DMSO-d6 and the aqueous solution influence the relative reactivities of MAA and MA to a different extent, resulting in an observable shift in copolymer composition in the two solvents, as also seen when comparing the bulk MEA/HEMA to its copolymerization behavior in alcohol/water mixtures.20
Extrapolation of these conclusions suggests that the Table 3 values of rmethacrylate = 2.2–2.4 and racrylate = 0.28 ± 0.02 should capture the relationship between comonomer and copolymer composition for any acrylate/methacrylate system, including BA/MMA, in polar solution, including aqueous systems. To test this hypothesis, the fraction of water in the D2O![[thin space (1/6-em)]](https://www.rsc.org/images/entities/char_2009.gif) :
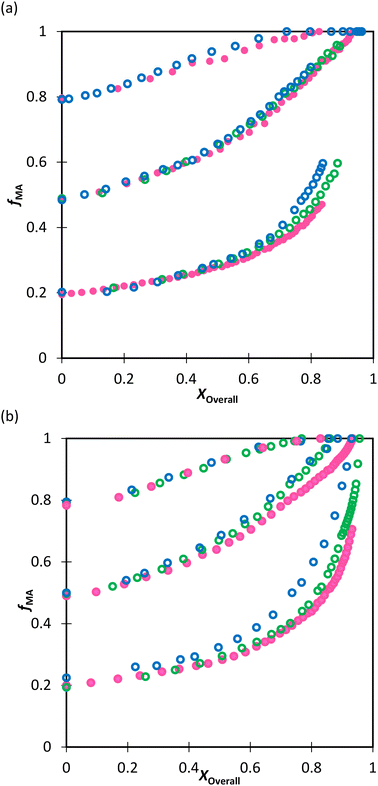
:![[thin space (1/6-em)]](https://www.rsc.org/images/entities/char_2009.gif) EtOD solvent mixture was increased from αEtOD = 0.5 to αEtOD = 0.25 and 0.10, with wmon,0 set to 0.10. The drifts in fMA measured for both the MA/MAA (Fig. 10(a)) and MA/DEGMEMA (Fig. 10(b)) systems, indicate that the MAA or DEGMEMA comonomer is consumed more quickly moving from αEtOD = 0.5 to 0.1 (i.e., fMA increases towards unity at lower conversion), with the change more significant for fMA,0 = 0.2 than fMA,0 = 0.8. However, the copolymer precipitated out of solution as the water fraction in the mixed solvent was increased, with turbidity observed after removing the samples from the NMR chamber and, in some cases, loss of shimming during the acquisition. Thus, the possibility of monomers partitioning and polymerizing in the two phases cannot be ruled out, and reactivity ratios were not estimated from the experiments with αEtOD = 0.25 and 0.1. A follow-up study is planned to directly measure copolymer composition from low-conversion experiments to determine whether the measured compositions differ significantly with decreased αEtoD from those calculated using the reactivity ratios determined in this in situ NMR study.
EtOD solvent mixture was increased from αEtOD = 0.5 to αEtOD = 0.25 and 0.10, with wmon,0 set to 0.10. The drifts in fMA measured for both the MA/MAA (Fig. 10(a)) and MA/DEGMEMA (Fig. 10(b)) systems, indicate that the MAA or DEGMEMA comonomer is consumed more quickly moving from αEtOD = 0.5 to 0.1 (i.e., fMA increases towards unity at lower conversion), with the change more significant for fMA,0 = 0.2 than fMA,0 = 0.8. However, the copolymer precipitated out of solution as the water fraction in the mixed solvent was increased, with turbidity observed after removing the samples from the NMR chamber and, in some cases, loss of shimming during the acquisition. Thus, the possibility of monomers partitioning and polymerizing in the two phases cannot be ruled out, and reactivity ratios were not estimated from the experiments with αEtOD = 0.25 and 0.1. A follow-up study is planned to directly measure copolymer composition from low-conversion experiments to determine whether the measured compositions differ significantly with decreased αEtoD from those calculated using the reactivity ratios determined in this in situ NMR study.
Effect of solvent on copolymerization rates
While the focus of this study is the influence of solvent and methacrylate functionality on monomer reactivity ratios, insights can be also gained by analyzing how the reaction conditions influence the rates of overall monomer conversion. Assuming a constant volume batch reaction, radical stationarity, and negligible side reactions, the rate of monomer conversion can be written as: | (5) |
Eqn (5) can be integrated assuming that the copolymerization kinetic rate coefficients are constant with conversion, to yield the lumped rate coefficient kcopp/(kcopt)0.5:
 | (6) |
![[thin space (1/6-em)]](https://www.rsc.org/images/entities/char_2009.gif) 37 at 60 °C, respectively, and initiator efficiency, f, is set to 0.8.38 For a copolymerization system, the propagation (kcopp) and termination (kcopt) rate coefficients will both vary with comonomer composition. However, it can be generally assumed that the variation in their ratio is mainly an indication of a change in kcopp; as a diffusion-controlled rate coefficient, kcopt is largely a function of solution viscosity.39,40
37 at 60 °C, respectively, and initiator efficiency, f, is set to 0.8.38 For a copolymerization system, the propagation (kcopp) and termination (kcopt) rate coefficients will both vary with comonomer composition. However, it can be generally assumed that the variation in their ratio is mainly an indication of a change in kcopp; as a diffusion-controlled rate coefficient, kcopt is largely a function of solution viscosity.39,40
The calculated lumped values for MA/MAA copolymerization in DMSO-d6 and D2O![[thin space (1/6-em)]](https://www.rsc.org/images/entities/char_2009.gif) :
:![[thin space (1/6-em)]](https://www.rsc.org/images/entities/char_2009.gif) EtOD (αEtOD = 0.5) are plotted against overall monomer conversion in Fig. 11(a) and (b) for wmon,0 = 0.1 and 0.5, respectively. The curves are relatively flat for wmon,0 = 0.1 but show a slight and consistent increase with increasing monomer conversion for wmon,0 = 0.5. This difference is attributed to the Trommsdorff effect,41,42 with the increased viscosity of the polymerizing system containing 50 wt% monomer with conversion causing a decrease in kt
EtOD (αEtOD = 0.5) are plotted against overall monomer conversion in Fig. 11(a) and (b) for wmon,0 = 0.1 and 0.5, respectively. The curves are relatively flat for wmon,0 = 0.1 but show a slight and consistent increase with increasing monomer conversion for wmon,0 = 0.5. This difference is attributed to the Trommsdorff effect,41,42 with the increased viscosity of the polymerizing system containing 50 wt% monomer with conversion causing a decrease in kt![[thin space (1/6-em)]](https://www.rsc.org/images/entities/char_2009.gif) 43 and therefore an increase in the kp/k0.5t ratio. The monomer conversion profiles shown as Fig. S9† demonstrate an acceleration in the rate of conversion with time, consistent with this interpretation. However, a systematic variation of kcopp with conversion cannot be ruled out. Assuming terminal model kinetics, the composition-averaged value is a function of the two homopropagation rate coefficients as well as the system reactivity ratios:
43 and therefore an increase in the kp/k0.5t ratio. The monomer conversion profiles shown as Fig. S9† demonstrate an acceleration in the rate of conversion with time, consistent with this interpretation. However, a systematic variation of kcopp with conversion cannot be ruled out. Assuming terminal model kinetics, the composition-averaged value is a function of the two homopropagation rate coefficients as well as the system reactivity ratios:
 | (7) |
As homopropagation kp values for acrylates are ∼50 times higher than methacrylates,44 the increase in fMA with conversion (Fig. 5 and 8a) will also lead to an increase in kcopp. Note that changes in either value with conversion violates the “constant coefficient” assumption made when integrating eqn (5) to obtain eqn (6). Thus, we restrict ourselves to qualitative discussion of the observed trends.
With the exception of fMA,0 = 0.8 with wmon,0 = 0.5 in Fig. 11b, the polymerization rates are higher in D2O![[thin space (1/6-em)]](https://www.rsc.org/images/entities/char_2009.gif) :
:![[thin space (1/6-em)]](https://www.rsc.org/images/entities/char_2009.gif) EtOD than in DMSO-d6, consistent with previous results showing that kcopp values are elevated in alcohol/water mixtures.16 Furthermore, as expected from eqn (7), the kp/(kt)0.5 ratio increases as the MA fraction is increased from fMA,0 = 0.2 to 0.8. It is interesting to note that the relative increase is quite system dependent; the relative change in kp/(kt)0.5 with fMA,0 in D2O
EtOD than in DMSO-d6, consistent with previous results showing that kcopp values are elevated in alcohol/water mixtures.16 Furthermore, as expected from eqn (7), the kp/(kt)0.5 ratio increases as the MA fraction is increased from fMA,0 = 0.2 to 0.8. It is interesting to note that the relative increase is quite system dependent; the relative change in kp/(kt)0.5 with fMA,0 in D2O![[thin space (1/6-em)]](https://www.rsc.org/images/entities/char_2009.gif) :
:![[thin space (1/6-em)]](https://www.rsc.org/images/entities/char_2009.gif) EtOD is much larger for wmon,0 = 0.1 (Fig. 11a) than for wmon,0 = 0.5 (Fig. 11b) for the MA/MAA system.
EtOD is much larger for wmon,0 = 0.1 (Fig. 11a) than for wmon,0 = 0.5 (Fig. 11b) for the MA/MAA system.
The same analysis was completed for the MA/DEGMEMA conversion profiles measured in DMSO-d6 and D2O![[thin space (1/6-em)]](https://www.rsc.org/images/entities/char_2009.gif) :
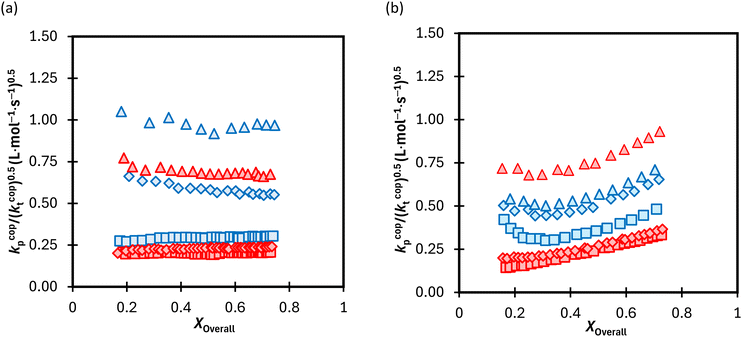
:![[thin space (1/6-em)]](https://www.rsc.org/images/entities/char_2009.gif) EtOD, as summarized in Fig. S10.† Results for the two systems are compared in Fig. 12, with the average kp/(kt)0.5 values calculated from data in the 0.15 to 0.50 conversion range to minimize the influence of changing kcopp (due to changing fMA) and/or kt (due to the Trommsdorff effect). For all systems with fMA,0 = 0.2 and 0.5, polymerization is faster in MA/DEGMEMA (i.e., higher kp/(kt)0.5) than the corresponding MA/MAA system. This result may be explained by a lowered kt value for DEGMEMA compared to MAA because of the bulkier monomer.15 However, the opposing behavior – a higher kp/(kt)0.5 value for MA/MAA than MA/DEGMEMA – is seen for some solvent conditions with fMA,0 = 0.8. A more complete interpretation of these trends, including evaluating the suitability of terminal model kinetics to represent kcopp,22,23 will be possible once kcopp is directly measured by PLP/SEC (pulsed-laser polymerization combined with size exclusion chromatography analysis), a study that is currently underway. Nonetheless, it is clear from this analysis that copolymerization rates are strongly influenced by both solvent composition and overall comonomer concentration, in contrast to the weak dependencies observed in comonomer reactivity ratios.
EtOD, as summarized in Fig. S10.† Results for the two systems are compared in Fig. 12, with the average kp/(kt)0.5 values calculated from data in the 0.15 to 0.50 conversion range to minimize the influence of changing kcopp (due to changing fMA) and/or kt (due to the Trommsdorff effect). For all systems with fMA,0 = 0.2 and 0.5, polymerization is faster in MA/DEGMEMA (i.e., higher kp/(kt)0.5) than the corresponding MA/MAA system. This result may be explained by a lowered kt value for DEGMEMA compared to MAA because of the bulkier monomer.15 However, the opposing behavior – a higher kp/(kt)0.5 value for MA/MAA than MA/DEGMEMA – is seen for some solvent conditions with fMA,0 = 0.8. A more complete interpretation of these trends, including evaluating the suitability of terminal model kinetics to represent kcopp,22,23 will be possible once kcopp is directly measured by PLP/SEC (pulsed-laser polymerization combined with size exclusion chromatography analysis), a study that is currently underway. Nonetheless, it is clear from this analysis that copolymerization rates are strongly influenced by both solvent composition and overall comonomer concentration, in contrast to the weak dependencies observed in comonomer reactivity ratios.
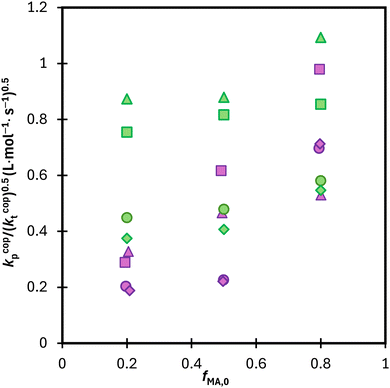 | ||
Fig. 12 Calculated average lumped rate coefficient (kcopp/(kcopt)0.5) from data presented in Fig. 11 and S10† from conversion 0.15–0.5 for MA–MAA (purple) and MA–DEGMEMA (green) with wmon = 0.5 in DMSO-d6 (◊), wmon = 0.1 in DMSO-d6 (○), wmon = 0.5 in D2O![[thin space (1/6-em)]](https://www.rsc.org/images/entities/char_2009.gif) : :![[thin space (1/6-em)]](https://www.rsc.org/images/entities/char_2009.gif) EtOD (Δ) and wmon = 0.5 in D2O EtOD (Δ) and wmon = 0.5 in D2O![[thin space (1/6-em)]](https://www.rsc.org/images/entities/char_2009.gif) : :![[thin space (1/6-em)]](https://www.rsc.org/images/entities/char_2009.gif) EtOD (□) with αEtOD = 0.5. αEtOD refers to wt% of EtOD in D2O EtOD (□) with αEtOD = 0.5. αEtOD refers to wt% of EtOD in D2O![[thin space (1/6-em)]](https://www.rsc.org/images/entities/char_2009.gif) : :![[thin space (1/6-em)]](https://www.rsc.org/images/entities/char_2009.gif) EtOD mixture. EtOD mixture. | ||
Conclusions
In situ NMR is used to study the solution radical copolymerization of MA with MAA and DEGMEMA in deuterated DMSO and ethanol–water mixtures at 60 °C up to high conversions. The drift in fMA with overall monomer conversion was employed to estimate reactivity ratios, with good agreement in the best-fit values found using three different methodologies. While small variations with monomer concentration cannot be ruled out, the experimental data are well-fit using a single pair of reactivity ratios for MA/DEGMEMA in DMSO-d6 and toluene-d8, for MA/DEGMEMA in D2O![[thin space (1/6-em)]](https://www.rsc.org/images/entities/char_2009.gif) :
:![[thin space (1/6-em)]](https://www.rsc.org/images/entities/char_2009.gif) EtOD (αEtOD = 0.5), and for MA/MAA in D2O
EtOD (αEtOD = 0.5), and for MA/MAA in D2O![[thin space (1/6-em)]](https://www.rsc.org/images/entities/char_2009.gif) :
:![[thin space (1/6-em)]](https://www.rsc.org/images/entities/char_2009.gif) EtOD (αEtOD = 0.5). Switching from DMSO-d6 or toluene-d8 to D2O
EtOD (αEtOD = 0.5). Switching from DMSO-d6 or toluene-d8 to D2O![[thin space (1/6-em)]](https://www.rsc.org/images/entities/char_2009.gif) :
:![[thin space (1/6-em)]](https://www.rsc.org/images/entities/char_2009.gif) EtOD has little influence on MA/DEGMEMA copolymer composition, suggesting that the H-bonding introduced by the solvent affects both monomers equally. However, there was a significant influence of monomer concentration on the r values for MA/MAA in DMSO-d6, explained by competitive solvent-monomer and monomer–monomer complexation involving the carboxyl functionality of MAA.
EtOD has little influence on MA/DEGMEMA copolymer composition, suggesting that the H-bonding introduced by the solvent affects both monomers equally. However, there was a significant influence of monomer concentration on the r values for MA/MAA in DMSO-d6, explained by competitive solvent-monomer and monomer–monomer complexation involving the carboxyl functionality of MAA.
The copolymer composition plots for MA/MAA and MA/DEGMEMA in the polar D2O![[thin space (1/6-em)]](https://www.rsc.org/images/entities/char_2009.gif) :
:![[thin space (1/6-em)]](https://www.rsc.org/images/entities/char_2009.gif) EtOD mixture are not only independent of monomer concentration, the curves for the two systems almost overlap. Supported by other literature, the results support the conclusion that the copolymerization behavior of all methacrylate–acrylate systems – whether involving functional or non-functional monomers – becomes uniform in protic polar aqueous solution, even though differences are seen when copolymerization behavior is compared to bulk or in solvents such as toluene and DMSO. Thus, values of rmethacrylate = 2.2–2.4 and racrylate = 0.28 ± 0.02 should capture the relationship between comonomer and copolymer composition for any acrylate/methacrylate system in polar solution, including BA/MMA in emulsion systems. In contrast to the weak dependencies observed in comonomer reactivity ratios, however, the overall rates of conversion are strongly influenced by comonomer choice (MAA vs. DEGMEMA), solvent composition, and overall comonomer concentration. The validity of these conclusions as the system is moved toward pure water will be examined by measuring copolymer composition and kcopp values at low conversion using the PLP/SEC technique.
EtOD mixture are not only independent of monomer concentration, the curves for the two systems almost overlap. Supported by other literature, the results support the conclusion that the copolymerization behavior of all methacrylate–acrylate systems – whether involving functional or non-functional monomers – becomes uniform in protic polar aqueous solution, even though differences are seen when copolymerization behavior is compared to bulk or in solvents such as toluene and DMSO. Thus, values of rmethacrylate = 2.2–2.4 and racrylate = 0.28 ± 0.02 should capture the relationship between comonomer and copolymer composition for any acrylate/methacrylate system in polar solution, including BA/MMA in emulsion systems. In contrast to the weak dependencies observed in comonomer reactivity ratios, however, the overall rates of conversion are strongly influenced by comonomer choice (MAA vs. DEGMEMA), solvent composition, and overall comonomer concentration. The validity of these conclusions as the system is moved toward pure water will be examined by measuring copolymer composition and kcopp values at low conversion using the PLP/SEC technique.
Data availability
The best-fit reactivity ratios measured in this study are summarized in Tables 1–3. NMR data supporting this article have been included as part of the ESI.†Author contributions
Conceptualization: N. R., F. S., R. A. H., Data curation: N. R., F. S., Formal analysis: N. R., F. S., Funding acquisition: R. A. H., Investigation: all authors, Methodology: all authors, Software: N. R., Supervision: R. A. H., Validation: N. R., Writing – original draft: N. R., Writing – review & editing: N. R., R. A. H.Conflicts of interest
There are no conflicts to declare.Acknowledgements
The authors acknowledge the funding received from BASF SE, and Dr Hugo Vale (BASF SE) and Prof. Igor Lacík (Polymer Institute of the Slovak Academy of Sciences) for fruitful technical discussions.References
- P. A. Lovell and F. J. Schork, Fundamentals of Emulsion Polymerization, Biomacromolecules, 2020, 21, 4396–4441 CrossRef CAS PubMed
.
-
Polymer Colloids Formation, Characterization and Applications, ed. R. D. Priestley and R. Prud'homme, The Royal Society of Chemistry, 2020 Search PubMed
.
-
D. Urban, B. Schuler and J. Schmidt-Thummes, in Chemistry and technology of emulsion polymerisation, ed. A. M. van Herk, Wiley, UK, 2nd edn, 2013, p. 347 Search PubMed
.
- M. Aguirre, N. Ballard, E. Gonzalez, S. Hamzehlou, H. Sardon, M. Calderon, M. Paulis, R. Tomovska, D. Dupin, R. H. Bean, T. E. Long, J. R. Leiza and J. M. Asua, Polymer Colloids: Current Challenges, Emerging Applications, and New Developments, Macromolecules, 2023, 56, 2579–2607 CrossRef CAS PubMed
.
- J. M. Asua, A new model for radical desorption in emulsion polymerization, Macromolecules, 2003, 36, 6245–6251 CrossRef CAS
.
- H. M. Vale and T. F. Mckenna, Particle formation in vinyl chloride emulsion polymerization: Reaction modeling, Ind. Eng. Chem. Res., 2009, 48, 5193–5210 CrossRef CAS
.
- J. P. A. Heuts and G. T. Russell, The nature of the chain-length dependence of the propagation rate coefficient and its effect on the kinetics of free-radical polymerization. 1. Small-molecule studies, Eur. Polym. J., 2006, 42, 3–20 CrossRef CAS
.
- W. V. Smith and R. H. Ewart, Kinetics of Emulsion Polymerization Kinetics of Emulsion Polymerization, J. Chem. Phys., 1948, 16, 592–599 CrossRef CAS
.
- F. K. Hansen and J. Ugelstad, Particle Nucleation in Emulsion Polymerization - 1. a Theory for Homogeneous Nucleation., J. Polym. Sci., Polym. Chem. Ed., 1978, 16, 1953–1979 CrossRef CAS
.
- M. Zubitur, P. D. Armitage, S. Ben Amor, J. R. Leiza and J. M. Asua, Mathematical modeling of multimonomer (vinylic, divinylic, acidic) emulsion copolymerization systems, Polym. React. Eng., 2003, 11, 627–662 CrossRef CAS
.
- J. Herrera-Ordonez, C. L. Azanza Ricardo and D. Victoria-Valenzuela, On the diffusive step of free-radical entry in emulsion polymerization and the applicability of the Smoluchowski rate coefficient, Colloids Surf., A, 2018, 556, 134–139 CrossRef CAS
.
- P. Daswani and A. Van Herk, Entry in emulsion copolymerization: Can the existing models be verified?, Macromol. Theory Simul., 2011, 20, 614–620 CrossRef CAS
.
- S. Beuermann, M. Buback, P. Hesse and I. Lacík, Free-radical propagation rate coefficient of nonionized methacrylic acid in aqueous solution from low monomer concentrations to bulk polymerization, Macromolecules, 2006, 39, 184–193 CrossRef CAS
.
- I. Refai, M. Agboluaje and R. A. Hutchinson, Radical copolymerization kinetics of N-tert -butyl acrylamide and methyl acrylate in polar media, Polym. Chem., 2022, 13, 2036–2047 RSC
.
- M. Buback, R. A. Hutchinson and I. Lacík, Radical polymerization kinetics of water-soluble monomers, Prog. Polym. Sci., 2023, 138, 101645 CrossRef CAS
.
- M. Agboluaje, I. Refai, H. H. Manston, R. A. Hutchinson, E. Dušička, A. Urbanová and I. Lacík, A comparison of the solution radical propagation kinetics of partially water-miscible non-functional acrylates to acrylic acid, Polym. Chem., 2020, 11, 7104–7114 RSC
.
- S. Hamzehlou, Y. Reyes and J. R. Leiza, Modeling the Mini-Emulsion Copolymerization of N -Butyl Acrylate with a Water-Soluble Monomer: A Monte Carlo Approach, Ind. Eng. Chem. Res., 2014, 53, 8996–9003 CrossRef CAS
.
- G. S. Georgiev and I. G. Dakova, Solvent effect on the methacrylic acid-methyl methacrylate radical copolymerization. Analytical estimation by linear and nonlinear solvation energy relationships, Macromol. Chem. Phys., 1994, 195, 1695–1707 CrossRef CAS
.
- G. A. Stahl, Copolymerization Parameters of Methyl Methacrylate and Acrylic Acid, J. Polym. Sci., Part A-1: Polym. Chem., 1981, 19, 371–380 CAS
.
- M. Agboluaje and R. A. Hutchinson, The effect of hydrogen bonding on the copolymerization kinetics of 2-methoxyethyl acrylate with 2-hydroxyethyl methacrylate in alcohol and aqueous solutions, Can. J. Chem. Eng., 2022, 100, 689–702 CrossRef CAS
.
- L. A. Idowu and R. A. Hutchinson, Solvent Effects on Radical Copolymerization Kinetics of 2-Hydroxyethyl Methacrylate and Butyl Methacrylate, Polymers, 2019, 11, 487 CrossRef
.
- J. E. S. Schier, D. Cohen-Sacal and R. A. Hutchinson, Hydrogen bonding in radical solution copolymerization kinetics of acrylates and methacrylates: a comparison of hydroxy- and methoxy-functionality, Polym. Chem., 2017, 8, 1943–1952 RSC
.
- J. E. S. Schier and R. A. Hutchinson, The influence of hydrogen bonding on radical chain-growth parameters for butyl methacrylate/2-hydroxyethyl acrylate solution copolymerization, Polym. Chem., 2016, 7, 4567–4574 RSC
.
- P. Deglmann, K. Hungenberg and H. M. Vale, Dependence of Copolymer Composition in Radical Polymerization on Solution Properties: a Quantitative Thermodynamic Interpretation, Ind. Eng. Chem. Res., 2021, 60, 10566–10583 CrossRef CAS
.
- P. Daswani and A. van Herk, Selective Adsorption of Aqueous Phase Co-Oligomers on Latex Particles Part 1: Influence of Different Initiator Systems, Macromol. Theory Simul., 2017, 26, 1600047 CrossRef
.
- K. Ouzineb, M. Fortuny Heredia, C. Graillat and T. F. Mckenna, Stabilization and kinetics in the emulsion copolymerization of butyl acrylate and methyl methacrylate, J. Polym. Sci., Part A: Polym. Chem., 2001, 39, 2832–2846 CrossRef CAS
.
- M. Agboluaje and R. A. Hutchinson, Measurement and Modeling of Methyl Acrylate Radical Polymerization in Polar and Nonpolar Solvents, Ind. Eng. Chem. Res., 2022, 61, 6398–6413 CrossRef CAS
.
- S. S. Cutié, D. E. Henton, C. Powell, R. E. Reim, P. B. Smith and T. L. Staples, The Effects of MEHQ on the Polymerization of Acrylic Acid in the Preparation of Superabsorbent Gels, J. Appl. Polym. Sci., 1997, 64, 577–589 CrossRef
.
- B. Mbergen, W. Heitler, E. Teller, P. Roy Soc, E. M. Purcell, H. C. Torrey, R. V. Pound, B. Rollin, J. Hatton, A. H. Cooke and R. J. Benzie, Relaxation Effects in Nuclear Magnetic Resonance Absorption, Phys. Rev., 1948, 73, 679–711 CrossRef
.
- C. Preusser and R. A. Hutchinson, An In situ NMR Study of Radical Copolymerization Kinetics of Acrylamide and Non-Ionized Acrylic Acid in Aqueous Solution, Macromol. Symp., 2013, 333, 122–137 CrossRef CAS
.
- N. Kazemi, T. A. Duever and A. Penlidis, Reactivity Ratio Estimation from Cumulative Copolymer Composition Data, Macromol. React. Eng., 2011, 5, 385–403 CrossRef CAS
.
- A. A. A. Autzen, S. Beuermann, M. Drache, C. M. Fellows, S. Harrisson, A. M. Van Herk, R. A. Hutchinson, A. Kajiwara, D. J. Keddie, B. Klumperman and G. T. Russell, IUPAC recommended experimental methods and data evaluation procedures for the determination of radical copolymerization reactivity ratios from composition data, Polym. Chem., 2024, 15, 1851–1861 RSC
.
- V. E. Meyer and G. G. Lowry, Integral and Differential Binary Copolymerization Equations, J. Polym. Sci., Part A: Gen. Pap., 1965, 3, 2843–2851 CrossRef CAS
.
- A. L. Burke, T. A. Duever and A. Penlidis, Revisiting the design of experiments for copolymer reactivity ratio estimation, J. Polym. Sci., Part A: Polym. Chem., 1993, 31, 3065–3072 CrossRef CAS
.
- R. Makuška, G. I. Bayoras, Y. K. Shulskus, A. B. Bolotin, Z. A. Roganova and A. L. Smolyanskii, Effect of complex formation on reactivity of acrylic and methacrylic acids in radical polymerization, Polym. Sci. U.S.S.R., 1985, 27, 634–641 CrossRef
.
- AIBN|CAS:78-67-1|2,2′-Azobis(isobutyronitrile)|FUJIFILM Wako Chemicals U.S.A. Corporation, https://specchem-wako.fujifilm.com/us/oil-soluble-azo-initiators/AIBN.htm, (accessed 23 May 2024).
- V-50|CAS:2997-92-4|2,2′-Azobis(2-methylpropionamidine)dihydrochloride|AAPH|FUJIFILM Wako Chemicals U.S.A. Corporation, https://specchem-wako.fujifilm.com/us/water-soluble-azo-initiators/V-50.htm, (accessed 23 May 2024).
- I. H. Ezenwajiaku, A. Chovancová, K. C. Lister, I. Lacík and R. A. Hutchinson, Experimental and Modeling Investigation of Radical Homopolymerization of 2-(Methacryloyloxyethyl) Trimethylammonium Chloride in Aqueous Solution, Macromol. React. Eng., 2020, 14, 1900033 CrossRef CAS
.
- G. A. O'Neil, M. B. Wisnudel and J. M. Torkelson, A critical experimental examination of the gel effect in free radical polymerization: Do entanglements cause autoacceleration?, Macromolecules, 1996, 29, 7477–7490 CrossRef
.
- T. J. Tulig and M. Tirrell, On the Onset of the Trommsdroff effect, Macromolecules, 1982, 15, 459–463 CrossRef CAS
.
- E. Trommsdorff, H. Köhle and P. Lagally, For the polymerization of the methacrylic acid methyl ester, Macromol. Chem., 1948, 169–198 CrossRef CAS
.
- G. V. Schulz and G. Harborth, About the mechanism of the explosive polymerization course of the methacrylic acid methyl ester, Macromol. Chem., 1947, 106–139 CrossRef CAS
.
- P. Zhan, J. Chen, A. Zheng, H. Shi, F. Chen, D. Wei, X. Xu and Y. Guan, The Trommsdorff effect under shear and bulk polymerization of methyl methacrylate via reactive extrusion, Eur. Polym. J., 2020, 122, 109272 CrossRef CAS
.
- S. Beuermann, S. Harrisson, R. A. Hutchinson, T. Junkers and G. T. Russell, Update and critical reanalysis of IUPAC benchmark propagation rate coefficient data, Polym. Chem., 2022, 13, 1891–1900 RSC
.
Footnote |
| † Electronic supplementary information (ESI) available. See DOI: https://doi.org/10.1039/d4py01015a |
| This journal is © The Royal Society of Chemistry 2024 |

