 Open Access Article
Creative Commons Attribution 3.0 Unported Licence
Effect of architecture on the thermo-induced phase transition of methacrylate-based symmetric pentablock terpolymers†
Shaobai
Wang
,
Xu
Liu‡
,
Shuchen
Wang‡
and
Theoni K.
Georgiou
 *
*
Department of Materials, Royal School of Mines, Imperial College London, London SW7 2AZ, UK. E-mail: t.georgiou@imperial.ac.uk
First published on 14th November 2024
Abstract
A series of six symmetric pentablock terpolymers were synthesised using group transfer polymerisation (GTP). The chemical composition of these terpolymers comprises 45 wt% of oligo(ethylene glycol) methyl ether methacrylate (molar mass = 300 g mol−1, OEGMA300, block A), 30 wt% of n-butyl methacrylate (BuMA, block B), and 25 wt% of di(ethylene glycol) methyl ether methacrylate (DEGMA, block C), aiming at a total molar mass (MM) of 9200 g mol−1 with varied architectures, including ABCBA, CBABC, BCACB, ACBCA, BACAB, and CABAC. The impact of the polymer architecture (specifically the block number and sequence) was evaluated by comparing the properties of these pentablock terpolymers in aqueous solution, including micellisation, thermo-induced phase transition and gelation, and rheological properties, with each other and the triblock controls (ABC, ACB, and CAB). It was found that the cloud point temperature (Tcp) of the pentablock terpolymer solution is related to the corresponding micelle conformation, which is dependent on the architecture of the polymer chain. Moreover, the BCACB pentablock terpolymer demonstrated enhanced gelation performance, exhibiting a broader gelation range in terms of both concentration and temperature as well as higher storage modulus (G′), compared to other pentablock and triblock counterparts.
1 Introduction
Thermoresponsive polymers are a class of polymeric materials that alter the physical properties after receiving an external thermal stimulus.1–4 Such a feature renders them substantially interesting for a wide range of applications in multiple fields, including medical diagnostics and therapeutics, energy storage, high efficiency adsorption and separation, and nanoreactors for green synthesis.5–14 Among these thermoresponsive polymers, those exhibiting a lower critical solution temperature (LCST) behaviour in aqueous solution have been intensively investigated in recent decades.1–3,15 At elevated temperatures, the hydrogen bonding in the system becomes less favourable, compared to the hydrophobic polymer–polymer interactions.4,15–18 This leads to the expulsion of the hydrogen-bonded water molecules from the hydrophilic regions of the polymer chain into the bulk solvent, as well as the disruption of the cage-like arrangement of the water molecules surrounding the hydrophobic segments of the polymer chain.19 From a thermodynamic perspective, the increase in entropy resulting from these disrupted water molecules further drives the solubility change of the polymer and the LCST-type phase transition in the solution. This is typically manifested by precipitation (phase separation) and in some cases, gelation.4,15,16,18,20–22Particularly, the gellable LCST-type thermoresponsive polymers have gained increasing attention in biomedical fields.5,6,15,23–25 Compared to other forms of biomaterials, hydrogels can offer numerous advantages, including porous structure, high water content, biocompatibility, etc., rendering them exceptionally suitable for a variety of biomedical applications, such as tissue regeneration, controlled drug release, and bio-sensing.26,27Considering the significant dependence of the biomedical functionality of the thermoresponsive polymers on their transition behaviours, it becomes essential to finely adjust the transition-related properties of the polymers to meet the needs of the biomedical applications. Benefiting from the development of “living” and controlled copolymerisation techniques, a promising strategy involves the use of amphiphilic block copolymers. By altering the structural factors of the polymer, such as the chain architecture (block number and sequence), chemical composition, and molar mass (MM), the balance between the hydrophobic and hydrophilic interactions can be precisely tuned, leading to customisable transition behaviours of the polymers.20,28 One of the most widely studied thermoresponsive block copolymers is Pluronic® F127, which is also among the few thermogels involved in clinical trials.2,6,28–32 This linear ABA triblock copolymer contains two hydrophilic poly(ethylene oxide) blocks (A) on both sides and a hydrophobic poly(propylene oxide) block (B) in the middle.29 As an FDA-approved, commercially available product, Pluronic® F127 exhibits a high biocompatibility with a gelling range that can be easily altered by changing the concentration, rendering it a promising gelling agent for biomedical applications.2,6,29,30
Owing to the advances in controlled copolymerisation techniques, amphiphilic block copolymers in other structures can also be conveniently prepared and their thermoresponsive properties have been intensively investigated.1,17,33–35 For example, our group reported a series of ABC triblock terpolymers that can form hydrogel in the physiological temperature range, depending on the concentration and composition.31,36 These terpolymers are composed of a hydrophilic block A of poly(oligo(ethylene glycol) methyl ether methacrylate) (average MM of monomer = 300 g mol−1, OEGMA300), a hydrophobic block B of poly(n-butyl methacrylate) (BuMA), and a less-hydrophilic block C of poly(di(ethylene glycol) methyl ether methacrylate) (DEGMA). For the optimised terpolymer with a chemical composition of 40–35–25 wt% (A–B–C) and an overall MM of 10![[thin space (1/6-em)]](https://www.rsc.org/images/entities/char_2009.gif) 000 g mol−1, the critical gelation concentration (CGC) was found at a surprisingly low level of 2 wt%, in contrast to 15 wt% of Pluronic® F127.31,36 As it can form hydrogel and deliver the designed biomedical functions in such a low concentration, the utilisation of this thermoresponsive polymer could be highly advantageous in biomedical applications for its high cost-efficiency and potentially low cytotoxicity.31 Additionally, the low viscosity of the polymer solution renders it particularly suitable for applications requiring injections through a narrow needle, such as injectable hydrogels. In contrast, the high viscosity of Pluronic® F127 solutions may limit its broader use in such applications.31,36
000 g mol−1, the critical gelation concentration (CGC) was found at a surprisingly low level of 2 wt%, in contrast to 15 wt% of Pluronic® F127.31,36 As it can form hydrogel and deliver the designed biomedical functions in such a low concentration, the utilisation of this thermoresponsive polymer could be highly advantageous in biomedical applications for its high cost-efficiency and potentially low cytotoxicity.31 Additionally, the low viscosity of the polymer solution renders it particularly suitable for applications requiring injections through a narrow needle, such as injectable hydrogels. In contrast, the high viscosity of Pluronic® F127 solutions may limit its broader use in such applications.31,36
By altering the polymer architecture, specifically the block number and sequence, block copolymers with more complex structures can be prepared, offering greater opportunities for modifications to achieve enhanced performance and sophisticated functions. Compared to thermoresponsive diblock or triblock copolymers, it has been reported that by introducing additional blocks at proper positions with an appropriate chemical composition, linear multi-block copolymers may exhibit an enhanced thermoresponsive performance, such as a broader gelation range.28,37–39 As illustrated in our previous study, by modifying one of the previously mentioned ABC poly(OEGMA300-b-BuMA-b-DEGMA) triblock terpolymers (40–30–30 wt%) into an ABCA tetrablock terpolymer (20–30–30–20 wt%), the CGC was found to decrease from 10 wt% for the original ABC to 5 wt% for ABCA.28 Additionally, the hydrogel formed by ABCA exhibited an enhanced thermal stability, remaining intact until 80 °C, whereas the ABC hydrogel precipitated below 50 °C, depending on the concentration. However, the tetrablock terpolymers in other architectures, such as ABAC, ACAB, BACB, etc., either showed declined gelation properties or were completely non-gellable. In terms of pentablock copolymers, few studies have reported on symmetric pentablock copolymers compared to their corresponding triblock counterpart.37,38 These pentablock copolymers, synthesised using bifunctional initiators and non-(meth)acrylate monomers, was reported to present enhanced gelation performance compared to their triblock counterparts. However, these studies only compared a single pentablock architecture with the corresponding triblock counterpart. In summary, although some studies indicated that increasing the number of blocks of a copolymer may promote its thermo-induced gelation and other performance in the solution, systematic investigations on the role of the architecture of multiblock copolymers are still of limited number.
Specifically in this study, inspired by our previous research on the triblock and tetrablock terpolymers constituted by OEGMA300 (block A), BuMA (block B), and DEGMA (block C), six symmetric pentablock terpolymers consisting of the same monomers were prepared, covering all the possible architectures, i.e., ABCBA, CBABC, ACBCA, BCACB, BACAB, and CABAC. To investigate the role of architecture when the terpolymer is altered from triblock to pentablock, the properties of the polymers in aqueous solution, including self-assembly, thermo-induced phase transition and gelation, and rheological properties of the hydrogels, were systematically assessed via multiple techniques and compared with each other and the triblock counterparts, i.e., ABC, ACB, and CAB terpolymers. For all the polymers, the synthesis was carried out via one-pot group transfer polymerisation (GTP), which is well acknowledged for its rapid kinetics, precise control over the polymer structure, and quantitative yield on larger scales.40,41 Using this technique, the overall MM and the composition of the polymers were controlled approximately at 9200 g mol−1 and 45–30–25 wt% (A–B–C), respectively. To the best of our knowledge, this is the first study to systematically vary the architecture, i.e., position of the blocks, in symmetric pentablock terpolymers to investigate its effect on the self-assembly and thermoresponsive properties of the polymers.
2 Experimental
2.1 Materials
The majority of chemical reagents involved in this research were purchased from Sigma-Aldrich UK, including methyl trimethylsilyl dimethylketene acetal (MTS, 95%), OEGMA300 (95%, contains 100 ppm MEHQ as inhibitor), DEGMA (95%, contains 100 ppm MEHQ), BuMA (99%, MEHQ-inhibited), THF (>99.9%, anhydrous, inhibitor-free), 2,2-diphenyl-1-picrylhydrazyl (DPPH), CaH2 (90%, powder), dimethyl cyclohexane-1,4-dicarboxylate (mixture of cis and trans, 97%), chlorotrimethylsilane (CTMS, >99%), lithium diisopropylamide solution (LDA, 1 M in THF/hexane), dimethyldichloridesilane (DMDCS, 99.5%), phosphate-buffered saline (PBS) pellets (pH = 7.4), basic alumina, and pyrene (98%). The catalyst of the polymerisation, tetrabutyl ammonium bibenzoic acid (TBABB), was prepared in advance of this study according to a previous report by Dicker et al.42 Acetone (99%) and n-hexane (>98%) were from Fisher Scientific. Triethanolethylamine (Et3N, 99%) was from Fluorochem, chloroform-d (CDCl3, 99.80%D) was from Thermo Fisher Scientific, and deuterium oxide (D2O, 99.90%D) was from Eurisotope.2.2 Synthesis of 1,4-bis(methoxytrimethylsiloxymethylene)-cyclohexane (MTSMC)
The bifunctional initiator, MTSMC, was synthesised using a known route reported by Steinbrecht and Bandermann with a slight modification,43 which is described as follows: 100 mL of THF was injected into an argon-purged flask cooled in a liquid nitrogen-acetone bath, followed by the addition of 77 mL LDA solution (2.2 equiv.) and 6.3 mL dimethyl cyclohexane-1,4-dicarboxylate (dried by CaH2, 1.0 equiv.). After reacting for 90 min, 9.8 mL CTMS (2.2 equiv.) was added into the system and reacted for another 90 min. The reaction route is shown in Scheme 1. The reaction mixture was first dried by rotary evaporation at 80 °C for 60 min to remove the majority of solvents and other liquid by-products. MTSMC was then obtained by further distillation at 130 °C in high vacuum. 1H NMR (CDCl3, 400 MHz): δH 3.81–3.21 (6H, m), 2.70–1.44 (8H, m), 0.48–0.05 (18H, m). The 1H NMR spectrum is presented in Fig. S1† and agrees well with the previous report.43 | ||
| Scheme 1 The reaction route of MTSMC, the bifunctional initiator for GTP. Cis/trans isomerism of the chemical species has been omitted for simplicity. | ||
2.3 Monomer purification and polymerisation procedure
DEGMA and BuMA were purified by directly passing through a basic alumina column twice. To remove moisture and alcohol-based impurities, the monomers were stored with CaH2 and DPPH over two weeks. OEGMA300 was mixed with THF at 50 vol%, followed by passing through a basic alumina column twice and stored with CaH2 only. MTSMC was dried by CaH2 overnight before the polymerisation. Except for OEGMA300 and MTSTC that are directly injected into the reaction by a filter syringe, all other liquid compounds, including DEGMA, BuMA, and MTS, were distilled before the polymerisation. In this study, the polymers were obtained via the one-pot GTP technique. In such a system, ∼10 mg TBABB was placed in a 250 mL round-bottom flask pre-hydrophobized by 250 μL DMDCS, followed by purging under argon flow and the addition of ∼50 mL THF and the initiator. The monomers were then injected into the system in the designed sequence. After reacting for 15 min for each monomer, 0.2 mL of the reaction mixture was taken out as sample. The polymers were precipitated in n-hexane and dried in vacuum for 30 days till a constant weight was reached.2.4 Characterisations
| T (%) = 102–A | (1) |
3 Results and discussion
In this section, the chemical structure of the obtained terpolymers was determined by GPC and 1H NMR, followed by detailed characterisations and comparisons of the aqueous properties using DLS, TEM, turbidimetry, VT-1H NMR, and rheometry.3.1 Synthesis of the terpolymers
To investigate the effect of architecture, we designed six symmetric linear pentablock terpolymers covering all the possible architectures, i.e., ABCBA, CBABC, ACBCA, BCACB, BACAB, and CABAC; and three triblock terpolymers, ABC, ACB, and CAB, for comparison. For the conciseness, the polymers were named after the corresponding architecture and categorised into three groups based on their symmetry, i.e., Group I: ABCBA, CBABC, and ABC; Group II: ACBCA, BCACB, and ACB; and Group III: BACAB, CABAC, and CAB. The composition of the terpolymers was 45–30–25 wt% (A–B–C). This ratio was selected from our previous report on ABC triblock terpolymers with a slight increase in the hydrophilic contents, which was to ensure all the pentablock terpolymers could dissolve in aqueous media.36The polymers were synthesised via the conventional one-pot GTP technique. In a typical GTP system, MTSMC or MTS, the initiator, and TBABB, the catalyst, were first dissolved in THF, followed by monomer injections in the designed sequence. Therefore, the architecture (block number and sequence) of the terpolymers can be easily altered by changing the injection sequence of the monomers and the type of initiator. For example, poly(DEGMA-b-BuMA-b-OEGMA300-b-BuMA-b-DEGMA) (CBABC pentablock) was prepared by injecting OEGMA300 first, then BuMA, and DEGMA at last into a bifunctional MTSMC-initiated system which propagates on both sides of the chain, as shown in Scheme 2(a). By changing the injection sequence of DEGMA and BuMA, poly(BuMA-b-DEGMA-b-OEGMA300-b-DEGMA-b-BuMA) (BCACB, Scheme 2(b)) was obtained instead. To prepare the triblock terpolymers, the monomers were injected into a monofunctional MTS-initiated system which only propagates towards single direction of the chain. For the injection sequence of OEGMA300, BuMA, and DEGMA in the monofunctional MTS system, it led to the formation of poly(OEGMA300-b-BuMA-b-DEGMA) (ABC triblock). By altering the injection sequence, the architecture of the triblock terpolymers can also be changed.
 | ||
| Scheme 2 Representative synthesis routes of CBABC and BCACB pentablock terpolymers via one-pot GTP, where A, B, and C blocks consist of OEGMA300, BuMA, and DEGMA, respectively. | ||
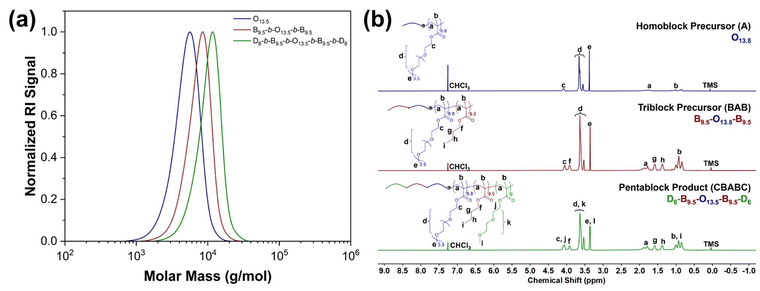
GPC and 1H NMR were employed to investigate the MM and chemical composition of the obtained polymers and the corresponding precursors. From the representative GPC traces of the CBABC polymer (Fig. 1(a)), it is confirmed that the MM of the final product reaches a close agreement with the theoretical target, as listed in Table 1. The distribution of MM is also sufficiently narrow (dispersity index Đ < 1.2, Table 1) for the scope of this study. As the GPC trace moves from the lower MM zone to the higher one during the chain propagation from homopolymer (A) to triblock bipolymer (BAB), and eventually to pentablock terpolymer (CBABC), shoulders or tails can hardly be seen, showing that the monomers and other intermediates are highly converted. Similar features are also found in the GPC traces of other polymers in this study, as shown in Fig. S2.†
| Group | Architecture | Target structurea | MMTarget![[thin space (1/6-em)]](https://www.rsc.org/images/entities/char_2009.gif) b (g mol−1) b (g mol−1) |
M n (g mol−1) | Đ | Composition (O–B–D wt%) | |||||||||||||||||||||||||||||||||||||||||||||||||||||||||||||||||||||||||||||||||||||||||||||
|---|---|---|---|---|---|---|---|---|---|---|---|---|---|---|---|---|---|---|---|---|---|---|---|---|---|---|---|---|---|---|---|---|---|---|---|---|---|---|---|---|---|---|---|---|---|---|---|---|---|---|---|---|---|---|---|---|---|---|---|---|---|---|---|---|---|---|---|---|---|---|---|---|---|---|---|---|---|---|---|---|---|---|---|---|---|---|---|---|---|---|---|---|---|---|---|---|---|---|---|
| Target | 1H NMR | ||||||||||||||||||||||||||||||||||||||||||||||||||||||||||||||||||||||||||||||||||||||||||||||||||
a “O”, “B”, and “D” are the abbreviations for OEGMA300, DEGMA, and BuMA, respectively.
b MMTarget for pentablock terpolymers were calculated by:  , where MMi is molar mass of each monomer, DPi is the degree of polymerisation of each block, and 200 (g mol−1) is the molar mass of the residual group from MTSMC (the bifunctional initiator) after dissociative GTP. MMTarget for triblock terpolymers were calculated in a similar but modified method, in which the mass of the residual group from the initiator was altered to 100 (g mol−1), as another mono-functional initiator, MTS, was employed to prepare these polymers. , where MMi is molar mass of each monomer, DPi is the degree of polymerisation of each block, and 200 (g mol−1) is the molar mass of the residual group from MTSMC (the bifunctional initiator) after dissociative GTP. MMTarget for triblock terpolymers were calculated in a similar but modified method, in which the mass of the residual group from the initiator was altered to 100 (g mol−1), as another mono-functional initiator, MTS, was employed to prepare these polymers.
|
|||||||||||||||||||||||||||||||||||||||||||||||||||||||||||||||||||||||||||||||||||||||||||||||||||
| I | ABCBA | D12 | 2450 | 2900 | 1.25 | 0–0–100 | 0–0–100 | ||||||||||||||||||||||||||||||||||||||||||||||||||||||||||||||||||||||||||||||||||||||||||||
| B9.5-b-D12-b-B9.5 | 5150 | 5700 | 1.21 | 0–55–45 | 0–54–46 | ||||||||||||||||||||||||||||||||||||||||||||||||||||||||||||||||||||||||||||||||||||||||||||||
| O7-b-B9.5-b-D12-b-B9.5-b-O7 | 9200 | 9600 | 1.20 | 45–30–25 | 44–30–26 | ||||||||||||||||||||||||||||||||||||||||||||||||||||||||||||||||||||||||||||||||||||||||||||||
| CBABC | O13.5 | 4250 | 4500 | 1.20 | 100–0–0 | 100–0–0 | |||||||||||||||||||||||||||||||||||||||||||||||||||||||||||||||||||||||||||||||||||||||||||||
| B9.5-b-O13.5-b-B9.5 | 6950 | 6800 | 1.17 | 60–40–0 | 59–41–0 | ||||||||||||||||||||||||||||||||||||||||||||||||||||||||||||||||||||||||||||||||||||||||||||||
| D6-b-B9.5-b-O13.5-b-B9.5-b-D6 | 9200 | 9500 | 1.17 | 45–30–25 | 44–31–25 | ||||||||||||||||||||||||||||||||||||||||||||||||||||||||||||||||||||||||||||||||||||||||||||||
| ABC | O13.5 | 4150 | 4900 | 1.15 | 100–0–0 | 100–0–0 | |||||||||||||||||||||||||||||||||||||||||||||||||||||||||||||||||||||||||||||||||||||||||||||
| O13.5-b-B19 | 6850 | 7100 | 1.14 | 60–40–0 | 58–42–0 | ||||||||||||||||||||||||||||||||||||||||||||||||||||||||||||||||||||||||||||||||||||||||||||||
| O13.5-b-B19-b-D12 | 9100 | 9700 | 1.15 | 45–30–25 | 45–32–23 | ||||||||||||||||||||||||||||||||||||||||||||||||||||||||||||||||||||||||||||||||||||||||||||||
| II | ACBCA | B19 | 2900 | 3200 | 1.21 | 0–100–0 | 0–100–0 | ||||||||||||||||||||||||||||||||||||||||||||||||||||||||||||||||||||||||||||||||||||||||||||
| D6-b-B19-b-D6 | 5150 | 5600 | 1.18 | 0–55–45 | 0–54–46 | ||||||||||||||||||||||||||||||||||||||||||||||||||||||||||||||||||||||||||||||||||||||||||||||
| O7-b-D6-b-B19-b-D6-b-O7 | 9200 | 9100 | 1.19 | 45–30–25 | 43–31–26 | ||||||||||||||||||||||||||||||||||||||||||||||||||||||||||||||||||||||||||||||||||||||||||||||
| BCACB | O13.5 | 4250 | 4600 | 1.20 | 100–0–0 | 100–0–0 | |||||||||||||||||||||||||||||||||||||||||||||||||||||||||||||||||||||||||||||||||||||||||||||
| D6-b-O13.5-b-D6 | 6500 | 6500 | 1.19 | 64–0–36 | 65–0–35 | ||||||||||||||||||||||||||||||||||||||||||||||||||||||||||||||||||||||||||||||||||||||||||||||
| B9.5-b-D6-b-O13.5-b-D6-b-B9.5 | 9200 | 9200 | 1.18 | 45–30–25 | 45–31–24 | ||||||||||||||||||||||||||||||||||||||||||||||||||||||||||||||||||||||||||||||||||||||||||||||
| ACB | O13.5 | 4150 | 4300 | 1.16 | 100–0–0 | 100–0–0 | |||||||||||||||||||||||||||||||||||||||||||||||||||||||||||||||||||||||||||||||||||||||||||||
| O13.5-b-D12 | 6400 | 6300 | 1.13 | 64–0–36 | 66–0–34 | ||||||||||||||||||||||||||||||||||||||||||||||||||||||||||||||||||||||||||||||||||||||||||||||
| O13.5-b-D12-b-B19 | 9100 | 9000 | 1.13 | 45–30–25 | 46–30–24 | ||||||||||||||||||||||||||||||||||||||||||||||||||||||||||||||||||||||||||||||||||||||||||||||
| III | BACAB | D12 | 2450 | 2800 | 1.26 | 0–0–100 | 0–0–100 | ||||||||||||||||||||||||||||||||||||||||||||||||||||||||||||||||||||||||||||||||||||||||||||
| O7-b-D12-b-O7 | 6500 | 6600 | 1.21 | 64–0–36 | 65–0–35 | ||||||||||||||||||||||||||||||||||||||||||||||||||||||||||||||||||||||||||||||||||||||||||||||
| B9.5-b-O7-b-D12-b-O7-b-B9.5 | 9200 | 9400 | 1.19 | 45–30–25 | 45–31–24 | ||||||||||||||||||||||||||||||||||||||||||||||||||||||||||||||||||||||||||||||||||||||||||||||
| CABAC | B19 | 2900 | 3300 | 1.20 | 0–100–0 | 0–100–0 | |||||||||||||||||||||||||||||||||||||||||||||||||||||||||||||||||||||||||||||||||||||||||||||
| O7-b-B19-b-O7 | 6950 | 7300 | 1.18 | 60–40–0 | 59–41–0 | ||||||||||||||||||||||||||||||||||||||||||||||||||||||||||||||||||||||||||||||||||||||||||||||
| D6-b-O7-b-B19-b-O7-b-D6 | 9200 | 9400 | 1.17 | 45–30–25 | 45–31–24 | ||||||||||||||||||||||||||||||||||||||||||||||||||||||||||||||||||||||||||||||||||||||||||||||
| CAB | D12 | 2350 | 2500 | 1.19 | 0–0–100 | 0–0–100 | |||||||||||||||||||||||||||||||||||||||||||||||||||||||||||||||||||||||||||||||||||||||||||||
| D12-b-O13.5 | 6400 | 6400 | 1.17 | 64–0–36 | 66–0–34 | ||||||||||||||||||||||||||||||||||||||||||||||||||||||||||||||||||||||||||||||||||||||||||||||
| D12-b-O13.5-b-B19 | 9100 | 9000 | 1.18 | 45–30–25 | 46–30–24 | ||||||||||||||||||||||||||||||||||||||||||||||||||||||||||||||||||||||||||||||||||||||||||||||
In the 1H NMR spectra of the CBABC polymer and its precursors (Fig. 1(b)), all the peaks can be clearly assigned to the theoretical structure of the polymer. The integral intensity of the peak g, h (4H from BuMA) and peak e, l (3H from OEGMA300 + 3H from DEGMA) were used to determine the composition of the polymer, which also fits closely to the theoretical target (Table 1). Moreover, the two peaks of C![[double bond, length as m-dash]](https://www.rsc.org/images/entities/char_e001.gif) CH2 protons from the unreacted monomers, which should be located at about 5.5 and 6.0 ppm, are absent, showing a sufficiently high conversion of the monomers. Confirmed from GPC and 1H NMR, six pentablock and three triblock terpolymers were successfully prepared and met the requirements for this study. The structural information of all the obtained terpolymers and the corresponding precursors is listed in Table 1.
CH2 protons from the unreacted monomers, which should be located at about 5.5 and 6.0 ppm, are absent, showing a sufficiently high conversion of the monomers. Confirmed from GPC and 1H NMR, six pentablock and three triblock terpolymers were successfully prepared and met the requirements for this study. The structural information of all the obtained terpolymers and the corresponding precursors is listed in Table 1.
3.2 Self-assembly in DI water
Self-assembly is a process that leads to micellisation or formation of other well-defined structures, which naturally occurs to amphiphilic block copolymers in aqueous media.44 To investigate whether this process can take place in the concentration of interest, which is 1 wt% in DI water above 25 °C, the critical micelle concentration (CMC) of the polymers was determined via pyrene fluorometry at 25 °C. It is acknowledged that the ratio of the first to third characteristic peak (I1/I3) in the pyrene emission spectrum varies with the polarity of the surrounding environment of the pyrene molecules.45–48 When the concentration of polymer increases towards the CMC, the value of I1/I3 will decrease due to the enhancing interactions between pyrene and hydrophobic segments of the polymer.46 Therefore, the CMC can be determined from the inflection point in the I1/I3-concentration plot (Fig. S3†). It can be seen that the CMCs of all the polymers are in the range of 0.05–0.15 μM (∼9 × 10⁻⁵ wt%, detailed in Table 2) in DI water, confirming that the micellisation occurs above this concentration.| Group | Architecture | CMCa (μM) | Hydrodynamic diameterb (dh) | Size by TEMc (nm) | T cp (°C) | ||||||||||||||||||||||||||||||||||||||||||||||||||||||||||||||||||||||||||||||||||||||||||||||
|---|---|---|---|---|---|---|---|---|---|---|---|---|---|---|---|---|---|---|---|---|---|---|---|---|---|---|---|---|---|---|---|---|---|---|---|---|---|---|---|---|---|---|---|---|---|---|---|---|---|---|---|---|---|---|---|---|---|---|---|---|---|---|---|---|---|---|---|---|---|---|---|---|---|---|---|---|---|---|---|---|---|---|---|---|---|---|---|---|---|---|---|---|---|---|---|---|---|---|---|
| By theory (nm) | By intensity (±1 nm) | By number (±1 nm) | PDI | ||||||||||||||||||||||||||||||||||||||||||||||||||||||||||||||||||||||||||||||||||||||||||||||||
| a The values of CMC were determined at 25 °C by pyrene fluorometry with an excitation wavelength of 334 nm. b The values of theoretical dh were obtained from the spherical core–shell micelle model shown in Table 3. The experimental values reported are the mean of the peak values in the size distribution from three repeats, while the deviation is for the instrumental error. The PDI is the polydispersity index of the distribution of dh by intensity. c The size by TEM is the average diameter of 200 observed particles. d The values of Tcp were determined by UV-Vis spectroscopy with test wavelength of 550 nm and a heating rate of 0.2 °C min−1. | |||||||||||||||||||||||||||||||||||||||||||||||||||||||||||||||||||||||||||||||||||||||||||||||||||
| I | ABCBA | 0.08 ± 0.01 | 6.1 | 13 | 10 | 0.06 | 12 ± 2 | 48.1 ± 0.1 | |||||||||||||||||||||||||||||||||||||||||||||||||||||||||||||||||||||||||||||||||||||||||||
| CBABC | 0.09 ± 0.01 | 6.2 | 13 | 8 | 0.10 | 15 ± 2 | 40.0 ± 0.1 | ||||||||||||||||||||||||||||||||||||||||||||||||||||||||||||||||||||||||||||||||||||||||||||
| ABC | 0.06 ± 0.01 | 12.9 | 19 | 13 | 0.05 | 14 ± 2 | 51.2 ± 0.1 | ||||||||||||||||||||||||||||||||||||||||||||||||||||||||||||||||||||||||||||||||||||||||||||
| II | ACBCA | 0.11 ± 0.01 | 11.5 | 18 | 12 | 0.07 | 13 ± 3 | 54.0 ± 0.1 | |||||||||||||||||||||||||||||||||||||||||||||||||||||||||||||||||||||||||||||||||||||||||||
| BCACB | 0.06 ± 0.01 | 11.6 | 25 | 13 | 0.15 | 14 ± 2 | 48.0 ± 0.1 | ||||||||||||||||||||||||||||||||||||||||||||||||||||||||||||||||||||||||||||||||||||||||||||
| ACB | 0.10 ± 0.02 | 22.5 | 27 | 17 | 0.06 | 16 ± 3 | 51.5 ± 0.4 | ||||||||||||||||||||||||||||||||||||||||||||||||||||||||||||||||||||||||||||||||||||||||||||
| III | BACAB | 0.09 ± 0.01 | 11.8 | 16 | 10 | 0.10 | 12 ± 2 | 43.3 ± 0.1 | |||||||||||||||||||||||||||||||||||||||||||||||||||||||||||||||||||||||||||||||||||||||||||
| CABAC | 0.07 ± 0.01 | 11.8 | 13 | 10 | 0.03 | 13 ± 2 | 43.3 ± 0.5 | ||||||||||||||||||||||||||||||||||||||||||||||||||||||||||||||||||||||||||||||||||||||||||||
| CAB | 0.10 ± 0.01 | 23.1 | 28 | 17 | 0.11 | 15 ± 4 | 43.5 ± 0.2 | ||||||||||||||||||||||||||||||||||||||||||||||||||||||||||||||||||||||||||||||||||||||||||||
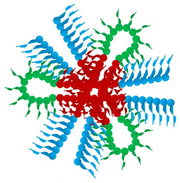
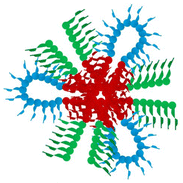
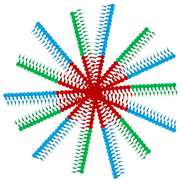
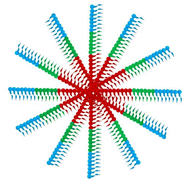
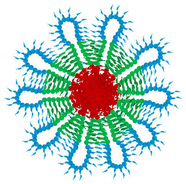
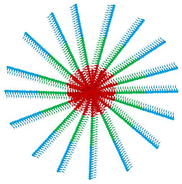
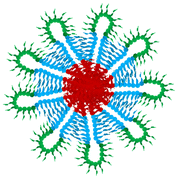
DLS was used to characterise the micellisation of the polymers at 1 wt% in DI water at 25 °C. The obtained hydrodynamic diameters (dhs) of the micelles in the solution are listed in Table 2 alongside the theoretical estimates from the spherical core–shell micelle model. In this model, the hydrophobic poly(BuMA) block forms the micelle core, while the hydrophilic poly(OEGMA300) and poly(DEGMA) blocks compose the hydrated shell of the micelle. For the terpolymers with only one hydrophobic B block, i.e., ABC, ACBCA, ACB, and CAB, they are expected to form classic branch-like micelles (see micelle conformations in Table 3). To obtain the theoretical values of dh, three assumptions were involved: (i) the polymer chains are fully stretched, (ii) the poly(BuMA) blocks in the hydrophobic core are overlapped, and (iii) the side groups do not affect the overall dh of the particles. For the other terpolymers with two hydrophobic B blocks, flower-like micelles are expected. For this type of micelles, the estimation of dh assumes a “hairpin” conformation, in which the polymer chains are straightened despite being folded in the middle of the hydrophilic block. These theoretical estimations should be considered as the upper limit of dh due to the straightened chain conformation involved.
From the experimental results listed in Table 2, the number-averaged dhs are generally closer to the theoretical values, suggesting that a majority of the polymers assemble into the core–shell micelles under the test condition. Although the theoretical dhs should be considered as the upper limit of the micelle size, the intensity-averaged dhs are still mildly higher than the theoretical ones. This can be attributed to a low extent of the incomplete overlapping of the core or the contribution from the long OEGMA300 side group (approx. 4 nm in total), as observed previously.36,49 The size homogeneities of the polymeric micelles are also characterised well by the low polydispersity index (PDI) of dh ranging around 0.1, as shown in Table 2. In the specific case of BCACB, the intensity-averaged dh deviates more considerably from the theoretical values and the PDI is at a slightly higher value of 0.15. As the intensity-based results from DLS are highly sensible to larger species, this phenomenon may indicate the existence of a minor fraction of micellar clusters or larger micelles with dangling ends.50,51 The overall intensity-based and number-based dh distributions of the investigated polymers are demonstrated in Fig. S4 and S5,† respectively.
The morphology of the assembled micelles was investigated via transmission electron microscopy (TEM). From the obtained micrographs (Fig. S6†), it can be seen that most of the assembled micelles are spherical particles with an average diameter aligning well to the respective number-averaged dh from DLS. The slight difference between the diameters obtained from TEM and the ones from DLS is probably due to the deformation and drying effect during the sample preparation.52
3.3 Thermo-induced phase transition in DI water
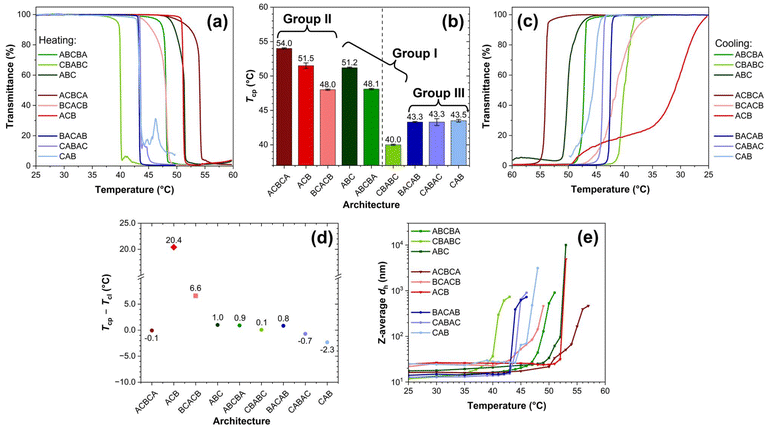
The properties of thermo-induced phase transition of the polymers at 1 wt% in DI water were investigated via multiple techniques, including UV-Vis, DLS, and VT-1H NMR. For the latter two techniques, the characterisations started from 25 °C until significant precipitation was noticed, typically 1–3 °C above the respective cloud point temperature (Tcp, vide infra).Generally, a higher Tcp can be observed if the architecture of the polymer facilitates the formation of micelles with the outermost layer predominantly consisting of the poly(OEGMA300) block, which includes ABCBA, ABC, ACBCA, BCACB, and ACB (see Table 3 for micelle conformations). Due to the higher hydrophilicity and LCST of poly(OEGMA300), the poly(OEGMA300)-based outermost layer may provide enhanced hydrogen bonding and stabilisation effect to the micelles upon heating, leading to a higher Tcp.53,54 For example, in Group I, the ABC-triblock demonstrates a high Tcp at 51.2 °C. When it is altered into the ABCBA-pentablock, the outermost layer is still dominated by the less-constrained poly(OEGMA300) block, as shown in the micelle conformation in Table 3. Therefore, ABCBA remains stable at high temperatures, showing a Tcp of 48.1 °C. Conversely, when the architecture is modified into a CBABC-pentablock, the poly(OEGMA300) block becomes folded and restricted, while more of the poly(DEGMA) block, which possesses a lower hydrophilicity and LCST,55 is exposed in the outermost layer. Therefore, the outermost layer of the micelle may collapse at a lower temperature, leading to a significant decline in the Tcp to 40.0 °C. In Group II, all the members exhibit a high Tcp between 48–54 °C as the micelles formed by these three terpolymers should all have a poly(OEGMA300)-rich outermost layer. However, in Group III, the variation in the polymer architecture does not yield any micelles with a poly(OEGMA300)-rich outermost layer, resulting in uniformly low Tcps around 43 °C.
To evaluate the reversibility of the phase transition, the transmittance-temperature relationship of the solutions during cooling (referred to as the “cooling curve”) were also recorded, as presented in Fig. 2(c). The clear point temperature (Tcl), defined as the temperature at which the transmittance of the solution increases from 0% to 50%, was determined. The difference between this temperature and the corresponding Tcp (Tcp − Tcl, °C) is shown in Fig. 2(d). For ABCBA, CBABC, ABC, ACBCA, BACAB, CABAC, and CAB, this difference remains within approximately ±2 °C, with their cooling curves displaying a similar “S” shape to the corresponding heating curves. In contrast to poly(N-isopropylacrylamide) (PNIPAM)-based polymers, OEGMA-based polymers generally exhibit minimal hysteresis, (i.e., a positive value of Tcp − Tcl), between the phase transition and its recovery. This behaviour can be attributed to the absence of intra- and inter-molecular hydrogen bonding.54
However, two distinct terpolymers, BCACB and ACB, exhibit great hysteresis of 6.6 and 20.4 °C, respectively. For BCACB, this is likely due to the formation of intermicellar bridging chains during the thermo-induced aggregation. During cooling, the residual bridging chains may hinder the re-dissolution and restoration of isolated micelles, resulting in the great hysteresis. In the case of ACB, the unique plateau-like feature observed in its cooling curve suggests that the hysteresis may arise from the formation of more complex structures under the applied slow cooling conditions.
Interestingly, BACAB, another terpolymer expected to form intermicellar bridging chains, does not display noticeable hysteresis comparable to BCACB. We assume this is likely due to the lower Tcp of poly(DEGMA) at 27–30 °C (MM-dependent).55 Therefore, the bridging chains may collapse from the middle at a lower temperature, which could favour the looping over bridging conformation.
Similar transition features below and above the respective Tcp can also be found in other terpolymers, as Fig. S7† shows. This feature indicates that these terpolymers are able to assemble into similar core–shell micelles, which subsequently follow a comparable aggregating pattern upon heating. Among all the terpolymers studied, only the aggregation of the CAB terpolymer exhibits a considerable hysteresis from the Tcp determined by UV-Vis. This is probably related to the instrumental error caused by the severe precipitation during its phase transition.
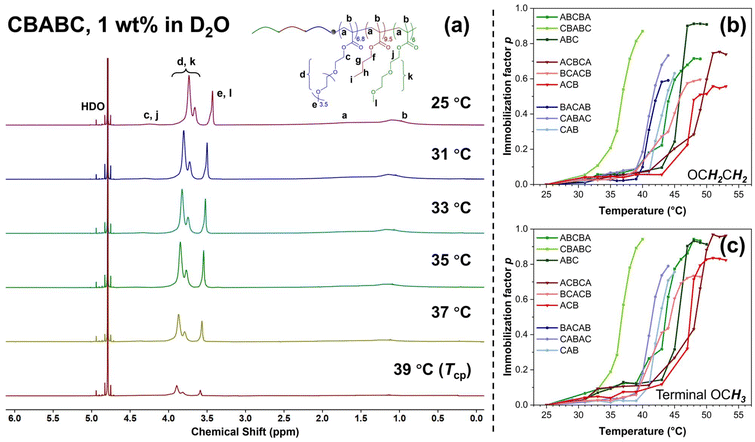
The 1H NMR spectra of CBABC polymer solution from 25 °C to 39 °C (the Tcp in D2O) are shown in Fig. 3(a) as an example, while those of the other eight terpolymers are presented in Fig. S9.† At 25 °C, compared to the spectra acquired in CDCl3 solution (bottom, Fig. 1(b)), the characteristic peaks of the poly(BuMA) block, i.e., peak f, g, and h from Fig. 1(b), are absent in the spectrum obtained in D2O solution. This feature is within the expectation as the poly(BuMA) block should be highly immobilised when acting as the micelle core.62 The peaks corresponding to the backbone protons (peak a, b) and the COOCH2 protons connecting to the backbone (peak c, j) are also attenuated and broadened, showing a more solid-like feature due to their less-hydrophilic nature.60 On the contrary, the peaks of the OCH2CH2 protons in the hydrophilic ethylene glycol (EG) structure (peak d, k) and the terminal OCH3 (peak e, l) from the side chain of the poly(OEGMA300) and poly(DEGMA) blocks remain well observed, showing a high mobility as these structures should serve as the solvated shell of the micelles. When the sample is heated to 37 °C and further to the Tcp at 39 °C, all the peaks are attenuated, indicating a higher level of chain immobilisation when the polymer chains are embedded in the aggregates. In this set of spectra, the peak of HDO (4.79 ppm) is selected as an internal reference of peak position. As the temperature increases, the positions of all the polymer peaks slightly move towards lower field (higher ppm), as a result of descending H-bonding between the polymers and solvent molecules.60,62–64 The features discussed above are consistent with the other eight terpolymers (Fig. S9†).
In order to investigate the phase transition on a more quantitative level, the immobilisation factor, p, was employed:
 | (2) |
Here, I(T) is the integral intensity of the peak of interest at the given temperature T, while I(T0) is the integral intensity of the peak at the reference temperature T0, where the maximum mobility is observed.57,58,65 The coefficient,  , is for calibration as the signal should attenuate intrinsically with the increase in temperature.66 In this case, T0 was set to 25 °C.
Two types of protons, OCH2CH2 (EG groups) and the terminal OCH3 in the side chains of the poly(OEGMA300) and poly(DEGMA) blocks, were selected to quantitatively investigate the immobilisation of the polymer chain. The temperature dependences of the p-value of the OCH2CH2 and the terminal OCH3 group are shown in Fig. 3(b) and (c), respectively. Consistent with the results from UV-Vis and DLS, the polymers also present a similar behaviour to each other. Taking the CBABC pentablock terpolymer as an example, the p-value remains close to zero from 25 to 33 °C. At 35 °C which is still below the Tcp of 39 °C, the p-values of both types of protons start to increase from a noticeable level of about 0.2, showing that the chain immobilisation may also commence mildly prior to the macroscopic phase transition. At the Tcp, the p-value escalates to a high magnitude of 0.9, indicating that the micellar shell, composed of poly(OEGMA300) and poly(DEGMA) blocks, is highly restricted and immobilised in the aggregates formed after the phase transition.
3.4 Thermo-induced gelation in PBS
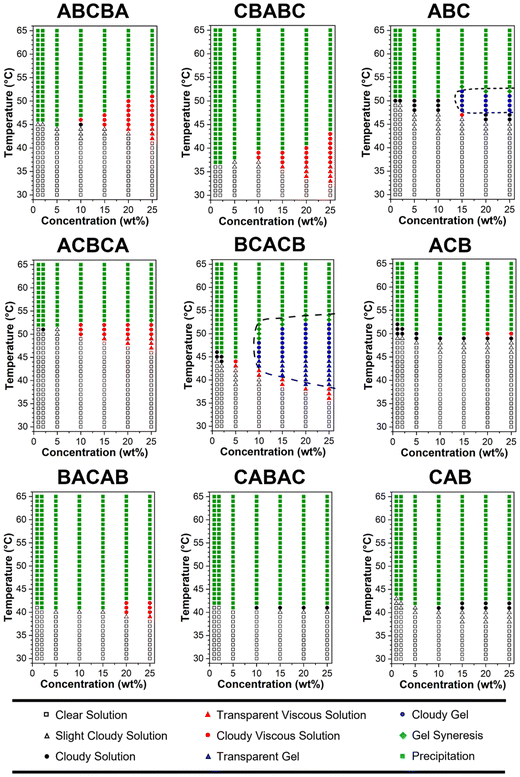 | ||
| Fig. 4 Phase diagrams of the polymer in PBS (pH = 7.4, 1×) at 1, 2, 5, 10, 15, 20, and 25 wt%. The heating rate was approximately 1 °C min−1. | ||
The obtained phase diagram in Fig. 4 reveals that BCACB is the only gellable pentablock terpolymer in PBS, apart from the ABC triblock terpolymer that has been previously reported as a promising gelling agent.31,36 The critical temperatures determined by visual tests, including the temperature of gelation (Tgel), the temperature of syneresis (Tsyn), and the temperature of precipitation (Tpre) of the two gellable polymers, are listed in Table 4. Compared with ABC, BCACB demonstrates an enhanced gelling ability, characterised by a broader concentration and temperature range. For example, the lowest gelation concentration of the BCACB is 10 wt%, in contrast to 15 wt% for the original ABC. At 25 wt% in PBS, the ABC solution is able to form hydrogel from 48 to 53 °C, whereas the BCACB solution transits into hydrogel from a considerably lower temperature of 39 °C to 55 °C. This significant enhancement can be attributed to the stable bridging chains formed among the flower-like micelles of BCACB (see micelle conformation in Table 3), which can effectively strengthen the intermicellar associations.68–70
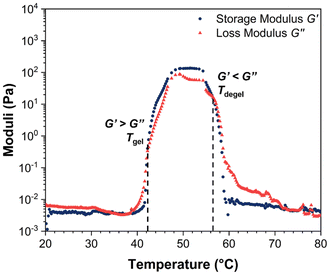
 along with the corresponding temperature
  measured by rheometry, and the temperatures at which gel destabilisation occurs through syneresis (Tsyn) and precipitation (Tpre) as observed by visual tests, and degelation (Tdegel) as determined by rheometry
| Architecture | Conc. in PBS (wt%) | Critical properties in gelation | |||||||||||||||||||||||||||||||||||||||||||||||||||||||||||||||||||||||||||||||||||||||||||||||||
|---|---|---|---|---|---|---|---|---|---|---|---|---|---|---|---|---|---|---|---|---|---|---|---|---|---|---|---|---|---|---|---|---|---|---|---|---|---|---|---|---|---|---|---|---|---|---|---|---|---|---|---|---|---|---|---|---|---|---|---|---|---|---|---|---|---|---|---|---|---|---|---|---|---|---|---|---|---|---|---|---|---|---|---|---|---|---|---|---|---|---|---|---|---|---|---|---|---|---|---|
| Visual (±2 °C) | Rheologicala | ||||||||||||||||||||||||||||||||||||||||||||||||||||||||||||||||||||||||||||||||||||||||||||||||||
| T gel | T syn | T pre | T gel (°C) | (×100 Pa) | (°C) | T degel (°C) | |||||||||||||||||||||||||||||||||||||||||||||||||||||||||||||||||||||||||||||||||||||||||||||
| a The rheological tests were carried out under an angular frequency of 1.0 rad s−1, a strain of 1.0%, and a heating rate of 1.0 °C min−1. b The ABC triblock terpolymer does not form hydrogel at 10 wt% in PBS. | |||||||||||||||||||||||||||||||||||||||||||||||||||||||||||||||||||||||||||||||||||||||||||||||||||
| ABC | 10b | — | — | — | — | — | — | — | |||||||||||||||||||||||||||||||||||||||||||||||||||||||||||||||||||||||||||||||||||||||||||
| 15 | 48 | — | 54 | 48.3 ± 0.3 | 1.5 ± 0.4 | 51.5 ± 0.4 | 53.8 ± 0.1 | ||||||||||||||||||||||||||||||||||||||||||||||||||||||||||||||||||||||||||||||||||||||||||||
| 20 | 48 | 52 | 53 | 48.0 ± 0.2 | 2.7 ± 0.8 | 51.3 ± 0.1 | 53.1 ± 0.3 | ||||||||||||||||||||||||||||||||||||||||||||||||||||||||||||||||||||||||||||||||||||||||||||
| 25 | 48 | 52 | 53 | 47.4 ± 0.4 | 3.9 ± 0.9 | 51.2 ± 0.5 | 53.0 ± 0.4 | ||||||||||||||||||||||||||||||||||||||||||||||||||||||||||||||||||||||||||||||||||||||||||||
| BCACB | 10 | 43 | 49 | 53 | 42.7 ± 0.3 | 1.3 ± 0.1 | 49.8 ± 1.3 | 54.3 ± 1.7 | |||||||||||||||||||||||||||||||||||||||||||||||||||||||||||||||||||||||||||||||||||||||||||
| 15 | 41 | 52 | 54 | 41.5 ± 0.5 | 2.2 ± 0.1 | 48.8 ± 1.0 | 54.0 ± 1.3 | ||||||||||||||||||||||||||||||||||||||||||||||||||||||||||||||||||||||||||||||||||||||||||||
| 20 | 39 | 53 | 55 | 40.3 ± 0.7 | 4.5 ± 1.0 | 48.6 ± 0.7 | 55.0 ± 0.8 | ||||||||||||||||||||||||||||||||||||||||||||||||||||||||||||||||||||||||||||||||||||||||||||
| 25 | 39 | 53 | 55 | 39.0 ± 0.7 | 4.8 ± 1.1 | 47.8 ± 1.2 | 54.6 ± 1.3 | ||||||||||||||||||||||||||||||||||||||||||||||||||||||||||||||||||||||||||||||||||||||||||||
Interestingly, BACAB is also expected to gel upon heating due to its potential to form flower-like micelles and intermicellar bridging chains. However, it was found to be non-gellable, suggesting that the stability of the bridging chains of BACAB micelles, composed of the poly(OEGMA300-b-DEGMA-b-OEGMA300) moiety, is insufficient to configure a hydrogel network. This feature can also be attributed to the lower Tcp of poly(DEGMA) block (vide supra),55 which may lead to the collapse of bridging chains from the middle at a lower temperature, favouring the looping over bridging conformation and ultimately leading to the inability of gelation. For other non-gellable pentablock terpolymers, the change in architecture may also affect the packing and rearrangement of the corresponding micelles upon heating, thereby resulting in the precipitation, instead of gelation.28
The rheological Tgel and Tdegel, alongside the maximum G′ in the gelation range  and the corresponding temperature
  , are summarised in Table 4. As can be seen, both Tgel and Tdegel align well with the counterparts from the visual test, which confirms that BCACB indeed presents a broader gelation range than ABC. It is also noticed that Tgel and
  gradually decrease, while
  increases as the polymer concentration becomes higher, which meets the expectation as the interconnected hydrogel network should be configured in a more effective way with more polymer chains involved at higher concentrations.36 Additionally, BCACB also shows a higher
  than that of ABC at all the gelling concentrations. For example, the average
  of BCACB is approximately 450 Pa at 20 wt% in PBS, while that of the ABC triblock is 270 Pa. Such an improvement in the rheological properties of the hydrogel may also be attributed to the formation of the stable bridging chains that can facilitate the intermicellar interactions. These features are consistent with the previous reports that the addition of extra blocks with a proper chemical composition and at an appropriate position would promote the thermo-induced gelation of amphiphilic block copolymers.28,37–39
4 Conclusions
This study is the first to investigate the effect of architecture (block number and sequence) on the thermo-induced phase transition of symmetric pentablock terpolymers, providing a direct comparison with both each other and their triblock counterparts. Here, six pentablock terpolymers and three triblock terpolymers, all based on OEGMA300 (block A), BuMA (block B), and DEGMA (block C) with varied architectures but consistent composition and MM, were successfully prepared via the one-pot GTP technique. In 1 wt% DI water solution, terpolymers that form micelles with the poly(OEGMA300) block dominating the outermost layer, including ABCBA, ACBCA, BCACB, ABC, and ACB, exhibit higher Tcps. Despite the difference in Tcp, all the terpolymers demonstrate a similar phase transition behaviour. Below the respective Tcp, the solution remains transparent, containing small micelles (diameter in 10–30 nm) with a high chain mobility, while heating above the Tcp leads to a sharp phase transition, accompanied by the formation of large micellar aggregates and significant chain immobilization.Regarding the thermogelling properties, the well-documented ABC-triblock terpolymer gels as expected, along with the BCACB pentablock terpolymer that can form flower-like micelles. Notably, BCACB outperforms the triblock counterpart, characterised by a significant broader gelation range in terms of both temperature and concentration. Furthermore,  of BCACB consistently exceeds that of ABC at all gellable concentrations. These enhancements are potentially attributed to the stable intermicellar bridging chain formed among the flower-like micelles of the BCACB terpolymer. The findings from this research may offer new insights into the designing strategies of thermogels, potentially benefiting the development of next-generation diagnostics and therapeutics techniques.
Author contributions
Shaobai W. performed a major part of the synthesis and characterisation of the polymers and wrote the first draft of the manuscript. X.L. and Shuchen W. assisted in the synthesis and contributed equally. T.K.G is the supervisor, administrator, and organiser of the project.Data availability
The data supporting this article have been included as part of the ESI.†Conflicts of interest
There are no conflicts to declare.Acknowledgements
There are no acknowledgements that the authors wish to disclose.References
- R. Liu, M. Fraylich and B. R. Saunders, Colloid Polym. Sci., 2009, 287, 627–643 CrossRef CAS.
- F. Doberenz, K. Zeng, C. Willems, K. Zhang and T. Groth, J. Mater. Chem. B, 2020, 8, 607–628 RSC.
- C. Zhao, Z. Ma and X. X. Zhu, Prog. Polym. Sci., 2019, 90, 269–291 CrossRef CAS.
- Q. Zhang, C. Weber, U. S. Schubert and R. Hoogenboom, Mater. Horiz., 2017, 4, 109–116 RSC.
- M. R. Matanović, J. Kristl and P. A. Grabnar, Int. J. Pharm., 2014, 472, 262–275 CrossRef PubMed.
- A. P. Constantinou and T. K. Georgiou, Polym. Int., 2021, 70, 1433–1448 CrossRef CAS.
- R. Ou, J. Wei, L. Jiang, G. P. Simon and H. Wang, Environ. Sci. Technol., 2016, 50, 906–914 CrossRef CAS PubMed.
- K. Nagase and T. Okano, J. Mater. Chem. B, 2016, 4, 6381–6397 RSC.
- H. Musarurwa and N. T. Tavengwa, Microchem. J., 2022, 179, 107554 CrossRef CAS.
- H. Zhang, P. Xue, J. Liu and X. Xu, ACS Appl. Energy Mater., 2021, 4, 6116–6124 CrossRef CAS.
- Z. Wei, L. Yu, S. Lu and Y. Zhao, Energy Storage Mater., 2023, 61, 102901 CrossRef.
- M. Li and Z. Chen, J. Polym. Sci., 2021, 59, 2230–2245 CrossRef CAS.
- H. A. Zayas, A. Lu, D. Valade, F. Amir, Z. Jia, R. K. O'Reilly and M. J. Monteiro, ACS Macro Lett., 2013, 2, 327–331 CrossRef CAS PubMed.
- Y. Lu and M. Ballauff, Prog. Polym. Sci., 2011, 36, 767–792 CrossRef CAS.
- L. Klouda and A. G. Mikos, Eur. J. Pharm. Biopharm., 2008, 68, 34–45 CrossRef CAS PubMed.
- Y. Yuan, K. Raheja, N. B. Milbrandt, S. Beilharz, S. Tene, S. Oshabaheebwa, U. A. Gurkan, A. C. S. Samia and M. Karayilan, RSC Appl. Polym., 2023, 1, 158–189 RSC.
- A. P. Constantinou, L. Wang, S. Wang and T. K. Georgiou, Polym. Chem., 2022, 14, 223–247 RSC.
- L. Li, H. Shan, C. Y. Yue, Y. C. Lam, K. C. Tam and X. Hu, Langmuir, 2002, 18, 7291–7298 CrossRef CAS.
- A. Kyritsis A. Laschewsky and C. M. Papadakis, in Thermodynamics and Biophysics of Biomedical Nanosystems, ed. N. P. Costas Demetzos, Springer Singapore, 2019, pp. 397–444 Search PubMed.
- A. Lerch, F. Käfer, S. Prévost, S. Agarwal and M. Karg, Macromolecules, 2021, 54, 7632–7641 CrossRef CAS.
- H. G. Schild, Prog. Polym. Sci., 1992, 17, 163–249 CrossRef CAS.
- C. Pietsch, U. Mansfeld, C. Guerrero-Sanchez, S. Hoeppener, A. Vollrath, M. Wagner, R. Hoogenboom, S. Saubern, S. H. Thang, C. R. Becer, J. Chiefari and U. S. Schubert, Macromolecules, 2012, 45, 9292–9302 CrossRef CAS.
- S. Chatterjee and P. C. L. Hui, Polymers, 2021, 13, 2086 CrossRef CAS PubMed.
- X. Xu, Y. Liu, W. Fu, M. Yao, Z. Ding, J. Xuan, D. Li, S. Wang, Y. Xia and M. Cao, Polymers, 2020, 12, 1–22 Search PubMed.
- R. Suntornnond, J. An and C. K. Chua, Macromol. Mater. Eng., 2017, 302, 1–15 CrossRef.
- Q. Chai, Y. Jiao and X. Yu, Gels, 2017, 3, 6 CrossRef PubMed.
- K. Zhang, K. Xue and X. J. Loh, Gels, 2021, 7, 1–17 Search PubMed.
- A. P. Constantinou, K. Zhang, B. Somuncuoğlu, B. Feng and T. K. Georgiou, Macromolecules, 2021, 54, 6511–6524 CrossRef CAS.
- P. J. Rose Jaquilin, O. S. Oluwafemi, S. Thomas and A. O. Oyedeji, J. Drug Delivery Sci. Technol., 2022, 72, 103390 CrossRef.
- M. S. H. Akash and K. Rehman, J. Controlled Release, 2015, 209, 120–138 CrossRef CAS PubMed.
- A. P. Constantinou, V. Nele, J. J. Doutch, J. S. Correia, R. V. Moiseev, M. Cihova, D. C. A. Gaboriau, J. Krell, V. V. Khutoryanskiy, M. M. Stevens and T. K. Georgiou, Macromolecules, 2022, 55, 1783–1799 CrossRef CAS PubMed.
- S. Tanga, M. Aucamp and P. Ramburrun, Gels, 2023, 9, 1–19 CrossRef PubMed.
- S. Strandman and X. X. Zhu, Prog. Polym. Sci., 2015, 42, 154–176 CrossRef CAS.
- Y. Kotsuchibashi, M. Ebara, T. Aoyagi and R. Narain, Polymers, 2016, 8, 380 CrossRef PubMed.
- M. Khimani, H. Patel, V. Patel, P. Parekh and R. L. Vekariya, Polym. Bull., 2020, 77, 5783–5810 CrossRef CAS.
- A. P. Constantinou, B. Zhan and T. K. Georgiou, Macromolecules, 2021, 54, 1943–1960 CrossRef CAS.
- H. Mao, G. Shan, Y. Bao, Z. L. Wu and P. Pan, Soft Matter, 2016, 12, 4628–4637 RSC.
- H. S. Abandansari, E. Aghaghafari, M. R. Nabid and H. Niknejad, Polymer, 2013, 54, 1329–1340 CrossRef CAS.
- A. P. Constantinou, N. F. Sam-Soon, D. R. Carroll and T. K. Georgiou, Macromolecules, 2018, 51, 7019–7031 CrossRef CAS.
- Y. Chen and Y. Ding, Acta Chim. Sin., 2020, 78, 733–745 CrossRef CAS.
- O. W. Webster, in Advances in Polymer Science, 2004, vol. 167, pp. 1–34 Search PubMed.
- I. B. Dicker, G. M. Cohen, W. B. Farnham, W. R. Hertler, E. D. Laganis and D. Y. Sogah, Macromolecules, 1990, 23, 4034–4041 CrossRef CAS.
- K. Steinbrecht and F. Bandermann, Macromol. Chem., 1989, 190, 2183–2191 CrossRef CAS.
- S. Hocine and M. H. Li, Soft Matter, 2013, 9, 5839–5861 RSC.
- H. Li, D. Hu, F. Liang, X. Huang and Q. Zhu, R. Soc. Open Sci., 2020, 7, 192092 CrossRef CAS PubMed.
- J. Aguiar, P. Carpena, J. A. Molina-Bolívar and C. Carnero Ruiz, J. Colloid Interface Sci., 2003, 258, 116–122 CrossRef CAS.
- D. R. Perinelli, M. Cespi, N. Lorusso, G. F. Palmieri, G. Bonacucina and P. Blasi, Langmuir, 2020, 36, 5745–5753 CrossRef CAS PubMed.
- L. Cai, M. Gochin and K. Liu, Chem. Commun., 2011, 47, 5527–5529 RSC.
- A. P. Constantinou, G. Patias, B. Somuncuoğlu, T. Brock, D. W. Lester, D. M. Haddleton and T. K. Georgiou, Polym. Chem., 2021, 12, 3522–3532 RSC.
- F. A. Jung, P. A. Panteli, C. H. Ko, J. J. Kang, L. C. Barnsley, C. Tsitsilianis, C. S. Patrickios and C. M. Papadakis, Macromolecules, 2019, 52, 9746–9758 CrossRef CAS.
- A. Wishard and B. C. Gibb, Supramol. Chem., 2019, 31, 608–615 CrossRef CAS PubMed.
- V. Tkachenko, L. Vidal, L. Josien, M. Schmutz, J. Poly and A. Chemtob, Polymers, 2020, 12, 1656 CrossRef CAS PubMed.
- J. E. Laaser, E. Lohmann, Y. Jiang, T. M. Reineke and T. P. Lodge, Macromolecules, 2016, 49, 6644–6654 CrossRef CAS.
- D. Roy, W. L. A. Brooks and B. S. Sumerlin, Chem. Soc. Rev., 2013, 42, 7214–7243 RSC.
- Q. Li, A. P. Constantinou and T. K. Georgiou, J. Polym. Sci., 2021, 59, 230–239 CrossRef CAS.
- J. Weiss and A. Laschewsky, Langmuir, 2011, 27, 4465–4473 CrossRef CAS PubMed.
- J. D. Linn, L. Liberman, C. A. P. Neal and M. A. Calabrese, Polym. Chem., 2022, 13, 3840–3855 RSC.
- J. R. Park, M. Sarwat, E. C. L. Bolle, M. A. De Laat, J. F. R. Van Guyse, A. Podevyn, R. Hoogenboom and T. R. Dargaville, Polym. Chem., 2020, 11, 5191–5199 RSC.
- S. Scheiner and M. Čuma, J. Am. Chem. Soc., 1996, 118, 1511–1521 CrossRef CAS.
- Y. Zhu, R. Batchelor, A. B. Lowe and P. J. Roth, Macromolecules, 2016, 49, 672–680 CrossRef CAS.
- L. Hou and P. Wu, Soft Matter, 2015, 11, 7059–7065 RSC.
- M. Vamvakaki, N. C. Billingham and S. P. Armes, Macromolecules, 1999, 32, 2088–2090 CrossRef CAS.
- H. Fu, H. Gao, G. Wu, Y. Wang, Y. Fan and J. Maa, Soft Matter, 2011, 7, 3546–3552 RSC.
- P. J. Roth, T. P. Davis and A. B. Lowe, Macromolecules, 2012, 45, 3221–3230 CrossRef CAS.
- L. Loukotová, A. Bogomolova, R. Konefal, M. Špírková, P. Štěpánek and M. Hrubý, Carbohydr. Polym., 2019, 210, 26–37 CrossRef PubMed.
- J. Spěváček, Curr. Opin. Colloid Interface Sci., 2009, 14, 184–191 CrossRef.
- H. J. M. Van Dijk, P. Walstra and J. Schenk, Chem. Eng. J., 1984, 28, 43–50 CrossRef.
- A. P. Constantinou and T. K. Georgiou, Eur. Polym. J., 2016, 78, 366–375 CrossRef CAS.
- C. Zhou, G. E. S. Toombes, M. J. Wasbrough, M. A. Hillmyer and T. P. Lodge, Macromolecules, 2015, 48, 5934–5943 CrossRef CAS.
- B. Hu, W. Fu and B. Zhao, Macromolecules, 2016, 49, 5502–5513 CrossRef CAS.
Footnotes |
| † Electronic supplementary information (ESI) available. See DOI: https://doi.org/10.1039/d4py01033g |
| ‡ These two authors contributed equally to this work. |
| This journal is © The Royal Society of Chemistry 2024 |

