Competition mechanism of self-trapped excitons and Te4+ ions emission in the Te4+ doped vacancy-ordered double perovskite Rb2HfCl6 and its excellent properties†
Ruxin
Liu
a,
Kaishun
Zou
b,
Guanglu
Zhang
a,
Min
Feng
c,
Mingxuan
Li
a and
Juncheng
Liu
 *a
*a
aSchool of Materials Science and Engineering, Tiangong University, Tianjin, 300387, China. E-mail: jchliu@tiangong.edu.cn
bSchool of Physical Science and Technology, Tiangong University, Tianjin, 300387, China
cSchool of Physics, Nankai University, Tianjin, 300071, China
First published on 25th March 2024
Abstract
Vacancy-ordered double perovskites (VODPs) have attracted much attention because of their excellent photoelectric properties. However, the competition mechanism of self-trapped exciton emission and Te4+ ion emission in Te4+-doped VODPs is still unclear. Herein, we synthesized Rb2HfCl6 microparticles with a blue self-trapped excitons (STEs) emission, which have a near-unity photoluminescence quantum yield (PLQY), the highest reported value (98.56%) for a VODP matrix. In addition, it has a new broadband yellow emission peak at 560 nm with a PLQY of 76.72% via the equivalent doping of Te4+ ions. The combination of the blue luminescence of pristine Rb2HfCl6 with the yellow luminescence from the Te4+ ion emission could be used in fluorescence anti-counterfeiting. We also prepared a white light-emitting diode (WLED) with the Commission Internationale de l'Eclairage (CIE) coordinates at (0.3502, 0.3527), a correlated color temperature (CCT) of 4814 K and a color-rendering index (CRI) of 75.3. Moreover, optimized Rb2HfCl6:Te4+ exhibited excellent air and thermal stability. The luminescence dynamics and theoretical calculations jointly reveal that this efficient emission originates from the electron transitions in the different paths. This work provides a new perspective and new theoretical support for the future research on ion-doped luminescent systems.
1. Introduction
Vacancy-ordered double perovskites (VODPs) have become very promising candidates to substitute lead-based perovskites due to their high photoluminescence quantum yield (PLQY), environmental friendliness, and excellent stability.1–7 VODPs evolved from the replacement of two B2+ cations in ABX3 halide perovskites with one M4+ cation and one vacancy.1,6 The chemical formula of VODPs can be expressed as A2MX6 (where A = Cs+ or Rb+; M = Sn4+, Hf4+ or Zr4+; and X = Cl−, Br− or I−).2,8–16 The luminescent materials based on VODPs exhibited self-luminescence and tunable luminescent colors, and have been used in making white light-emitting diodes (WLEDs) and fluorescent anti-counterfeiting fields.2,9,17,18 However, the reported PLQY of VODP luminescent materials still needs to be improved well for the practical applications.10,17 Therefore, it is of great significance to develop VODP luminescent materials with high PLQY.The introduction of effective doping ions often results in new light-emitting centers in inorganic luminescent materials. Te4+-doped VODPs exhibited a broadband emission, high PLQY, and a large Stokes shift and full width at half maximum (FWHM).8,10,17,19–21 These properties are all important indicators for WLED or X ray inspection.8,10,17 However, the luminescence source or mechanism of Te4+-doped VODPs has not yet been determined and is currently under debate.22 There are mainly two different perspectives. The first is that the self-trapped excitons (STEs) emission caused by Jahn–Teller lattice distortion after Te4+ ions doping.10,17,19,23 The second is the electron's transition from the ground state 1S0 to the excited state (1P1 or 3Pn, n = 1, 2, 3) of the Te4+ ions.21 Moreover, it is currently also reported that Sn-based and Zr-based VODP-doped Te4+ ions exhibit similar optical properties.10,17,20 It is difficult to distinguish the STEs emission and the electron transitions of Te4+ ions from the perspective of luminescence dynamics. STEs emission is generated by rapidly induced lattice distortion, which is closely related to the electronic structure of the crystal.19,22 The entry of Te4+ ions into the lattice as a dopant is bound to have additional effects on the energy band of the matrix crystal. Presently, no reports have been retrieved to systematically investigate the luminescence mechanism of Te4+-doped VODPs. It is urgent to deeply identify the mechanism of luminescence from the perspective of the crystal electronic structure.
Herein, we designed and synthesized a novel Te4+-doped Rb2HfCl6 VODP. The luminescence properties of the doped systems were further regulated with the atomic ratio. The steady state and transient spectra are used to distinguish STEs emission or Te4+ ions emission. Moreover, theoretical calculations are used to analyze the electronic structure evolution of doped systems. The charge and energy band distribution of Te4+-doped VODPs (A = Cs, Rb; M = Sn, Zr, Hf) were investigated to reveal the STEs emission and Te4+ ion emission competition mechanism of Te4+-doped VODPs.
2. Experimental section
2.1 Chemicals and materials
The starting materials, rubidium chloride (RbCl, 99.5%), hafnium chloride (HfCl4, 99.5%) and tellurium chloride (TeCl4, 99.9%), were purchased from Aladdin Limited (Shanghai, China). Hydrochloric acid (HCl, mass fraction 37%) and absolute ethanol were purchased from Tianjin Fengchuan Chemical Reagent Technology Co., Ltd.2.2 Fabrication of the WLED devices
WLED was composed of a GaN chip (λex = 460 nm) and Rb2HfCl6:3%Te4+ powder. The curing glue and Rb2HfCl6:3%Te4+ powder were well mixed and evenly coated on the GaN chip, and dried at 60 °C for 10 h to obtain the WLED.2.3 Preparation of anti-counterfeiting patterns
First, we mixed Rb2HfCl6:0.5%Te4+ powder with epoxy resin well at a mass ratio of 1![[thin space (1/6-em)]](https://www.rsc.org/images/entities/char_2009.gif) :
:![[thin space (1/6-em)]](https://www.rsc.org/images/entities/char_2009.gif) 5. Then, the mixture was spread evenly on the screen plate, of which its bottom was placed on a white paper. The mixture was slowly scraped with a wooden board so that it was completely dispersed on the white paper, thus, a fluorescent security pattern was ready.
5. Then, the mixture was spread evenly on the screen plate, of which its bottom was placed on a white paper. The mixture was slowly scraped with a wooden board so that it was completely dispersed on the white paper, thus, a fluorescent security pattern was ready.
2.4 Characterization
Scanning electron microscopy (SEM) images were taken with a GeminiSEM 500. Powder X-ray diffraction (XRD) data of the host and doped samples were obtained with a Bruker D8 Advance X-ray diffractometer equipped with a Cu Kα X-ray (λ = 1.5418 Å) tube. X-ray photoelectron spectra (XPS) were recorded with a NEXSA X-ray photoelectron spectrometer manufactured by Thermo Fisher. Inductively coupled plasma optical emission spectrometry (ICP-OES) analysis was utilized to measure the concentration of Te4+ and Hf4+ on an Agilent Technologies 5110 spectrometer. Photoluminescence (PL) and PL excitation (PLE) spectra were recorded with a continuous 150 W xenon lamp as a light source on the F380 fluorescence spectrophotometer. The photoluminescence quantum yield (PLQY) and PL lifetime were recorded with a FLS1000 spectrometer (Edinburgh Instruments) with a red-sensitive photomultiplier tube (R928) equipped with a xenon lamp (Xe 900) as the excitation source. Both the emission spectra and the chromaticity parameters of the WLED were obtained with the HAAS-2000 high precision array spectrometer (EverFine).2.5 Computational methods
Density functional theory (DFT) calculations were performed with the Vienna Ab Initio Simulation Package (VASP).24,25 The projector augmented wave (PAW) method based on a generalized gradient approximation (GGA) was adopted in the calculations, and the Perdew–Burke–Ernzerhof (PBE) functional was utilized for the exchange correlation potential.26 Because PBE functionals often underestimated the bandgaps, Heyd–Scuseria–Ernzerhof 06 (HSE06) hybrid functionals were used for the electronic structure calculations.27 The electronic iterative convergence criterion and the force convergence criterion were 1.0 × 10⁻⁵ eV per atom and 0.01 eV Å−1, respectively. In addition, the plane wave cutoff energy was set to 450 eV. The Brillouin zone was sampled with 4 × 4 × 4 Monkhorst Pack special k-point.3. Results and discussion
3.1 Structure and morphology of Rb2HfCl6:x%Te4+
As shown in Fig. 1(a), the structural model of VODPs, both Rb2HfCl6 and Rb2TeCl6 VODPs belong to the Fm3m space group in the cubic crystal system. The Rb+ ion occupies the central site of the crystal, which is surrounded by the [MCl6]2− (M = Hf, Te) octahedron and vacancy. The same crystal phase characteristic is the premise that Rb2HfCl6 and Rb2TeCl6 VODP are mutually solidly dissolved. The X-ray diffraction (XRD) patterns, as shown in Fig. 1(b), show the crystal phase information of the solid solutions with different Hf![[thin space (1/6-em)]](https://www.rsc.org/images/entities/char_2009.gif) :
:![[thin space (1/6-em)]](https://www.rsc.org/images/entities/char_2009.gif) Te ratios. Both the Rb2HfCl6 and Rb2TeCl6 can be anastomosed with the corresponding XRD diffraction peaks, indicating that the synthesized product has high purity. Notably, with the increase of the doping concentration of Te4+, the extracted (220) crystal plane diffraction peak showed a regular low angular shift, as shown in Fig. 1(c), which is attributed to the ion radius of Te4+ (r = 0.097 nm, CN = 6) being greater than Hf4+ (r = 0.071 nm, CN = 6). As shown in Table S1,† the ICP-OES analysis shows that the actual molar ratio of Rb2HfCl6:x%Te4+ (where x = 3, 10, 25, 50, and 75) was slightly lower than the feeding ratio. However, the overall change trend was consistent with the feeding amount, indicating that the content of Te and Hf was controllable in Rb2HfCl6:x%Te4+.
Te ratios. Both the Rb2HfCl6 and Rb2TeCl6 can be anastomosed with the corresponding XRD diffraction peaks, indicating that the synthesized product has high purity. Notably, with the increase of the doping concentration of Te4+, the extracted (220) crystal plane diffraction peak showed a regular low angular shift, as shown in Fig. 1(c), which is attributed to the ion radius of Te4+ (r = 0.097 nm, CN = 6) being greater than Hf4+ (r = 0.071 nm, CN = 6). As shown in Table S1,† the ICP-OES analysis shows that the actual molar ratio of Rb2HfCl6:x%Te4+ (where x = 3, 10, 25, 50, and 75) was slightly lower than the feeding ratio. However, the overall change trend was consistent with the feeding amount, indicating that the content of Te and Hf was controllable in Rb2HfCl6:x%Te4+.
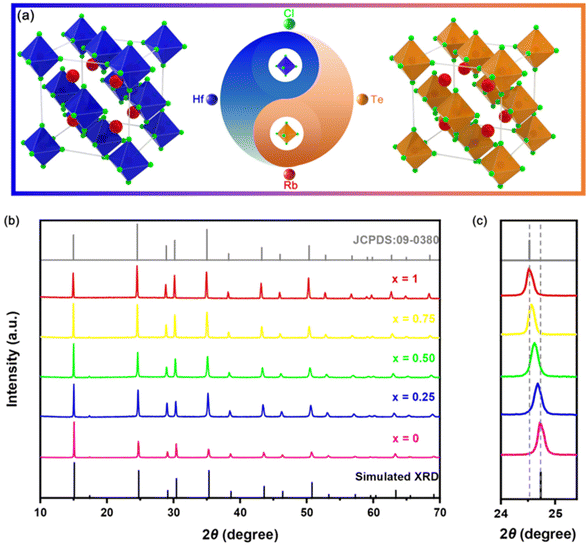 | ||
| Fig. 1 (a) The structural model of VODPs; (b) XRD spectrum of Rb2HfCl6:x%Te4+; and (c) the amplified XRD pattern of the sample (24.0–25.4°). | ||
The scanning electron microscope (SEM) images of the representative sample Rb2HfCl6:3%Te4+ are shown in Fig. S1(a) and (b).† It could be clearly observed that the synthesized sample has a uniform grain distribution with the size about 5 μm. The magnified grain presents a distinct octahedral bipyramidal structure, verifying a high crystallization quality of the synthetic product, see Fig. S1(c).† The energy dispersive spectrometer (EDS) element mapping shows that the elements of Rb, Hf, Te and Cl are uniformly distributed in the particles, indicating that Te4+-doped Rb2HfCl6 has good dispersibility, see Fig. S1(d–g).† The valence state composition of elements in Rb2HfCl6:3%Te4+ can be further analyzed with XPS spectra. As shown in Fig. S2(a),† the XPS spectra shows the characteristic peaks of Rb 3d, Hf 4f, Te 3d and Cl 2p, which is also strong evidence for the successful synthesis of Te4+-doped samples. The high-resolution XPS spectra, Fig. S2(b),† show that the binding energies peaking at 17.78 and 19.23 eV correspond to Hf 4f7/2 and Hf 4f5/2, respectively;28 Fig. S2(c)† shows that the binding energies peaking at 576.74 and 587.13 eV refer to the Te 3d3/2 and Te 3d5/2, respectively.10 XPS results indicated that both Hf and Te belong to the +4 valence state in Rb2HfCl6:x%Te4+.
3.2 Photoluminescence of Rb2HfCl6:x%Te4+
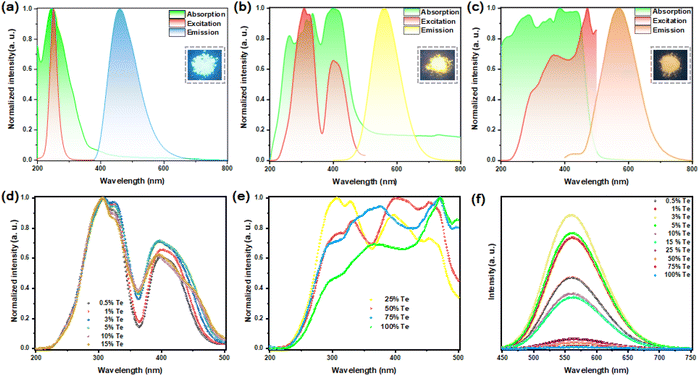
Fig. 2(a) shows the absorption, photoluminescence excitation (PLE) and PL peaks of the pristine Rb2HfCl6 position at 245 nm, 251 and 460 nm, respectively, which are similar to those of the recently reported Cs2HfCl6 or Cs2ZrCl6.9,10 Notably, Rb2HfCl6 has a bright blue luminescence, and a near-unity PLQY (98.56%), see Fig. S3(a),† which is the highest reported value of VODP pure matrix emission according to the literature we have retrieved.In contrast, the pristine Rb2TeCl6 has a weak orange-yellow emission with a broadband peak at 571 nm. Its PLE spectra consist of a main peak at 368 nm and a weak band located at 297 nm. And its absorption band is composed of a high-energy ultraviolet region at 286 nm and a near-UV-blue region at 387 nm. Please see Fig. 2(c). However, Rb2TeCl6 exhibits an extremely low PLQY (0.52%), see Fig. S3†(b). Rb2HfCl6 and Rb2TeCl6 VODPs have the same crystal structure, but their PLQY difference reaches 98.02%. Obviously, this phenomenon is closely related to the electronic structure inside the crystal.
After Te4+ doping, Rb2HfCl6:3%Te4+ exhibits compatible luminescence behavior with Rb2HfCl6 and Rb2TeCl6. Compared with Rb2TeCl6, its emission peak position has blueshifted with 11 nm. Under 560 nm wavelength monitoring, Rb2HfCl6:3%Te4+ has three PLE peaks located at 306, 325 and 398 nm, respectively. Meanwhile, the absorption peaks of 262 nm correspond to Rb2HfCl6 matrix absorption, while the absorption peaks of 315, 334, and 399 nm correspond to Te4+ doped absorption, see Fig. 2(b). Furthermore, Rb2HfCl6:3%Te4+ has a bright broadband yellow emission located at 560 nm with a FWHM of 102 nm and a large Stokes shift up to 161 nm. Such a large Stokes shift and an FWHM were also observed in Te4+ doped Sn-based and Zr-based VODPs.10,17,20
With the increase of Te4+ doping concentration (x = 0.5, 1, 3, 5, 10, and 15), the excitation peaks located in the high-energy ultraviolet region have almost no significant changes, while the range for the excitation peaks located in the near-UV-blue region gradually increases, see Fig. 2(d), indicating that the ratio of Te/Hf has a regulatory effect on the luminescence performance of Te4+-doped samples. As the concentration of Te4+ (x = 25, 50, 75) continues to increase, the range for the PLE peaks further widens and shows a trend of transition to Rb2TeCl6. However, the blue luminescence of the Rb2HfCl6 matrix gradually decreases until it disappears, see Fig. S4.† Therefore, it can be speculated that Te4+ affects the internal electronic structure and electron transport channel of the Rb2HfCl6 matrix. Notably, the PL intensity is the greatest when the doping concentration of Te4+ is 3%. Presently, the PLQY reaches 76.72% and 66.41% with excitations at 306 and 398 nm, respectively, see Fig. S3(c) and (d).†
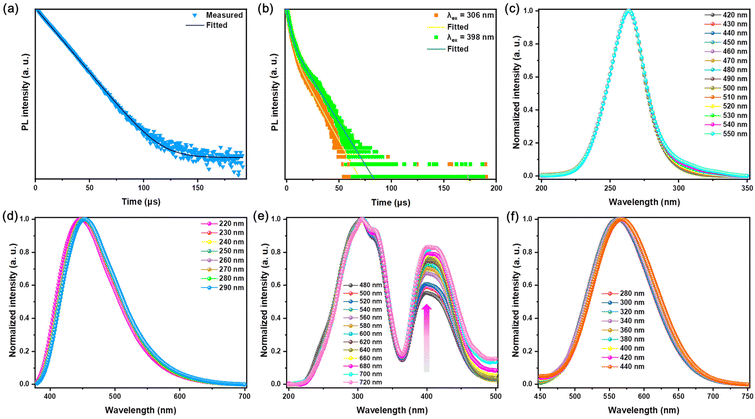
The decay curve of pristine Rb2HfCl6 conforms to the mono-exponential function fitting with a PL lifetime of 13.80 μs, see Fig. 3(a), which is similar to that of the recently reported Cs2ZrCl6 matrix.10 However, the decay curves of Rb2HfCl6:3%Te4+ excited with 306 nm and 398 nm conform to the double-exponential function fitting. For 306 nm, the short-lived and long-lived lifetimes are 2.89 μs (70.99%) and 12.52 (29.01%) μs, respectively; for 398 nm, the short-lived and long-lived lifetimes are 3.11(58.60%) μs and 13.63 (41.40%) μs, respectively, see Fig. 3(b), indicating that the broadband yellow emission excited by both 306 and 398 nm originate from the same luminescent center.
The fittings of PL lifetime decay curves are shown in formulas (1) and (2), which correspond to the mono-exponential and the double-exponential function, respectively:
| I(t) = A1exp(−t/τ) + I0 | (1) |
 | (2) |
Te4+ belongs to 5s2 ions, and the outer electron configuration is 5s25p4. The ground state is 1S0, and the excited state is divided into singlet (1P1) and triplet (3P0, 3P1 and 3P2). Due to the spin–orbit coupling (SOC), the electronic transitions 1S0 → 3P1 and 1S0 → 1P1 are allowed, while the electronic transitions 1S0 → 3P0 or 1S0 → 3P2 are forbidden in most cases, but the interaction between the triplet and the lattice vibration makes 1S0 → 3P2 partially allowed.29 However, the PL lifetime of singlet of ns2 is usually nanosecond grade.30 Obviously, the microsecond double-exponential decay lifetime of Rb2HfCl6:3%Te4+ conforms to the range of triplet. Additionally, the decay lifetime of Rb2HfCl6:3%Te4+ is similar to that of Te4+ doped Sn-based or Zr-based perovskite.10,17,20 Therefore, the excitation band located in the high-energy ultraviolet region refers to the 1S0 → 3P2 transition, while the excitation band located in the ultraviolet blue region refers to the 1S0 → 3P1 transition.21
STEs emission originates from the rapid lattice distortion, which is insensitive to external excitation interference.23,31 However, the light-emitting materials with Sb3+ doping belong to the same ns2 ions and have the same outer electronic structure as that of Te4+ ions. It is often observed that both the singlet and the triplet are vulnerable to the influence of the stimulated light-emitting environment.18,30 The wavelength-dependent PLE and PL spectra of pristine Rb2HfCl6 remain almost consistent, see Fig. 3(c) and (d), which is the common characteristic of STEs emission.23,31 After Te4+ doping, there is no significant change for the PL peak type and position within the excitation range of 280–440 nm, see Fig. 3(f). Under 480–720 nm wavelength monitoring, there is no significant change for the PL peak locating in the high-energy ultraviolet region. In contrast, the relative intensity of PL peaks locating in the low-energy ultraviolet blue region gradually increases or goes up, which is attributed to the increase of lattice vibration at the long wavelength monitoring wavelengths,32 see Fig. 3(f). The wavelength-dependent spectra show that the triplet relaxation of Rb2HfCl6:Te4+ reveals the similar properties to those of the STEs emission.
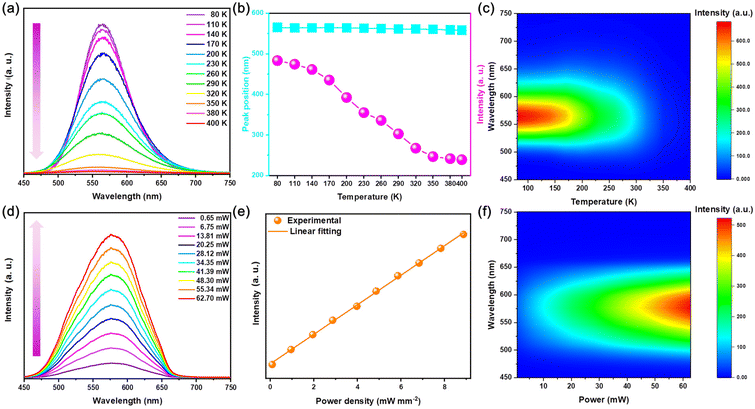
As the temperature increases between 80–400 K, the PL intensity of Rb2HfCl6:3%Te4+ gradually decreases and the position of the emission peak shows a slight blueshift from 565 to 558 nm, which is attributed to the increase in non-radiative relaxation caused with thermal lattice expansion,17 see Fig. 4(a) and (b). The temperature pseudo-color mapping shows that the broadband yellow luminescence always originates from the same luminescent center at different temperatures, see Fig. 4(c). Fig. 4(d) shows that the PL intensity continuously increases with the increase of excitation power, while the emission peak shape also remains unchanged. Moreover, as the power density increases, there is a linear relationship between the emission intensity and the power density, see Fig. 4(e). The variable power pseudo-color mapping also shows that the broadband yellow emission originates from a single emission center, see Fig. 4(f). Therefore, the variable temperature and power spectra further indicate that the triplet relaxation of Rb2HfCl6:3%Te4+ has the same luminescence properties as those of STEs.
3.3 Theoretical calculations of Rb2HfCl6:x%Te4+ electronic structures
Based on the discussion of luminescence dynamics, it has been found that it is still difficult to distinguish the STEs emission from the Te4+ ions emissions. Herein, theoretical calculations were used to obtain the electronic structures of both the pure matrix and the doped system. In order to study the efficient self-luminescence mechanism of Rb2HfCl6, the charge distributions of its valence band maximum (VBM) and conduction band minimum (CBM) were calculated to obtain the pathways for the electronic transitions. As shown in Fig. 5(a), the VBM charge of Rb2HfCl6 is uniformly distributed on the Cl atom with a circular cake-like charge structure. The CBM charge is distributed on the Hf atom with a square charge structure, see Fig. 5(b). This indicates that the electron transport process of Rb2HfCl6 is only completed in the Hf–Cl octahedron, and Rb atom plays the role supporting structure and connecting the Hf–Cl octahedron. Kang et al. found that the [HfCl6]2− octahedra played a central role to trap the local charge carriers in the Cs2HfCl6 matrix,33 resulting in the formation of low-energy exciton structures or self-trapped excitons, which was similar to the DFT calculation results in the Rb2HfCl6 matrix. Therefore, the carriers trapped by the [HfCl6]2− octahedra could combine with each other to form the efficient STEs emission. Considering that PBE functionals can underestimate the bandgap, we used the HSE06 hybrid functional to obtain a more accurate bandgap. As shown in Fig. 5(c), Rb2HfCl6 has a direct bandgap structure, and both the VBM and CBM are located in the Brillouin zone Γ point with a bandgap value of 4.14 eV. The density of states (DOS) analysis shows that the VBM is mainly contributed to the Cl-3p orbital, and the CBM is mainly provided by the Hf-5d orbital, see Fig. 5(d). Conversely, Rb2TeCl6 shows an indirect bandgap structure with a bandgap value of 2.66 eV, see Fig. 5(e). The VBM and CBM are located in the Γ and L points, respectively. Besides, the DOS analysis shows that the VBM is also contributed to the Cl-3p orbital, while the CBM is provided by the Te-5p orbital, see Fig. 5(f). In the indirect bandgap semiconductors, the recombination occurs only when the crystal momentum energy of electrons is converted into the phonons of lattice vibrations. While the direct bandgap semiconductor has no momentum change, and the photons are emitted during the recombination of electrons with holes, absorbing almost all the energy released. Therefore, the PLQY of Rb2HfCl6 is much higher than that of Rb2TeCl6.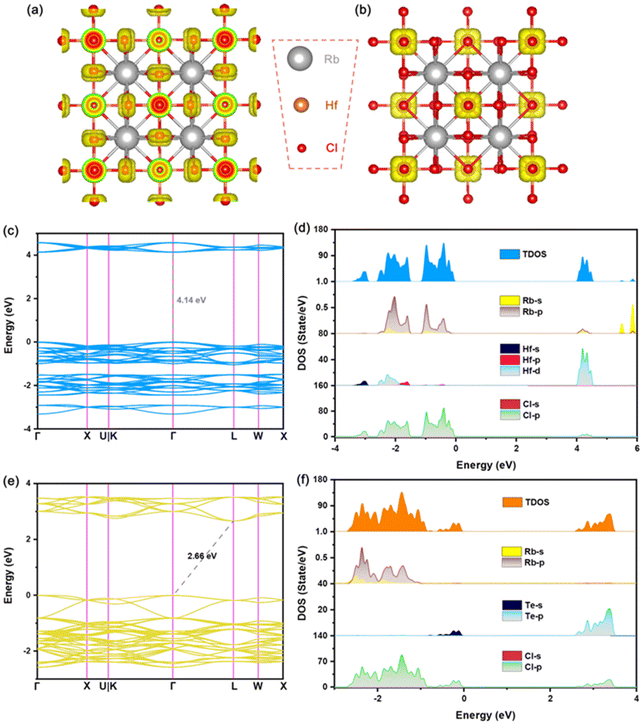 | ||
| Fig. 5 (a) VBM and (b) CBM charges of Rb2HfCl6; (c) the electronic band structure and (d) DOS of Rb2HfCl6; (e) the electronic band structure and (f) DOS of Rb2TeCl6. | ||
For Te4+-doped samples, the electronic structures of Rb2HfCl6:x%Te4+ (x = 25, 50, 75) were calculated according to the atomic ratio for the supercell. Compared with Rb2HfCl6, the intermediate impurity bands appear in the energy bands of Rb2HfCl6:x%Te4+ (x = 25, 50, 75), see Fig. S5(a), (c) and (e).† These impurity bands can recombine with the original conduction bands to form the new exciton-recombination channels. Therefore, we can observe that as the concentration of Te4+ increases, the emission peak of Rb2HfCl6 matrix gradually weakens and disappears. The VBM and CBM of Rb2HfCl6:x%Te4+ (x = 50, 75) are located at the Γ and L points, respectively. However, the VBM and CBM of Rb2HfCl6:25%Te4+ are located at the X and W points, respectively. This can be attributed to the regulatory effect of Te4+ content on the energy bands. Although Rb2HfCl6:25%Te4+ exhibits an indirect bandgap structure, its VBM and CBM recombination wave vectors are different from Rb2HfCl6:x%Te4+ (x = 50, 75). The Rb2HfCl6:x%Te4+ (x = 50, 75) gradually transitions toward Rb2TeCl6 with the increase of x value, and the wave vectors of VBM and CBM recombination are the same as that of Rb2TeCl6. Therefore, the bandgap value gradually decreases as the Te4+ content increases. Meanwhile, the DOS shows that the energy level orbitals of Te gradually increase, and the change of DOS further reflects the regulation of electronic structure with Te4+, see Fig. S5(d) and (f).† Therefore, the quenching for the pristine Rb2HfCl6 blue luminescence and broadband yellow luminescence caused by the increase of Te4+ concentration is mainly due to the change of electronic band structure. The band regulation process of Te4+ is consistent with the regulatory process of luminescence.
3.4 Theoretical calculations of Te-doped VODPs
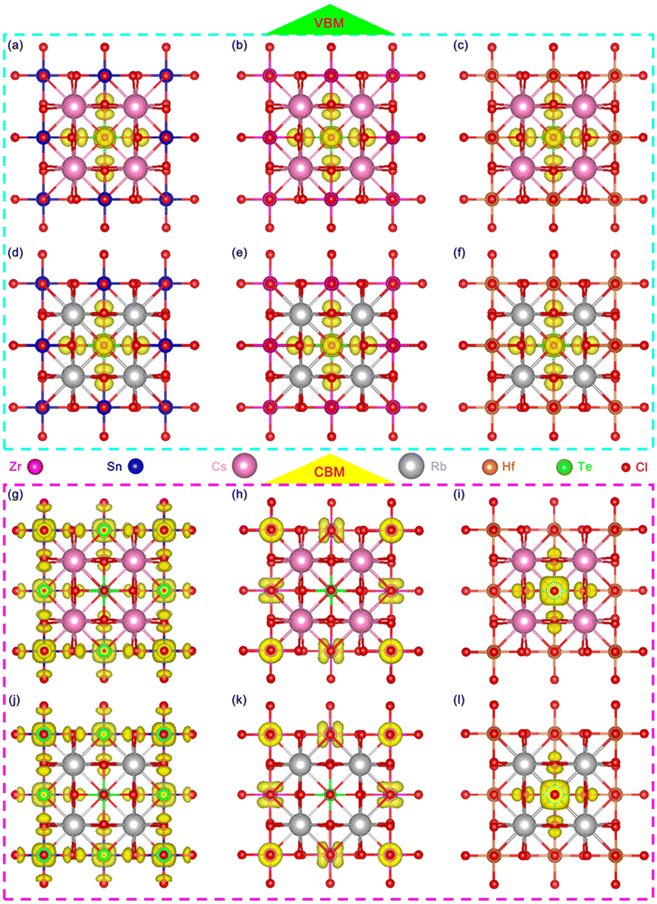
In order to further analyze the luminescence mechanism of Te-doped VODPs, we calculated the element orbital projection energy bands and charge distribution for six structures of A = Cs, Rb; M = Sn, Zr and Hf, which are shown in Fig. 6(a–f). It can be seen that their VBM charges are distributed on the Te–Cl octahedron. The elemental orbital projection band shows that the charges of the VBM are contributed to the Te-5s orbital and the Cl-3p orbital, see Fig. S6(a–f).† The charge distribution of the CBM has changed due to the band recombination after Te doping. For A = Cs, Rb and M = Sn, the CBM charges are distributed on the Sn–Cl octahedron, see Fig. 6(g) and (j); and the element orbital projection energy band shows that the CBM is mainly contributed to the Sn-5s and the Cl-3p orbitals, see Fig. S7a, b and S8a, b.† For A = Cs, Rb and M = Zr, the CBM charges are distributed on Zr atoms, see Fig. 6(h) and (k), and the elemental orbital projection band shows that the CBM is mainly contributed by the Zr-4d orbital, see Fig. S7c, d and S8c, d.† For A = Cs, Rb and M = Hf, the CBM charges are distributed on the Te–Cl octahedron, see Fig. 6(i) and (l), and the element orbital projection energy band shows that the CBM is mainly provided by the Te-5p and the Cl-3p orbitals, see Fig. S7e, f and S8e, f.† The analyses of the charges and the elemental orbitals indicate that the charges near the VBM and CBM are independent of the element at A sites, but are related to the element at M sites, which is similar to that of ABX3 type perovskite, the metal elements at M sites play a decisive role in the charge transport of the light-emitting system.1,4It is worth noting that the charges at the CBM are mainly distributed near the position for M = Sn, Zr, while near the position of Te for M = Hf. Therefore, the exciton recombination in Hf-based VODPs directly acts on the Te–Cl octahedron. For Sn, Zr-based VODPs, the exciton recombination needs to be transmitted through the matrix vibration, accompanied by the generation of STEs emission.31
In order to study the influence of M–Cl octahedron on the luminescence property, we calculated the two-dimensional electron localization function (ELF) for Te-doped Rb2MCl6 (M = Sn, Zr, Hf), see Fig. 7. It should be emphasized that it was confirmed that A = Cs and Rb have no additional impact on the electronic structure and charge distribution of VODPs based on the previous discussion. As shown in Fig. 7(a–c), the ionic bond characteristics of M–Cl bond in the Sn–Cl, Zr–Cl and Hf–Cl octahedra gradually become stronger, and the covalent bond characteristics gradually become weaker. It is worth noting that the Hf–Cl bond almost completely exhibits ionic bond characteristics. After Te4+ doping, the Te–Cl bond shows higher covalent bond characteristics in all VODP environments, see Fig. 7(d–f). In addition, the introduction of Te ions did not alter the characteristic of M–Cl bonds surrounding the Te atoms. The ELF analysis shows that the weak interaction between Hf and Cl of the Hf–Cl octahedron can greatly promote the Cl−–Te4+ charge transfer process,34 thereby facilitating the exciton recombination in the Te–Cl octahedron. However, both Sn–Cl and Zr–Cl octahedra have strong covalent bond characteristics, which hinders the effective charge transfer of Cl− to Te4+ and results in their electrons having to pass through the matrix for the transport.35 The charge distribution and ELF analysis mutually confirm that the exciton recombination of Te-doped Hf-based VODPs directly occurs on the Te–Cl octahedron, which conforms to the characteristics of Te4+ ions luminescence. The exciton recombination for Te-doped Sn, Zr-based VODPs requires the vibration transmission through the matrix host, exhibiting STEs emission characteristics.
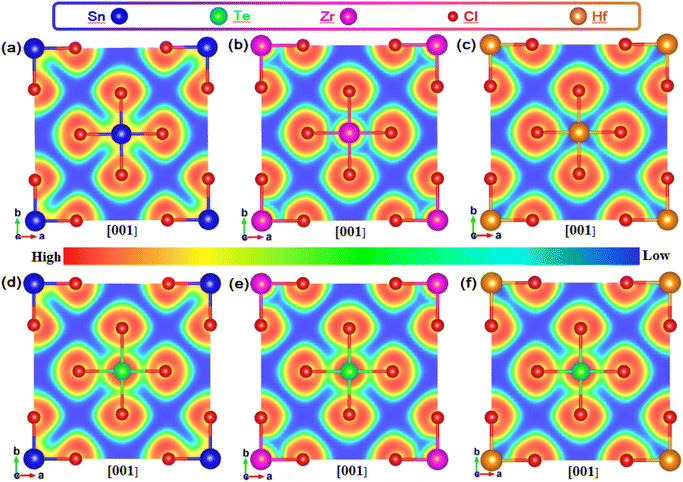 | ||
| Fig. 7 ELF of (a) Rb2SnCl6, (b)Rb2ZrCl6 and (c) Rb2HfCl6. ELF of Te-doped (d) Rb2SnCl6, (e)Rb2ZrCl6 and (f) Rb2HfCl6. | ||
3.5 Luminescence mechanism of Rb2HfCl6:x%Te4+
The luminescence mechanisms of Te4+-doped VODPs are shown in Fig. 8. After absorbing the external excitation light, the electrons are trapped by the Te–Cl octahedron and arranged on the 5s energy level of the ground state Te4+. There are two types of electron transfer from the ground state to the excited state. For M = Sn, Zr, the electrons are first absorbed by the Zr atom or Sn–Cl octahedron, and then transferred to the 5p energy level of Te. For M = Hf, the electrons are directly elevated to the 5p level of Te. Therefore, Te4+-doped Sn, Zr-based VODPs have STEs emission characteristics, while Te4+-doped Hf-based VODPs are more in line with the characteristics of Te4+ ions luminescence.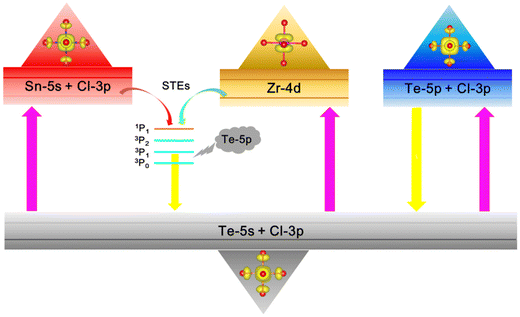 | ||
| Fig. 8 Schematic diagram of the luminescence mechanism of Te4+-doped metal VODPs with different M-sites. | ||
3.6 Stability analysis of Rb2HfCl6:3%Te4+
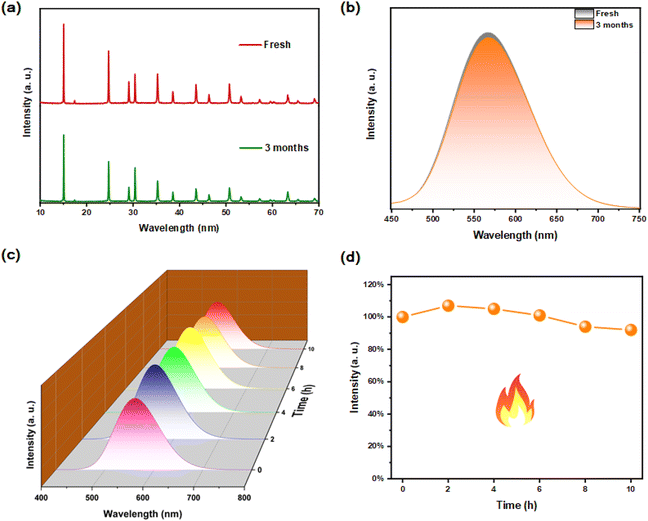
The air stability and thermal stability of materials are important indicators for optical applications. After Rb2HfCl6:3%Te4+ was placed in a natural environment for 3 months, there is no impurity peak in its XRD pattern, indicating that the original crystal structure has been still maintained, see Fig. 9(a). Meanwhile, the PL spectrum is almost the same as the original one, see Fig. 9(b), indicating that the luminescence performance has not been affected yet. After the heat treatment at 200 °C for 10 hours, no additional emission peaks were found in the Rb2HfCl6:3%Te4+, and the fluorescence intensity did not show significant quenching, see Fig. 9(c). During the heat treatment process, the PL strength first increased, see Fig. 9(d), which is attributed to the reduction of surface defect states.36 After heat treatment, the strength of PL still maintains about 92% of the original strength, indicating that Rb2HfCl6:3%Te4+ has good thermal stability. These results indicate that Rb2HfCl6:x%Te4+ can overcome the air stability and thermal stability defects that interfere with the ABX3 perovskite.37,383.7 WLED application
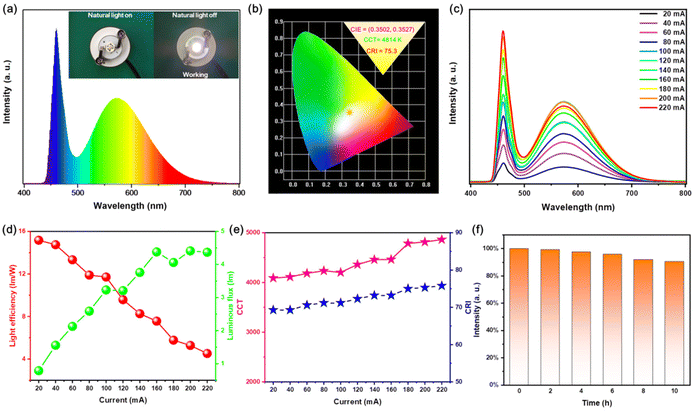
Now that Rb2HfCl6:Te4+ not only has a high PLQY broadband emission but also a good thermal stability, it is a very competing material for WLED. Herein, we have assembled WLED with a blue light chip and Rb2HfCl6:3%Te4+ powder. Fig. 10(a) shows that the PL spectrum of WLED operating at a current of 200 mA is only composed of a blue chip peak and a broadband yellow peak. The inset of Fig. 10(a) shows that the WLED emitted a bright white light. And the Commission Internationale de l'Eclairage (CIE) coordinates of WLED are located at (0.3502, 0.3527), the correlated color temperature (CCT) is 4814 K, and the color-rendering index (CRI) is 75.3, see Fig. 10(b). The commercial material of YAG: Ce is usually excited by the blue LED light to obtain the white emission with a CRI ∼70 and CCT ∼5400 K.39 The WLED of Rb2HfCl6:3%Te4+ is closer to the standard white light compared to YAG: Ce and has a higher CRI. As the current increases, the intensity for both the blue emission and the broadband yellow emission of WLED gradually increase simultaneously, see Fig. 10(c), indicating that Rb2HfCl6:3%Te4+ has a good adaptability to the blue light chips. On the other hand, the luminous flux of WLED gradually increases with the increase in current, while the optical efficiency gradually decreases, see Fig. 10(d). This is attributed to the limited effective utilization of Rb2HfCl6:3%Te4+ for the blue light chip excitation. However, both CCT and CRI increases with the current due to the luminous flux increase, see Fig. 10(e). As shown in Fig. 10(f), the stability test of WLED shows that the luminous intensity decreases very slowly within 10 hours operating time, and keeps above 90%, revealing that this WLED is of high stability revealing that this WLED is of high stability. The chromaticity parameters and the stability of WLED indicate that Rb2HfCl6:3%Te4+ has the potential of solid-state lighting.3.8 Anti-counterfeiting application
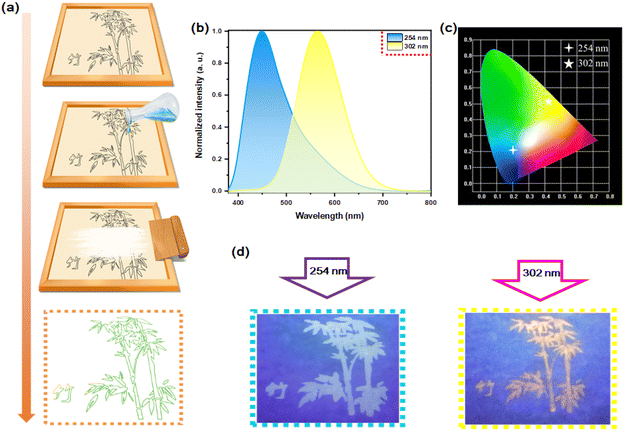
Although the doping concentration is very small, Te4+-doped Rb2HfCl6 simultaneously possesses the blue luminescence of pristine Rb2HfCl6 and the yellow luminescence of Te4+ ions. Therefore, it is a good candidate material for the fluorescence anti-counterfeiting. Fig. 11(a) shows the process to prepare anti-counterfeiting patterns with the screen printing. The Rb2HfCl6:0.5%Te4+ can also emit blue and yellow lights under excitation at 254 nm and 302 nm, respectively, see Fig. 11(b), of which CIE coordinates are (0.1991, 0.2106) and (0.4322, 0.5245), respectively, see Fig. 11(c). Under the irradiation of 254 nm and 302 nm ultraviolet lamps, two patterns can be clearly distinguished from each other, see Fig. 11(d), indicating that Rb2HfCl6:0.5%Te4+ has a high practical application value in the preventing counterfeiting.4. Conclusion
In summary, we synthesized a Rb2TexHf1−xCl6 vacancy ordered double perovskite through a precipitation method. The main conclusions obtained include:(1) Pristine Rb2HfCl6 exhibits a direct bandgap structure and blue emission close to the near-unity PLQY (98.56%), while pristine Rb2TeCl6 exhibits an indirect bandgap structure and weak orange–yellow broadband emission (PLQY = 0.52%). As the Te4+ content increases in Rb2TexHf1−xCl6, the energy bands of the Te4+-doping samples undergo recombination, resulting in changes in fluorescence performance. The PLQY of Rb2HfCl6:0.5%Te4+ broadband yellow emission reaches 76.72%.
(2) Theoretical calculations further reveal the luminescence mechanism of Te4+-doped VODPs (A = Cs, Rb; M = Sn, Zr, Hf). In these emitters, the ground state 5s energy levels are all contributed by the Te–Cl octahedron. The difference is that Sn- and Zr-based VODPs need to pass through the Sn–Cl octahedron or Zr atom in the matrix to transfer to the excited state 5p level, while Hf-based VODPs directly transition to the excited state 5p level. Based on the ELF analysis, it is found that the ionic bonding properties of M–Cl (M = Sn, Zr, Hf) gradually become stronger in VODPs, while Hf–Cl almost completely exhibits the ionic bonding properties. It is precisely because of the low bond cooperation in Hf-based VODPs that the excitons directly recombine in the Te–Cl octahedron. Therefore, Te4+-doped Hf-based VODPs are more in line with the characteristics of Te4+ ions luminescence, while Te4+-doped Sn- and Zr-based VODPs have the STEs emission characteristics.
(3) Based on the high PLQY and tunable luminescence characteristics of Rb2HfCl6:Te4+, we have successfully applied it to the fields of WLED and fluorescence anti-counterfeiting. A WLED with the CIE coordinates at (0.3502, 0.3527), a CCT of 4814 K and a CRI of 75.3 was obtained, which are close to the range of standard white light. Under the irradiation of 254 nm and 302 nm ultraviolet lamps, blue and yellow luminescence patterns can be clearly distinguished.
This work not only demonstrates the excellent luminescence performance of Rb2HfCl6:Te4+, but also further elucidates the luminescence mechanism of Te4+-doped VODPs.
Conflicts of interest
There are no conflicts to declare.Acknowledgements
This work was partly supported by the National Natural Science Foundation of China (No. 51352002 and 12074195).References
- F. Igbari, Z.-K. Wang and L.-S. Liao, Progress of Lead-Free Halide Double Perovskites, Adv. Energy Mater., 2019, 9, 1803150 CrossRef.
- Z. Tan, J. Li, C. Zhang, Z. Li, Q. Hu, Z. Xiao, T. Kamiya, H. Hosono, G. Niu, E. Lifshitz, Y. Cheng and J. Tang, Highly Efficient Blue-Emitting Bi-Doped Cs2SnCl6 Perovskite Variant: Photoluminescence Induced by Impurity Doping, Adv. Funct. Mater., 2018, 28, 1801131 CrossRef.
- S. A. Khan, N. Z. Khan, M. Sohail, M. Runowski, X. Xu and S. Agathopoulos, Recent developments of lead-free halide-perovskite nanocrystals: Synthesis strategies, stability, challenges, and potential in optoelectronic applications, Mater. Today Phys., 2023, 34, 101079 CrossRef CAS.
- M. Li and Z. Xia, Recent progress of zero-dimensional luminescent metal halides, Chem. Soc. Rev., 2021, 50, 2626–2662 RSC.
- W. Ning and F. Gao, Structural and Functional Diversity in Lead-Free Halide Perovskite Materials, Adv. Mater., 2019, 31, 1900326 CrossRef PubMed.
- Y. Zhang, Y. Ma, Y. Wang, X. Zhang, C. Zuo, L. Shen and L. Ding, Lead-Free Perovskite Photodetectors: Progress, Challenges, and Opportunities, Adv. Mater., 2021, 33, 2006691 CrossRef CAS PubMed.
- T. Zheng, J. Wu, D. Xiao and J. Zhu, Recent development in lead-free perovskite piezoelectric bulk materials, Prog. Mater. Sci., 2018, 98, 552–624 CrossRef CAS.
- K. Han, J. Qiao, S. Zhang, B. Su, B. Lou, C.-G. Ma and Z. Xia, Band Alignment Engineering in ns(2) Electrons Doped Metal Halide Perovskites, Laser Photonics Rev., 2023, 17, 202200458 Search PubMed.
- R. X. Liu, W. J. Zhang, G. J. Li and W. J. Liu, An ultraviolet excitation anti-counterfeiting material of Sb3+ doped Cs2ZrCl6 vacancy-ordered double perovskite, Inorg. Chem. Front., 2021, 8, 4035–4043 RSC.
- T. Chang, Q. Wei, R. Zeng, S. Cao, J. Zhao and B. Zou, Efficient Energy Transfer in Te4+-Doped Cs2ZrCl6 Vacancy-Ordered Perovskites and Ultrahigh Moisture Stability via A-Site Rb-Alloying Strategy, J. Phys. Chem. Lett., 2021, 12, 1829–1837 CrossRef CAS PubMed.
- M. Jin, W. Zheng, Z. Gong, P. Huang, R. Li, J. Xu, X. Cheng, W. Zhang and X. Chen, Unraveling the triplet excited-state dynamics of Bi3+ in vacancy-ordered double perovskite Cs2SnCl6 nanocrystals, Nanomater. Res., 2022, 15, 6422–6429 CAS.
- Z. Li, Q. Li, M. Cao, Z. Rao, X. Shi, L. Zhou, X. Zhao and X. Gong, Multimodal Luminescent Low-Dimension Cs2ZrCl6:xSb(3+) Crystals for White Light-Emitting Diodes and Information Encryption, Langmuir, 2023, 39, 3792–3799 CrossRef CAS PubMed.
- J. Sun, W. Zheng, P. Huang, M. Zhang, W. Zhang, Z. Deng, S. Yu, M. Jin and X. Chen, Efficient Near-Infrared Luminescence in Lanthanide-Doped Vacancy-Ordered Double Perovskite Cs2ZrCl6 Phosphors via Te4+ Sensitization, Angew. Chem., Int. Ed., 2022, 61, e202201993 CrossRef CAS PubMed.
- R. Wu, Y. Liu, S. Hu, P. Fu and Z. Xiao, Red-Emitting Perovskite Variant Cs2PtCl6 Phosphor: Material Design, Luminous Mechanism, and Application in High-Color-Rendering White Light-Emitting Diodes, Adv. Opt. Mater., 2022, 10, 2201081 CrossRef CAS.
- L. Zi, W. Xu, Z. Song, R. Sun, S. Liu, T. Xie, J. Zhu, S. Lu and H. Song, Highly efficient and stable Cs2TeCl6:Cr3+ perovskite microcrystals for white light emitting diodes, J. Mater. Chem. C, 2023, 11, 2695–2702 RSC.
- S. A. Qamar, T.-W. Lin, Y.-T. Tsai and C. C. Lin, Lead-free Rb2SnCl6:Bi Perovskite Nanocrystals for Luminescence Emission, ACS Appl. Nano Mater., 2022, 5, 7580–7587 CrossRef CAS.
- R. Zeng, K. Bai, Q. Wei, T. Chang, J. Yan, B. Ke, J. Huang, L. Wang, W. Zhou, S. Cao, J. Zhao and B. Zou, Boosting triplet self-trapped exciton emission in Te(IV)-doped Cs2SnCl6 perovskite variants, Nanomater. Res., 2021, 14, 1551–1558 CAS.
- B. Chen, Y. Guo, Y. Wang, Z. Liu, Q. Wei, S. Wang, A. L. Rogach, G. Xing, P. Shi and F. Wang, Multiexcitonic Emission in Zero-Dimensional Cs2ZrCl6:Sb3+ Perovskite Crystals, J. Am. Chem. Soc., 2021, 143, 17599–17606 CrossRef CAS PubMed.
- Z. F. Tan, Y. M. Chu, J. X. Chen, J. H. Li, G. Q. Ji, G. D. Niu, L. Gao, Z. W. Xiao and J. Tang, Lead-Free Perovskite Variant Solid Solutions Cs2Sn1-xTexCl6: Bright Luminescence and High Anti-Water Stability, Adv. Mater., 2020, 32, 2002443 CrossRef CAS PubMed.
- S. F. Gong, R. R. Wu, Q. J. Han, D. G. Kong and W. Z. Wu, Lead-free perovskite Rb2Sn1-xTexCl6 with bright luminescence for optical thermometry and tunable white light emitting diodes, J. Mater. Chem. C, 2022, 10, 13217–13224 RSC.
- W. Zhang, W. Zheng, L. Li, P. Huang, Z. Gong, Z. Zhou, J. Sun, Y. Yu and X. Chen, Dual-Band-Tunable White-Light Emission from Bi3+/Te4+ Emitters in Perovskite-Derivative Cs2SnCl6 Microcrystals, Angew. Chem., Int. Ed., 2022, 61, e202116085 CrossRef CAS PubMed.
- F. Jiang, Z. Wu, M. Lu, Y. Gao, X. Li, X. Bai, Y. Ji and Y. Zhang, Broadband Emission Origin in Metal Halide Perovskites: Are Self-Trapped Excitons or Ions?, Adv. Mater., 2023, e2211088 CrossRef PubMed.
- Q. Guo, X. Zhao, B. Song, J. Luo and J. Tang, Light Emission of Self-Trapped Excitons in Inorganic Metal Halides for Optoelectronic Applications, Adv. Mater., 2022, 34, 2201008 CrossRef CAS PubMed.
- G. Kresse and J. Furthmüller, Efficiency of Ab-Initio Total Energy Calculations for Metals and Semiconductors Using a Plane-WaveBasis Set, Comput. Mater. Sci., 1996, 6, 15–50 CrossRef CAS.
- G. Kresse and D. Joubert, From Ultrasoft Pseudopotentials to the Projector Augmented-Wave Method, Phys. Rev. B: Condens. Matter Mater. Phys., 1999, 59, 1758–1775 CrossRef CAS.
- J. P. Perdew, K. Burke and M. Ernzerhof, Generalized Gradient Approximation Made Simple, Phys. Rev. Lett., 1996, 77, 3865–3868 CrossRef CAS PubMed.
- J. Heyd, G. E. Scuseria and M. Ernzerhof, Hybrid Functionals Based on a Screened Coulomb Potential, J. Chem. Phys., 2003, 118, 8207–8215 CrossRef CAS.
- H. S. Tsai, J. W. Liou, I. Setiyawati, K. R. Chiang, C. W. Chen, C. C. Chi, Y. L. Chueh, H. Ouyang, Y. H. Tang, W. Y. Woon and J. H. Liang, Photoluminescence Characteristics of Multilayer HfSe2 Synthesized on Sapphire Using Ion Implantation, Adv. Mater. Interfaces, 2018, 5, 1701619 CrossRef.
- H. Arfin, A. S. Kshirsagar, J. Kaur, B. Mondal, Z. Xia, S. Chakraborty and A. Nag, ns(2) Electron (Bi3+ and Sb3+) Doping in Lead-Free Metal Halide Perovskite Derivatives, Chem. Mater., 2020, 32, 10255–10267 CrossRef CAS.
- Y. Jing, Y. Liu, M. Li and Z. Xia, Photoluminescence of Singlet/Triplet Self-Trapped Excitons in Sb3+-Based Metal Halides, Adv. Opt. Mater., 2021, 9, 2002213 CrossRef CAS.
- J. Luo, X. Wang, S. Li, J. Liu, Y. Guo, G. Niu, L. Yao, Y. Fu, L. Gao, Q. Dong, C. Zhao, M. Leng, F. Ma, W. Liang, L. Wang, S. Jin, J. Han, L. Zhang, J. Etheridge, J. Wang, Y. Yan, E. H. Sargent and J. Tang, Efficient and stable emission of warm-white light from lead-free halide double perovskites, Nature, 2018, 563, 541–544 CrossRef CAS PubMed.
- Y. Jing, Y. Liu, J. Zhao and Z. Xia, Sb3+ Doping-Induced Triplet Self-Trapped Excitons Emission in Lead-Free Cs2SnCl6 Nanocrystals, J. Phys. Chem. Lett., 2019, 10, 7439–7444 CrossRef CAS PubMed.
- B. Kang and K. Biswas, Carrier Self-trapping and Luminescence in Intrinsically Activated Scintillator: Cesium Hafnium Chloride (Cs2HfCl6), J. Phys. Chem. C, 2016, 120, 12187–12195 CrossRef CAS.
- S. Y. Han, D. T. Tu, Z. Xie, Y. Q. Zhang, J. Y. Li, Y. F. Pei, J. Xu, Z. L. Gong and X. Y. Chen, Unveiling Local Electronic Structure of Lanthanide-Doped Cs2NaInCl6 Double Perovskites for Realizing Efficient Near-Infrared Luminescence, Adv. Sci., 2022, 9, 202203735 Search PubMed.
- T. Cai, W. W. Shi, D. J. Gosztola, K. Kobbekaduwa, H. J. Yang, N. Jin, Y. Nagaoka, L. Dube, J. Schneider, S. Hwang, J. B. Gao, X. D. Ma and O. Chen, Colloidal synthesis and charge carrier dynamics of Cs4Cd1-xCuxSb2Cl12 (0 ≤ x ≤ 1) layered double perovskite nanocrystals, Matter, 2021, 4, 2936–2952 CrossRef CAS.
- A. Yan, K. Li, Y. Zhou, Y. Ye, X. Zhao and C. Liu, Tuning the optical properties of Cs2SnCl6:Bi and Cs2SnCl6:Sb lead-free perovskites via post-annealing for white LEDs, J. Alloys Compd., 2020, 822, 153528 CrossRef CAS.
- W. Xu, Z. Cai, F. Li, J. Dong, Y. Wang, Y. Q. Jiang and X. Chen, Embedding lead halide perovskite quantum dots in carboxybenzene microcrystals improves stability, Nano Res., 2017, 10, 2692–2698 CrossRef CAS.
- W. Lv, L. Li, M. Xu, J. Hong, X. Tang, L. Xu, Y. H. Wu, R. Zhu, R. F. Chen and W. Huang, Improving the stability of metal halide perovskite quantum dots by encapsulation, Adv. Mater., 2019, 31, 1900682 CrossRef PubMed.
- J. McKittrick and L. E. Shea-Rohwer, Review: Down Conversion Materials for Solid-State Lighting, J. Am. Ceram. Soc., 2014, 97, 1327–1352 CrossRef CAS.
Footnote |
| † Electronic supplementary information (ESI) available. See DOI: https://doi.org/10.1039/d4qi00109e |
| This journal is © the Partner Organisations 2024 |

