Achieving high-sensitivity dual-mode optical thermometry via phonon-assisted cross-relaxation in a double-perovskite structured up-conversion phosphor†
Houhe
Dong‡
a,
Zonghao
Lei‡
a,
Shikun
Su
a,
Wenhua
Yang
*a,
Xuyang
Zhang
a,
Wenying
Teng
a,
Guangyue
Zu
a,
Bing
Teng
*ab and
Degao
Zhong
 *abc
*abc
aCollege of Physics, University-Industry Joint Center for Ocean Observation and Broadband Communication, Qingdao University, Qingdao 266071, China. E-mail: yangwh@qdu.edu.cn; 5108tb@163.com; zhdg2008@126.com
bQingdao Broadband Terahertz Spectroscopy Technology Engineering Research Center, Qingdao University, Qingdao 266071, China
cWeihai Innovation Research Institute of Qingdao University, Weihai 264200, China
First published on 15th April 2024
Abstract
High sensitivity is still a challenge for achieving optical thermometry applications. In this work, we effectively regulated the phonon energy of matrix crystals by substituting the A-site ions in the tellurate double perovskite up-conversion (UC) phosphors of ALaLiTeO6:5%Yb3+,0.2%Tm3+ with Ca2+, Sr2+, and Ba2+. On this basis, a dual-mode thermometer based on the fluorescence intensity ratio of FIR1 = I694/I649 and FIR2 = I694/I475 was constructed by utilizing significant differences in the response to temperature changes between 649 nm/475 nm emissions (from both Yb3+ and Tm3+) and 694 nm UC emission (from Yb3+ → Tm3+). As the temperature increases, involving the assistance of matrix crystal phonon energy, the collaborative action of two non-radiative transitions (Tm3+) and three cross-relaxation processes (Tm3+–Tm3+) can degrade the emission intensity at 475 and 649 nm, but enhance the UC emission intensity at 694 nm, thus effectively improving the thermometry sensitivity. Finally, we achieved the maximum thermometry sensitivity values of Sr = 4.69% K−1 and Sa = 10.05% K−1. These results provide new insights into exploring and constructing ultra-sensitive optical temperature sensors.
1. Introduction
Optical thermometry uses temperature-sensitive parameters such as the luminescence wavelength, intensity, lifetime, and fluorescence intensity ratio (FIR) of fluorescent substances to achieve temperature measurement.1–3 Among them, FIR-based thermometry has become a widely used temperature measurement technology solution due to its advantages such as fast response speed and a wide temperature measurement range.4–6 FIR technology can be implemented in two ways: thermal coupling level (TCL) and non-thermal coupling level (NTCL).7,8 However, since the energy gap (ΔE) of the TCL is limited to a range of 200–2000 cm−1, it is difficult to obtain high relative sensitivity because it is proportional to ΔE (Sr = ΔE/kT2).9,10 Hence, there is substantial practical merit in the design and development of advanced optical thermometers characterized by high sensitivity across a broad temperature range, leveraging the NTCL of luminescent ions.11–13For UC luminescent materials used in optical thermometry, high-quality matrix crystals are one of the key elements to achieve accurate and efficient optical thermometers.14–18 Fluoride matrix crystals (such as NaYF4, SrF2, LuF3, etc.) normally exhibit efficient UC luminescence due to their low phonon energy.19–21 However, their production processes are complex and their poor thermal stability can induce the degradation of luminescence properties under harsh conditions. Oxide matrix crystals such as titanate, molybdate and tellurate not only maintain excellent chemical structure stability at high temperatures, but also have suitable phonon energies, which can provide various crystal field environments for rare earth luminescent ions, making them ideal UC luminescent matrix crystals.22–27 Among them, the recently developed tellurate double perovskite structure has multiple cation sites that can be selectively occupied by luminescent ions, providing multiple options for regulating luminescence performance and thermometric energy level pair screening. In particular, the double perovskite structure of ALaLiTeO6 (A = Ca, Sr, and Ba) has received widespread attention as a matrix for luminescent materials.28–30 In 2014, S. K. Sali et al. for the first time synthesized a double perovskite-type compound BaA'LaTeO6 (A′ = Na, K, and Rb) and determined its crystal structure using Rietveld analysis and neutron diffraction data.31 In 2017, G. Subodh et al. synthesized the B-site ordered double perovskite ALaLiTeO6 (A = Ba and Sr) and investigated the vibrating phonon modes for the first time.32 In 2021, Subodh Ganesanpotti et al. investigated the application of an Mn4+-activated SrLaLiTeO6 crimson phosphor in indoor plant growth LEDs. The redshift of the high-energy phonon mode in Raman spectroscopy and infrared spectroscopy confirmed the B-site substitution of Mn4+ ions.33 In 2023, Dai et al. proved that SrLaLiTeO6:Eu/Dy were potential candidate phosphors for indoor plant growth LEDs and pc-wLEDs.34 In the same year, Zhang et al. prepared an Er3+ doped ALaLiTeO6 (A = Ba, Sr, Ca and Mg) phosphor and revealed its excellent temperature measurement performance. Previous studies have confirmed that ALaLiTeO6 is an excellent matrix crystal.35 However, as far as we know, research on the UC phosphors of ALaLiTeO6 (A = Ca, Sr, and Ba) doped with Yb3+ and Tm3+ has not been reported and its application potential in optical thermometry urgently needs to be explored and evaluated.
In this work, UC phosphors of ALaLiTeO6:Yb3+,Tm3+ (A = Ca, Sr, and Ba) were synthesized through the high-temperature solid-state method. The characteristics of the crystal structure were analyzed in detail through first-principles calculations and X-ray diffraction. The temperature-dependent UC emission spectra were measured. With the increase of temperature, phonon-assisted cross-relaxation processes gradually play dominant roles in determining the emission intensities at 475, 649 and 694 nm. The maximum thermometry sensitivities of Sr = 4.69% K−1 (303 K) and Sa = 10.05% K−1 (693 K) were achieved from the constructed dual-mode thermometer based on the fluorescence intensity ratios of FIR1 = I694/I649 and FIR2 = I694/I475. The application potential of ALaLiTeO6:5%Yb3+,0.2%Tm3+ in temperature sensing is evaluated.
2. Experimental
2.1 Materials synthesis
All samples of ALaLiTeO6:Yb3+,Tm3+ (A = Ca, Sr, and Ba) were synthesized using the high-temperature solid-state method. Firstly, the initial reaction compounds (purchased from Aladdin) of CaCO3 (99.9%), SrCO3 (99.9%), BaCO3 (99.9%), La2O3 (99.99%), Li2CO3 (99.99%), TeO2 (99.9%), Yb2O3 (99.99%), and Tm2O3 (99.99%) were weighed according to the stoichiometric ratio. Secondly, the starting materials were thoroughly mixed in an agate mortar and ground for 30 minutes. Thirdly, the ground mixture was pre-sintered at 600 °C for 6 hours, and then the samples were sintered at 1000 °C for 4 hours. Finally, the samples were cooled to room temperature and ground into powder for subsequent structural and optical performance testing.2.2 Characterization
The phase structure of the phosphor ALaLiTeO6:Yb3+,Tm3+ (A = Ca, Sr, and Ba) was tested using a Rigaku Ultima IV X-Ray diffractometer (XRD) equipped with Cu-Kα radiation (λ = 1.5418 Å) and the scan rate was 5° min−1 at 40 kV and 40 mA. The morphology was obtained using a scanning electron microscope (JSM-7800F), and the elemental distribution was analyzed by an energy dispersive spectrometer (EDS) detector. An X-ray photoelectron spectrometer (PHI5000) was employed to collect X-ray photoelectron spectroscopy (XPS) spectra of the ALaLiTeO6:Yb3+,Tm3+ samples so as to determine their composition and elemental valence states. Raman spectroscopy was performed using a laser Raman spectrometer (WITEC 300) with a laser wavelength of 532 nm. In the measurement, the power was set at 3.5 mW in order to minimize the heat effect of the laser.A power tunable 980 nm laser was selected as the UC luminescence excitation source, and an Edinburgh FS5 fluorescence spectrometer was used to test the photoluminescence spectra (PL), and temperature-dependent luminescence spectra. The test was repeated more than three times in an effort to ensure the accuracy of the data. The spectral step of the PL spectra was set as 1.0 nm, and the slit width of the monochromator was set as 0.3 nm. Temperature-dependent PL spectra spanning from 303 to 693 K were obtained through a temperature-controlled platform (INSTEC, MK2000 and HCP621G-CUV1) integrated with an FS5 fluorescence spectrometer. All measurements were conducted at room temperature, except the temperature dependent PL spectra.
3. Results and discussion
3.1 Crystal structure and phase identification
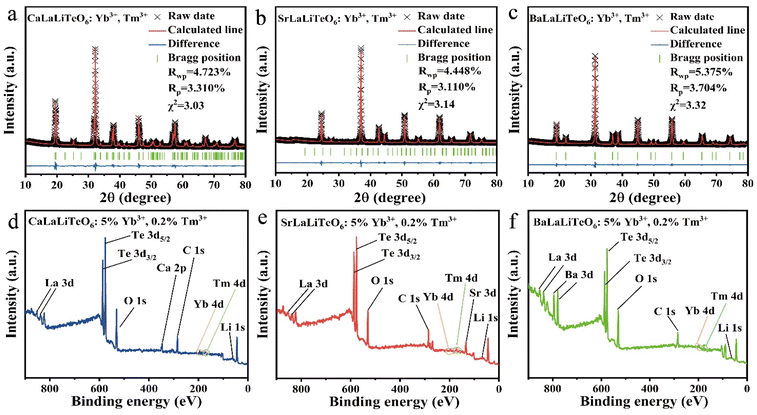
Previous studies have confirmed that CaLaLiTeO6 and SrLaLiTeO6 have monoclinic phases (P21/n), while BaLaLiO6 possesses a cubic phase structure (Fm![[3 with combining macron]](https://www.rsc.org/images/entities/char_0033_0304.gif) m). In this work, the measured XRD patterns of the synthesized non-doped and Yb3+, Tm3+ co-doped ALaLiTeO6 samples are shown in Fig. 1a. The XRD diffraction patterns of ALaLiTeO6:5%Yb3+,0.2%Tm3+ are consistent with those of the corresponding standard CIF cards, indicating that the co-doping with Yb3+ and Tm3+ does not cause serious structural distortions in the double-perovskite.
m). In this work, the measured XRD patterns of the synthesized non-doped and Yb3+, Tm3+ co-doped ALaLiTeO6 samples are shown in Fig. 1a. The XRD diffraction patterns of ALaLiTeO6:5%Yb3+,0.2%Tm3+ are consistent with those of the corresponding standard CIF cards, indicating that the co-doping with Yb3+ and Tm3+ does not cause serious structural distortions in the double-perovskite.
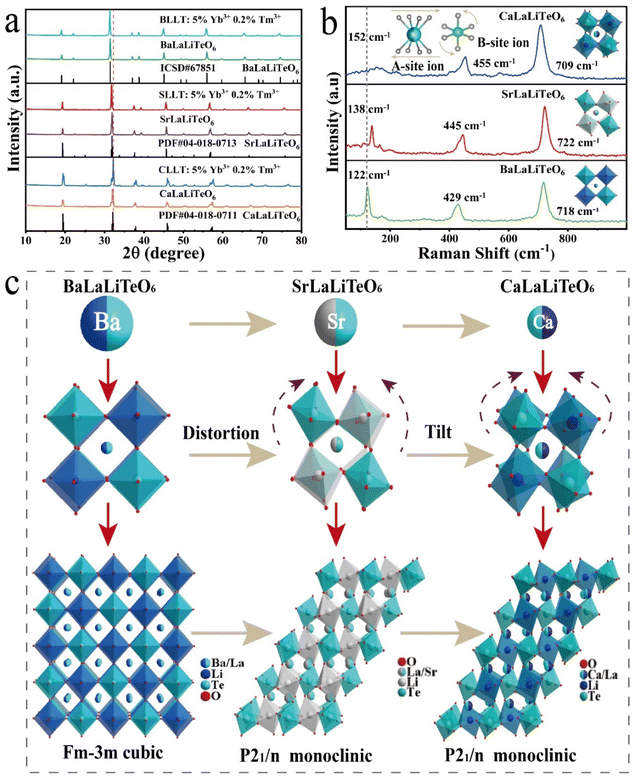 | ||
| Fig. 1 (a) XRD patterns of the non-doped and 5% Yb3+, 0.2% Tm3+ co-doped ALaLiTeO6 (A = Ca, Sr and Ba). (b) Raman spectra and (c) crystal structure of ALaLiTeO6 (A = Ca, Sr and Ba). | ||
In order to further validate the crystal structure of ALaLiTeO6:5%Yb3+,0.2%Tm3+ (A = Ca, Sr, and Ba), we respectively utilized standard structures of PDF # 04-018-0711, PDF # 04-018-0713, and ICSD # 67851 as the initial data to conduct Rietveld structure refinement of ALaLiTeO6:5%Yb3+,0.2%Tm3+ (A = Ca, Sr, and Ba) using the GSAS II program. As shown in Fig. 2a and Table S1–S3,† the refinement results showed that all samples’ data were well fitted, and they all converge to low reliability factors, indicating good consistency between the experimental data and the standard structure. Due to the substitution of Ba2+, Sr2+, and Ca2+ in the A-site, ALaLiTeO6 undergoes a phase transformation from BaLaLiO6 with a cubic phase (Fm![[3 with combining macron]](https://www.rsc.org/images/entities/char_0033_0304.gif) m) to CaLaLiTeO6 and SrLaLiTeO6 with a monoclinic phase (P21/n). Accompanied by structural phase transformation, the cell volumes of BaLaLiTeO6 (5% Yb3+,0.2% Tm3+), SrLaLiTeO6 (5% Yb3+, 0.2% Tm3+), and CaLaLiTeO6 (5% Yb3+, 0.2% Tm3+) gradually shrink from 526.272 Å3 to 251.83 Å3 and 245.884 Å.3
m) to CaLaLiTeO6 and SrLaLiTeO6 with a monoclinic phase (P21/n). Accompanied by structural phase transformation, the cell volumes of BaLaLiTeO6 (5% Yb3+,0.2% Tm3+), SrLaLiTeO6 (5% Yb3+, 0.2% Tm3+), and CaLaLiTeO6 (5% Yb3+, 0.2% Tm3+) gradually shrink from 526.272 Å3 to 251.83 Å3 and 245.884 Å.3
In order to probe into the possible lattice occupation of Yb3+ and Tm3+ in ALaLiTeO6, we calculated the radius differences induced by substitutions of (Yb3+,Tm3+) → La3+ and (Yb3+,Tm3+) → A(Ca2+, Sr2+, Ba2+) using the following formula:36–38
 | (1) |
As shown in Fig. 1c, the skeleton structure of ALaLiTeO6 is composed of alternating and co-angular B(B′) octahedron [TeO6] and [LiO6], while the A(A′) site ions with coordination number of CN = 8 are filled in the gaps between the alternating octahedra to balance the entire charge and maintain structural stability. Due to different radii of alkali metal ions occupying the A(A′) sites, the distortion and tilt of the octahedra of [TeO6] and [LiO6] will degrade the structural symmetry from the Fm![[3 with combining macron]](https://www.rsc.org/images/entities/char_0033_0304.gif) m cubic phase to the P21/n monoclinic phase. The distortion of the perovskite depends on the size and interaction of the A-site cation and the corner-sharing B(B′)O6 octahedra. The Goldschmidt tolerance factor (σ) is a reliable empirical index to analyze the size mismatch between the A-site cation and the [B(B′)O6] octahedra, which can be calculated using the following expression:30
m cubic phase to the P21/n monoclinic phase. The distortion of the perovskite depends on the size and interaction of the A-site cation and the corner-sharing B(B′)O6 octahedra. The Goldschmidt tolerance factor (σ) is a reliable empirical index to analyze the size mismatch between the A-site cation and the [B(B′)O6] octahedra, which can be calculated using the following expression:30
 | (2) |
Raman peaks are caused by lattice vibrations, and the Raman peak position and intensity represent the distribution of phonon energy. Raman spectroscopy can analyze changes in the vibration mode and further identify the effect of A-position substitution on phonon energy. Fig. 1b shows the measured Raman spectra of ALaLiTeO6 at λex = 532 nm. With the replacement of Ca2+, Sr2+, and Ba2+ cations, the Raman intensity located at 100–230 cm−1 corresponding to the translation vibration of the A position cations is red-shifted and its peak intensity increases. The Raman peaks located at 400–470 cm−1 corresponding to the flexion vibration of the B-site cationic oxygen octahedron are also blue-shifted. The strong mode centered at 700–730 cm−1 corresponds to symmetric stretching vibrations of the lattice.32–34 ALaLiTeO6 has strong Raman peaks at 100–230 cm−1, 400–470 cm−1 and 700–730 cm−1, and the substitution of A-site ions induces a great influence on the position and intensity of Raman peaks, that is, on phonon energy.
The SEM images of the synthesized ALaLiTeO6:5%Yb3+,0.2%Tm3+ samples are illustrated in Fig. S2.† The morphology of the samples exhibits an irregular polyhedral shape, with grain sizes ranging from several micrometers to hundreds of nanometers. EDS measurements indicate that Ca, Sr, Ba, La, Te, O, Yb, and Tm elements were evenly distributed in the phosphor particles. Element lithium has a low atomic number, which is beyond the detection range, so it could not be detected. However, the subsequent XPS testing proves that lithium had been doped into ALaLiTeO6. The measured XPS spectra of ALaLiTeO6:5%Yb3+,0.2%Tm3+ samples are shown in Fig. 2. All elements in the experimental synthesis were detected in the XPS spectra, including Ca2+, Sr2+, Ba2+, La3+, Li+, Te6+, O2−, Yb3+, and Tm3+. The Te-3d core spectra assigned Te-3d5/2 and Te-3d3/2 peaks at 575 and 586 eV are characteristics of Te6+ and hence, imply the complete oxidation of the Te ion in the matrix. In short, the above results indicate that we have successfully synthesized the samples ALaLiTeO6:5%Yb3+,0.2%Tm3+.
3.2 Up-conversion luminescence properties and mechanism of ALaLiTeO6:Yb3+,Tm3+
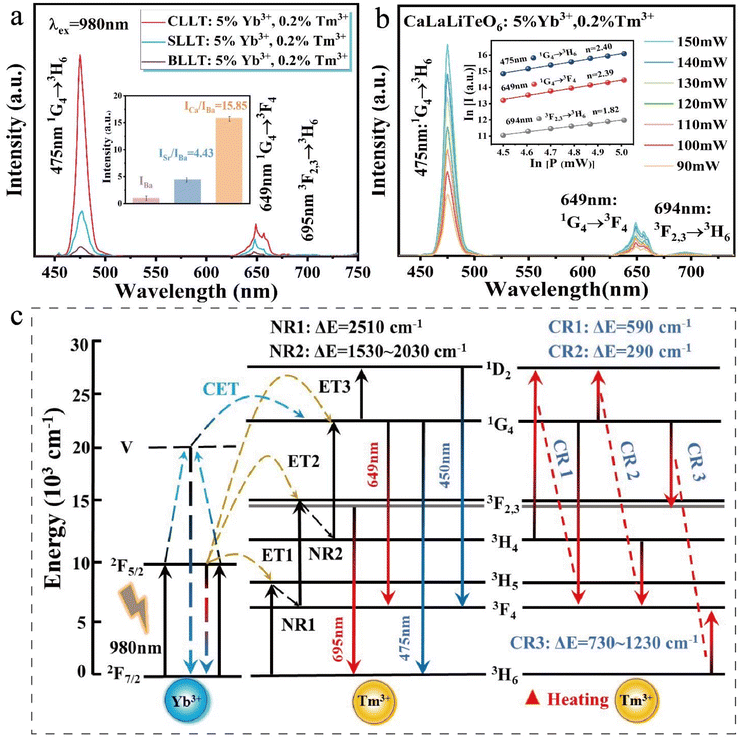
As shown in Fig. S3,† the optimal doping concentration of CaLaLiTeO6 is determined to be 5%Yb3+ and0.2%Tm3+. The PL spectra of ALaLiTeO6:5%Yb3+,0.2%Tm3+ are shown in Fig. 3a. Under excitation of a 980 nm laser, all samples demonstrate the same characteristic emission peaks of Tm3+ ions (475 nm: 1G4 → 3H6; 649 nm: 1G4 → 3F4; 694 nm: 3F2,3 → 3H6).39,40 It is worth noting that, as shown in Fig. 3c and Fig. S4,† the cooperative energy transfer (CET) mechanism exists in the ALaLiTeO6 (A = Ca, Sr, and Ba) samples with single-doped Yb3+ ions and double-doped Yb3+, Tm3+ ions. Two Yb3+ ions in the ground state 2F7/2 are simultaneously excited to the 2F5/2 level after absorbing two 980 nm photons. In the excitation energy level, part of Yb3+ ions further increase to the virtual energy level, and then transition from the virtual energy level to the ground state energy level 2F7/2 and emit light at 475 nm. The Tm3+ ions in the 3H6 low level can be directly excited to the 1G4 level after receiving the energy transferred from the Yb3+ ions in the virtual energy level.41,42 Another part of Yb3+ ions at the excitation energy level 2F5/2 can undergo an energy transfer process with Tm3+. Under 980 nm excitation, Yb3+ ions undergo a transition of 2F7/2 + hv (980 nm) → 2F5/2, followed by an energy transfer (ET) process ET1 and resulting in Tm3+ ions to be excited from the 3H6 level to the 3H5 level. Next, with the completion of the non-radiative (NR) transition process from the 3H5 level to the 3F4 level (ΔE ≈ 2500 cm−1), the ET2 process will occur: 3F4(Tm3+) + 2F5/2(Yb3+) → 3F2,3(Tm3+) + 2F7/2 (Yb3+), the two-photon transition from 3F2,3 → 3H6 results in the emission of deep red (694 nm) emissions. Finally, accompanied by the completion of the 3F2,3 → 3H4 NR transition process (ΔE ≈ 1530–2030 cm−1), the ET3 process occurred: 3H4 (Tm3+) + 2F5/2(Yb3+) → 1G4(Tm3+) + 2F7/2 (Yb3+). Strong blue (475 nm) and red (649 nm) emissions can be achieved by the three-photon transitions of 1G4 → 3H6 and 1G4 → 3F4, respectively. Remarkably, there is also a four-photon process taking place: 1G4(Tm3+) + 2F5/2(Yb3+) → 1D2(Tm3+) + 2F7/2 (Yb3+), the 1D2 → 3F4 transition process results in a weak blue light (450 nm) emission.40,43–45In order to elucidate the UC luminescence mechanism of Yb3+ and Tm3+ co-doped ALaLiTeO6 phosphors, the UC emission spectra of ALaLiTeO6:5%Yb3+,0.2% Tm3+ phosphors were measured at different laser pump powers. The relationship between UC luminescence intensity (I) and laser power (P) from the excitation source can be fitted through the following equation:43
| I∝Pn | (3) |
As demonstrated in Fig. 3a, it is worth noting that the emission intensity of ALaLiTeO6:5%Yb3+,0.2%Tm3+ exhibits significant changes with different types of A-site occupying ions. Specifically speaking, the emission intensity of CaLaLiTeO6:5%Yb3+, 0.2% Tm3+ is 15.85 times stronger than that of BaLaLiTeO6:5%Yb3+,0.2%Tm3+. Therefore, in the Yb3+ and Tm3+ co-doped ALaLiTeO6 system, the size of the A-site cation has a significant impact on the photoluminescence performance of the phosphor. However, the probability of a radiation transition from 3F2,3 to 3H6 occurring at room temperature is still very small, because the 694 nm intense red-light emission corresponding to this transition was observed to be weak in the measured emission spectrum. Based on the FT-IR and Raman spectroscopy test results shown in ESI Fig. S6,† the strongest cutoff band phonon frequencies generated by stretching vibration in the crystal are located at 650 cm−1 and 720 cm−1, respectively, indicating that the maximum phonon energy distribution in the crystal is in the range of 650–720 cm−1. At room temperature, Tm3+ ions tend to decay from level-3F2,3 to level-3H4 with the assistance of 2–3 phonons, as the non-radiative transition of 3F2,3 → 3H4 only need to span an energy interval of 1530–2030 cm−1. With the increase of temperature, the phonon-assisted cross relaxation process of Tm3+–Tm3+ gradually plays a dominant role in UC luminescence, and the transition probability of 3F2,3 → 3H6 gradually increases. This will be discussed further in section 3.4.
3.3 First principles calculations
In order to further explore the changes in the crystal structure and luminescence properties caused by the substitution of basic metals Ca, Sr and Ba in the ALaLiTeO6 system, we performed first-principles calculations of the system. All density functional theory (DFT) calculations for structure optimization energies, and band structures were implemented in the Cambridge Serial Total Energy Package (CASTEP) with the ultrasoft pseudopotentials (USPs). The generalized gradient approximation (GGA) using Perdew–Burke–Ernzerhof (PBE) functional was adopted to treat the exchange and correlation energy. The electronic band structures and density of states of the ALaLiTeO6 (A = Ca, Sr, and Ba) and the Yb, Tm-doped ALaLiTeO6:Yb,Tm (A = Ca, Sr, and Ba) were calculated by using the first-principles calculation based on density functional theory. The initial crystal configuration of ALaLiTeO6 (A = Ca, Sr, and Ba) was constructed according to the experimental results reported by M. L. Veiga et al.46 The 2 × 2 × 1 and 2 × 1 × 1 supercells of ALaLiTeO6 (A = Ca, Sr, and Ba) that have 80 atoms were constructed for the DFT calculation in this work. The plane-wave cutoff energy was set to 450 eV to ensure accuracy. An appropriate Monkhorst–Pack Brillouin sampling grid with a spacing of 2π × 0.04 A−1 was used for all structures. The convergence criterion of optimization for the total energy and force on the atoms, were 0.02 meV per atom and 0.05 eV Å−1.To examine the influence of ion doping on the electronic structure, the electronic band structure and the density-of-states of the ALaLiTeO6 (A = Ca, Sr, and Ba) matrix, Yb doped and Yb, Tm-doped ALaLiTeO6 (A = Ca, Sr, and Ba) were calculated based on density functional theory (DFT). As shown in Fig. 4 and Fig. S7,† the monoclinic structures CaLaLiTeO6 and SrLaLiTeO6 have indirect band gaps of 2.567 eV and 2.515 eV, respectively. After Yb ion doping, the sample changes from an indirect band gap to a direct band gap, and the band gap value decreases significantly, which is beneficial for the excitation of electrons. With co-doping Yb and Tm ions, the direct band gap decreases to 2.161 eV and 2.251 eV located in the Brillouin zone at the same G symmetry point in the region, it can be seen that the band gap change of CaLaLiTeO6 is the most obvious. Due to its minimum band gap value, it can be concluded that the transition of electrons from the valence band to the conduction band is more likely to occur, and in the best CaLaLiTeO6 system the luminous intensities confirm each other. The band gap change of the cubic structure BaLaLiTeO6 is different from that of the monoclinic structure, its direct band gap is 2.237 eV. With the doping of Yb and Tm ions, the sample still has a direct band gap (2.241 eV and 2.194 eV). In addition, we also tested the UV-Vis diffuse reflectance spectra of the samples, and calculated the band gap values corresponding to each sample using the Wood–Tauc (W–T) formula and the Kubelka–Munk (K–M) function, as shown in Fig. S8.† The band gap value calculated by the first-principles calculation is generally smaller than the band gap value calculated by the UV-visible diffuse reflection experiment, which is consistent with our results.
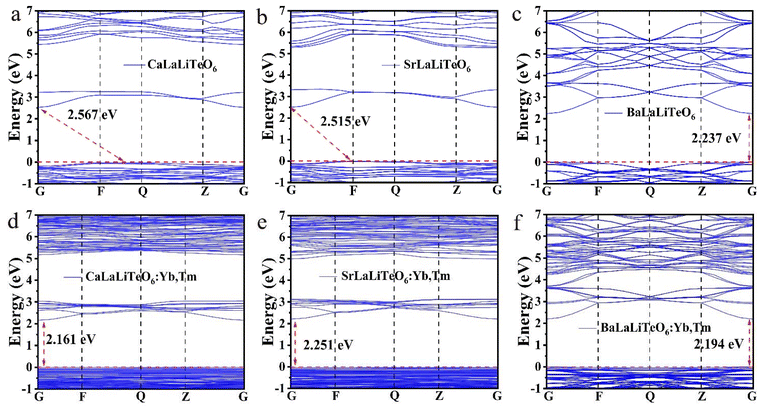 | ||
| Fig. 4 Calculated band structures of (a–c) ALaLiTeO6 and (d–f) ALaLiTeO6:Yb,Tm with (A = Ca, Sr, and Ba). | ||
To obtain further insight into changes in the electronic structure, we analyzed the density of states (DOS) of the ALaLiTeO6 (A = Ca, Sr and Ba), as shown in Fig. 5 and Fig. S7 and S9.† For the monoclinic CaLaLiTeO6, the s orbitals and p orbital show dominant contribution near the Fermi level, which is composed of Te-5s/Li-1s hybridized with O 2p orbitals.Te 5s states are completely empty lying 3 eV above the Fermi level in the conduction band, indicating that the electron density of the undoped sample is concentrated in the [TeO6] eight-coordinated dodecahedron, while the La-5d states are completely filled or empty. With the introduction of rare earth element Yb at the La site, the corresponding s/p/d orbital contribution does not change significantly, but the Yb 4f orbital appears at the Fermi level,47 and due to the relatively large absorption cross-section, introducing Yb and Tm ion can effectively improve the luminescence properties of the sample. The similar density of states characteristics also appears in SrLaLiTeO6:Yb and BaLaLiTeO6:Yb. After Yb and Tm co-doping in ALaLiTeO6, it can be observed that the valence band (VBM) of ALaLiTeO6:Yb,Tm is composed of the 4f state of Yb and Tm atoms and the 2p state of O atoms. The CBM moves slightly towards the Fermi level, and the main contribution state still comes from the Te-5s state and O 2p, Ca/Sr/Ba/La d states lie far above the Fermi level, which is consistent with the nominal Ca2+/Sr2+/Ba2+/La3+ valence state. It is noted that the intensity of the f electrons near the Fermi level significantly increases in the PDOS of CaLaLiTeO6:Yb,Tm and SrLaLiTeO6:Yb,Tm, while the contribution value of the 4f orbital in of the BaLaLiTeO6:Yb,Tm has not increased significantly. The calculation results are consistent with the experimental results that the luminescence intensity of ALaLiTeO6 (Ca, Sr and Ba): Yb, Tm gradually decreases with the change of substituted cations Ca, Sr, and Ba.
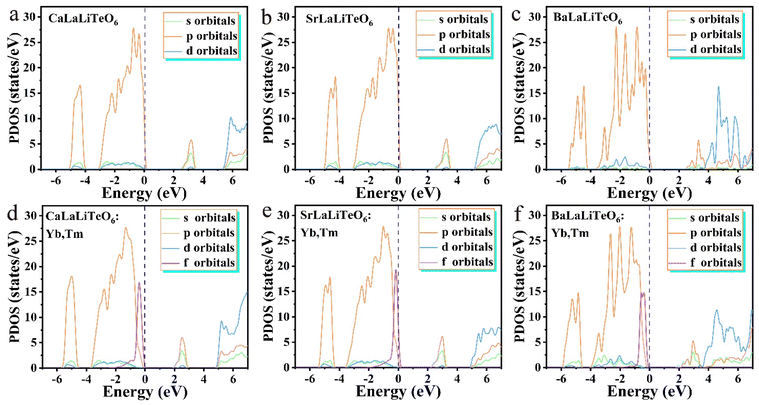 | ||
| Fig. 5 The PDOS, bonding and anti-bonding orbitals of (a–c) ALaLiTeO6 and (d–f) ALaLiTeO6:Yb,Tm with (A = Ca, Sr, and Ba). | ||
3.4 Temperature sensing properties of ALaLiTeO6:5%Yb3+,0.2%Tm3+
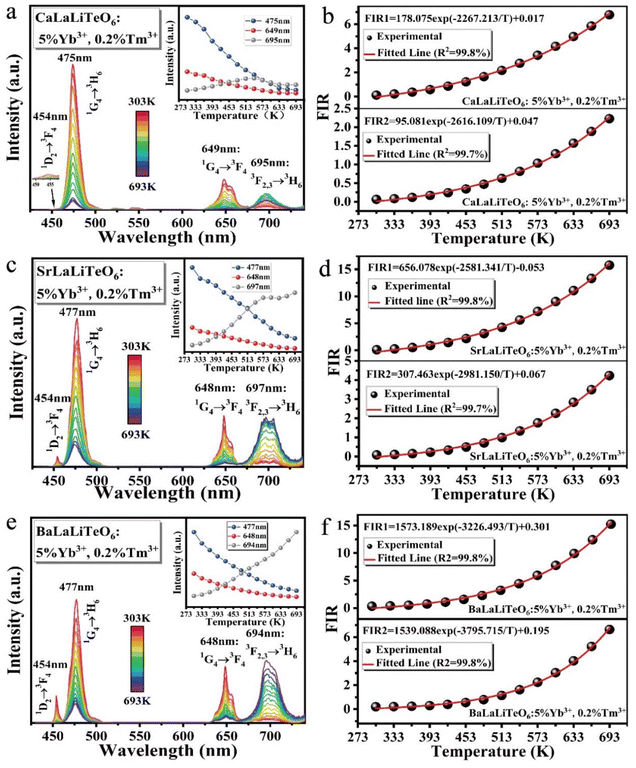
Under 980 nm excitation, the temperature-dependent spectra of ALaLiTeO6:5%Yb3+,0.2%Tm3+ (Ca, Sr and Ba) ranging from 303 to 693 K were measured and presented in Fig. 6(a, c and e). A series of emission peaks located at around 450, 475, 649 and 694 nm can be distinguished, which can be assigned to transitions of 1D2 → 3F4 (450 nm), 1G4 → 3H6 (475 nm), 1G4 → 3F4 (649 nm), 3F2,3 → 3H6(694 nm), respectively. However, the response of different radiation transition intensities to temperature changes exhibits different or even opposite trends. The emission intensity generated by 1D2 → 3F4 (455 nm), 1G4 → 3H6 and 1G4 → 3F4 (475 nm and 649 nm: CET from Yb3+ ions and ET from Yb3+ → Tm3+ ions) continue to decrease with the rising of temperature. In contrast, the emission intensity generated by 3F2,3 → 3H6 (694 nm: ET from Yb3+ → Tm3+ ions) increases with the temperature over a certain temperature range.Considering that the response of fluorescence intensity at 694 nm to temperature changes is completely different from the radiation at 475 nm and 649 nm, we use the fluorescence intensity ratios of FIR1 = I694/I649 and FIR2 = I694/I475 as dual-mode thermometry, respectively. The NTCL with an energy interval greater than 2000 cm−1, and its fluorescence intensity ratio changes with temperature, which does not conform to the Boltzmann distribution.48 From Table S5,† it can be seen that the energy gap difference of the emission energy levels of Tm3+ at 475 nm, 649 nm and 694 nm is about 6500cm−1, since they have a large energy gap difference, this is a non-thermally coupled level, it is difficult to fill them through thermal activation. According to previous reports,49 one knows that the relation between temperature and FIR values of emissions originating from nonthermally coupled levels can be expressed as:
 | (4) |
In order to facilitate the evaluation of the fluorescence thermal sensitivity characteristics of materials, two important parameters, absolute sensitivity (Sa) and relative sensitivity (Sr), are usually introduced to compare the temperature measurement accuracy between different thermometers. The calculation formulas for Sa and Sr are as follows:50,51
 | (5) |
 | (6) |
The calculated Sa and Sr values of the three UC phosphors in the two temperature measurement modes FIR1 and FIR2 are shown in Fig. 7.
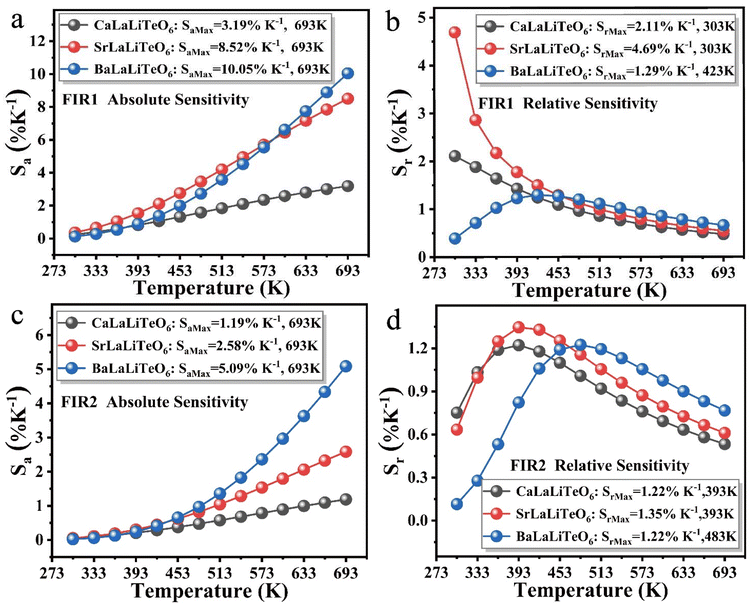 | ||
| Fig. 7 (a and b) The calculated Sa and Sr values of ALaLiTeO6:Yb3+,Tm3+ based on FIR1. (c and d) The calculated Sa and Sr values of ALaLiTeO6:Yb3+,Tm3+ based on FIR2. | ||
The crystal structure distortion of the matrix induced by the change in the ion radius of the A-site has a greater impact on the thermometry performance of the ALaLiTeO6:5%Yb3+,0.2%Tm3+ phosphor. As shown in Fig. 7a–d, the values of Sa continue to increase as the temperature rises. As the radius of the A-site ion in the matrix crystal ALaLiTeO6 increases, the slope of the increase in the Sa value with increasing temperature continuously increases. Therefore, in the BaLaLiTeO6:5%Yb3+,0.2%Tm3+ system, under the FIR1 temperature measurement mode, we calculated the maximum value of Sa to be 10.05% K−1 (693 K). In the FIR1 thermometry mode, the Sr of CaLaLiTeO6 and SrLaLiTeO6 phosphors decreases as the temperature increases. In the FIR2 thermometry mode, the Sr values of the three phosphors showed a trend of rising first and then falling as the temperature increased. The maximum Sr value of 4.69% K−1 (303 K) can be achieved with SrLaLiTeO6:5%Yb3+,0.2%Tm3+ in the FIR1 thermometry mode. ALaLiTeO6:Yb3+,Tm3+ (A = Ca, Sr, Ba) exhibits excellent thermometry sensitivity in both FIR1 and FIR2 temperature measurement modes. Moreover, the presence of two high sensitivity temperature measurement modes FIR1 and FIR2 can construct a self-calibrating thermometer, further improving the accuracy of temperature monitoring.
The origin of the high-sensitivity optical thermometry of ALaLiTeO6:5%Yb3+,0.2%Tm3+ is related to the significant difference in the response of the transition emission intensity of the three-photon process and the two-photon process to temperature changes. The emission intensities of 475, 649 and 694 nm are mostly determined by the collaborative action of two non-radiative transitions (NR1: 3H5 → 3F4 and NR2: 3H5 → 3F4) and three cross-relaxation processes (CR1: 3H4 + 1G4 → 1D2 + 3F4, CR2: 3H4 + 1G4 → 3F4 + 1D2, CR3: 3H6 + 1G4 → 3F4 + 3F2,3).45,52–54 However, it should be noted that the occurrence probability of these two non-radiative transition processes and three cross relaxation processes highly depends on the phonon energy of the matrix crystal. At room temperature, the UC luminescence is mainly affected by multi-phonon-assisted non-radiative transition processes of NR1 and NR2, while the cross-relaxation process probably has little effect on the up-conversion luminescence process. As the temperature increases, the three cross-relaxation (CR1, CR2 and CR3) processes may readily take place with phonon-assistance due to a small energy mismatch (about 590 cm−1 for CR1, 290 cm−1 for CR2 and 730–1230 cm−1 for CR3). Coincidentally, by replacing A-site ions in the matrix crystal of ALaLiTeO6, we effectively regulate the phonon energy, which can better match the energy difference in the Tm3+–Tm3+ cross relaxation process, thereby enhancing the occurrence of the three cross relaxation processes of CR1, CR2 and CR3. In the ALaLiTeO6:5%Yb3+,0.2%Tm3+ system, the increase of temperature will further intensify the lattice vibration of the matrix, and thus enhance the Tm3+–Tm3+ phonon-assisted cross relaxation process.
As shown in Fig. 3c, the enhancement of the three phonon-assisted cross relaxation processes CR1, CR2 and CR3 will reduce the population of particles in the 1G4 level, thereby weakening the transition emission intensity of the three-photon process (475 nm and 649 nm). In contrast, the enhancement of the CR3 cross relaxation process can directly increase the population of particles in 3F2,3 level, thereby strengthening the emission intensity of the two-photon process (694 nm).
On this basis, we compared the thermometry performances of ALaLiTeO6:5%Yb3+,0.2%Tm3+ with other published Yb3+ and Tm3+ co-doped phosphors, as shown in Table S6† and Fig. 8. For the Yb–Tm co-doped system, the fluorescence intensity ratios of 694 nm/649 nm, 694 nm/475 nm, and 694 nm/800 nm were mainly selected as optical temperature measurement energy level pairs. And among them, the optical temperature measurement method based on FIR = 694 nm/649 nm normally exhibits a large Sa but a small Sr value. While the optical thermometers constructed by FIR = 694 nm/475 nm and FIR = 694 nm/800 nm usually demonstrate a large Sr but a small Sa value. It is worth noting that in this work, the optical thermometers constructed based on FIR = 694 nm/649 nm in ALaLiTeO6:5%Yb3+,0.2%Tm3+ phosphors exhibit significant Sa and Sr values simultaneously. In particular, as the core metric of optical thermometry, the obtained maximum Sr value is much higher than previously reported results. It can be foreseen that Yb3+ and Tm3+ co-doped ALaLiTeO6 phosphors have broad prospects in temperature detection.
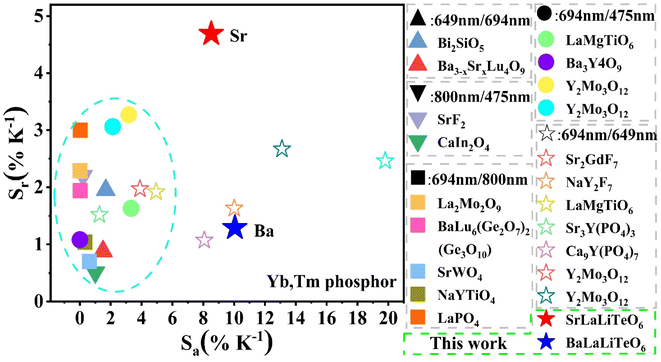 | ||
| Fig. 8 Comparison of thermometry sensitivity between ALaLiTeO6:5%Yb3+,0.2%Tm3+ and other Yb3+ and Tm3+ co-doped phosphors. | ||
3.5. Repeatability and stability of optical thermometry
A good optical thermometer not only possesses high sensitivity, but also has good stability and repeatability. In order to evaluate the thermometry repeatability, ten-cycle temperature measurements in the range of 303–603 K were carried out in both FIR1 and FIR2 thermometry modes, and the results are shown in Fig. S10.† Repeatability (R) can be defined as:55 | (7) |
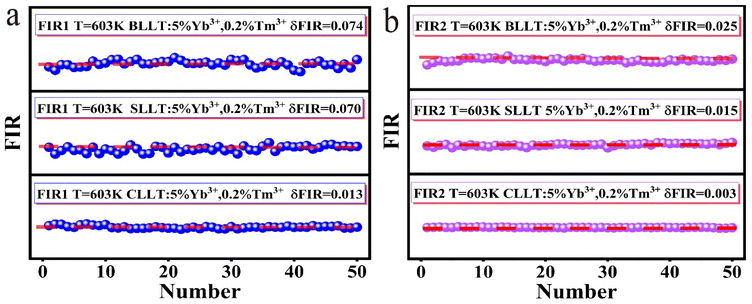
In addition, we continuously measured the FIR spectra of ALaLiTeO6:5%Yb3+,0.2%Tm3+ in two optical thermometry modes 50 times at an ambient temperature of 603 K, and the measurement results are shown in Fig. 9a and b. On this basis, we calculated the temperature uncertainty (δT) using the following formula:56
 | (8) |
4. Conclusions
We successfully prepared a type of UC phosphor of ALaLiTeO6:5%Yb3+,0.2%Tm3+ (A = Ca, Sr, and Ba) through a high-temperature solid-state reaction. Based on first principles calculations and combined with XRD and Raman spectroscopy measurements, it has been confirmed that replacing the A-site ions in ALaLiTeO6:5%Yb3+,0.2%Tm3+ phosphors with Ca2+, Sr2+ and Ba2+ can effectively regulate the phonon energy of the matrix crystal. The measurement results of temperature-dependent UC emission spectra demonstrate that there is a significant difference in the responses of three photon UC emission (649 and 475 nm) and two-photon UC emission (694 nm) to temperature changes. Therefore, a dual-mode thermometer based on FIR1 = I694/I649 and FIR2 = I694/I475 was constructed. The maximum Sr = 4.69% K−1 (303 K) is achieved in SrLaLiTeO6, while the maximum Sa = 10.05% K−1 (693 K) is obtained in BaLaLiTeO6. The origin of high-sensitivity optical thermometry is related to the phonon-assisted cross-relaxation channels of CR1, CR2, and CR3 exhibiting varying degrees of responses to temperature changes. With temperature increases, involving appropriate phonon cooperation, the collaborative action of two non-radiative transitions and three cross-relaxation processes can degrade the emission intensity at 475 nm, but enhance the emission intensity at 694 nm, thus effectively improving the thermometry sensitivity. In addition, the low δT value and high R value indicate that the ALaLiTeO6:5%Yb3+,0.2%Tm3+ phosphors have excellent thermometry stability and repeatability. Our results not only help construct a highly sensitive optical thermometer, but also provide new insights for exploring ultra-sensitive optical temperature sensors.Conflicts of interest
There are no conflicts to declare.Acknowledgements
Financial support from the Key Projects of the Joint Fund for Regional Innovation and Development of the National Natural Science Foundation of China (No. U22A20123), the National Natural Science Foundation of China (Grant's No. 51972181), the Natural Science Foundation of Shandong Province (ZR2021MA008), the High Quality Course Construction Project of Graduate Education in Shandong Province (SDYKC18051) and the Postgraduate Tutor Ability Improvement Project of Shandong Province (SDYY17179) is gratefully acknowledged.References
- G. Li, X. Chen, M. Wang, S. Cheng, D. Yang, D. Wu, Y. Han, M. Jia, X. Li, Y. Zhang, C. Shan and Z. Shi, Regulating Exciton De–Trapping of Te4+–Doped Zero–Dimensional Scandium–Halide Perovskite for Fluorescence Thermometry with Record High Time–Resolved Thermal Sensitivity, Adv. Mater., 2023, 35, 2305495 CrossRef CAS PubMed.
- K. Wu, E. Wang, J. Yuan, J. Zuo, D. Zhou, H. Zhao, Y. Luo, L. Zhang, B. Li, J. Zhang, L. Tu and H. Zhang, Cross Relaxation Channel Tailored Temperature Response in Er3+–rich Upconversion Nanophosphor, Angew. Chem., Int. Ed., 2023, 62, e202306585 CrossRef CAS PubMed.
- H. Suo, D. Guo, P. Zhao, X. Zhang, Y. Wang, W. Zheng, P. Li, T. Yin, L. Guan, Z. Wang and F. Wang, Ultrasensitive Colorimetric Luminescence Thermometry by Progressive Phase Transition, Adv. Sci., 2024, 11, 2305241 CrossRef CAS PubMed.
- W. Xu, X. Gao, L. Zheng, Z. Zhang and W. Cao, An optical temperature sensor based on the upconversion luminescence from Tm3+/Yb3+ codoped oxyfluoride glass ceramic, Sens. Actuators, B, 2012, 173, 250–253 CrossRef CAS.
- X. X. Guo, J. H. Wei, J. B. Luo, Z. L. He, Z. Z. Zhang, J. H. Chen and D. B. Kuang, All Inorganic Sb3+–Ln3+–Codoped Cs2NaYCl6 for Highly Efficient Single–Source White–Light Emission and Ratiometric Optical Thermometer Applications, Adv. Opt. Mater., 2023, 2301914, DOI:10.1002/adom.202301914.
- Z. Fan, X. Fan, J. Xue and Y. Wang, Designing dual mode of non-contact optical thermometers in double perovskite Ca2LaTaO6:Bi3+, Eu3+ phosphors, Mater. Today Chem., 2023, 30, 101528 CrossRef CAS.
- Z. Zeng, B. Huang, X. Wang, L. Lu, Q. Lu, M. Sun, T. Wu, T. Ma, J. Xu, Y. Xu, S. Wang, Y. Du and C. H. Yan, Multimodal Luminescent Yb3+/Er3+/Bi3+–Doped Perovskite Single Crystals for X–ray Detection and Anti–Counterfeiting, Adv. Mater., 2020, 32, 2004506 CrossRef CAS PubMed.
- Y. Wang, P. Dang, L. Qiu, G. Zhang, D. Liu, Y. Wei, H. Lian, G. Li, Z. Cheng and J. Lin, Multimode Luminescence Tailoring and Improvement of Cs2NaHoCl6 Cryolite Crystals via Sb3+/Yb3+ Alloying for Versatile Photoelectric Applications, Angew. Chem., Int. Ed., 2023, 62, 202311699 CrossRef PubMed.
- H. Suo, X. Zhao, Z. Zhang, Y. Wang, J. Sun, M. Jin and C. Guo, Rational Design of Ratiometric Luminescence Thermometry Based on Thermally Coupled Levels for Bioapplications, Laser Photonics Rev., 2020, 15, 2000319 CrossRef.
- Y. Jiang, Y. Tong, S. Chen, W. Zhang, F. Hu, R. Wei and H. Guo, A three-mode self-referenced optical thermometry based on up-conversion luminescence of Ca2MgWO6:Er3+,Yb3+ phosphors, Chem. Eng. J., 2021, 413, 127470 CrossRef CAS.
- H. Lv, P. Du, W. Li and L. Luo, Tailoring of Upconversion Emission in Tm3+/Yb3+-Codoped Y2Mo3O12 Submicron Particles Via Thermal Stimulation Engineering for Non-invasive Thermometry, ACS Sustainable Chem. Eng., 2022, 10, 2450–2460 CrossRef CAS.
- C. Wang, H. Zhang, Y. Cai, Q. Wang, B. Zhou, X. Xu and X. Yu, Phonon–Assisted Negative Thermal Quenching in a One–Photon Up–Conversion Phosphor for Thermometry, Laser Photonics Rev., 2023, 17, 2300499 CrossRef CAS.
- K. Zhu, H. Xu, Z. Wang and Z. Fu, Lanthanide-doped lead-free double perovskite La2MgTiO6 as ultra-bright multicolour LEDs and novel self-calibrating partition optical thermometer, Inorg. Chem. Front., 2023, 3383–3395, 10.1039/d3qi00529a.
- Q. Zhang, G. Li, G. Li, D. Liu, P. Dang, L. Qiu, H. Lian, M. S. Molokeev and J. Lin, Optical Thermometer Based on Efficient Near–Infrared Dual–Emission of Cr3+ and Ni2+ in Magnetoplumbite Structure, Adv. Opt. Mater., 2023, 2301429, DOI:10.1002/adom.202301429.
- A. Kabański, M. Ptak and D. Stefańska, Metal–Organic Framework Optical Thermometer Based on Cr3+ Ion Luminescence, ACS Appl. Mater. Interfaces, 2023, 15, 7074–7082 CrossRef PubMed.
- D.-H. Chen, R. Haldar and C. Wöll, Stacking Lanthanide-MOF Thin Films to Yield Highly Sensitive Optical Thermometers, ACS Appl. Mater. Interfaces, 2023, 15, 19665–19671 CrossRef CAS PubMed.
- Z. Lei, R. Liu, L. Sun, X. Wang, C. Hu, Y. Zou, X. Yang, S. Su, B. Teng, H. Xu and D. Zhong, An up-conversion Ba3In(PO4)3:Er3+/Yb3+ phosphor that enables multi-mode temperature measurements and wide-gamut ‘temperature mapping’, Dalton Trans., 2023, 52, 10155–10164 RSC.
- Z. Lei, H. Dong, L. Sun, B. Teng, Y. Zou and D. Zhong, Eulytite-type Ba3Yb(PO4)3:Tm/Er/Ho as a high sensitivity optical thermometer over a broad temperature range, J. Mater. Chem. C, 2024, 12, 628–638 RSC.
- Y. Zhuang, D. Chen, W. Chen, W. Zhang, X. Su, R. Deng, Z. An, H. Chen and R.-J. Xie, X-ray-charged bright persistent luminescence in NaYF4:Ln3+@NaYF4 nanoparticles for multidimensional optical information storage, Light: Sci. Appl., 2021, 10, 8670 Search PubMed.
- G. S. Yi and G. M. Chow, Synthesis of Hexagonal–Phase NaYF4:Yb,Er and NaYF4:Yb,Tm Nanocrystals with Efficient Up–Conversion Fluorescence, Adv. Funct. Mater., 2006, 16, 2324–2329 CrossRef CAS.
- G. Xiang, J. Zhang, Z. Hao, X. Zhang, G.-H. Pan, L. Chen, Y. Luo, S. Lü and H. Zhao, Solvothermal synthesis and upconversion properties of about 10 nm orthorhombic LuF3: Yb3+, Er3+ rectangular nanocrystals, J. Colloid Interface Sci., 2015, 459, 224–229 CrossRef CAS PubMed.
- W. Zhang and H. J. Seo, Luminescence and structure of a novel red-emitting phosphor Eu3+-doped tellurate garnet Li3Y3Te2O12, J. Alloys Compd., 2013, 553, 183–187 CrossRef CAS.
- E.-J. Popovici, M. Nazarov, L. Muresan, D. Y. Noh, L. B. Tudoran, E. Bica and E. Indrea, Synthesis and characterisation of terbium activated yttrium tantalate phosphor, J. Alloys Compd., 2010, 497, 201–209 CrossRef CAS.
- J. Liang, S. Zhao, X. Yuan and Z. Li, A novel double perovskite tellurate Eu3+-doped Sr2MgTeO6 red-emitting phosphor with high thermal stability, Opt. Laser Technol., 2018, 101, 451–456 CrossRef CAS.
- H. Li, H. K. Yang, B. K. Moon, B. C. Choi, J. H. Jeong, K. Jang, H. S. Lee and S. S. Yi, Crystal Structure, Electronic Structure, and Optical and Photoluminescence Properties of Eu(III) Ion-Doped Lu6Mo(W)O12, Inorg. Chem., 2011, 50, 12522–12530 CrossRef CAS PubMed.
- G. Ahmad, M. B. Dickerson, B. C. Church, Y. Cai, S. E. Jones, R. R. Naik, J. S. King, C. J. Summers, N. Kröger and K. H. Sandhage, Rapid, Room–Temperature Formation of Crystalline Calcium Molybdate Phosphor Microparticles via Peptide–Induced Precipitation, Adv. Mater., 2006, 18, 1759–1763 CrossRef CAS.
- Z. Li, X. Ding, H. Cong, S. Wang, B. Yu and Y. Shen, Recent advances on inorganic lanthanide-doped NIR-II fluorescence nanoprobes for bioapplication, J. Lumin., 2020, 228, 117627 CrossRef CAS.
- S. Su, C. Hu, S. Ding, Y. Sun, L. Sun, Y. Zou, R. Liu, Z. Lei, B. Teng and D. Zhong, Achieving Broadband NIR Emission in Fe3+–Activated ALaBB′O6 (A = Ba, Sr, Ca; B–B′ = Li–Te, Mg–Sb) Phosphors via Multi–Site Ionic Co–Substitutions, Adv. Opt. Mater., 2023, 2302383, DOI:10.1002/adom.202302383.
- J. Huang, P. Jiang, Z. Cheng, J. Qin, R. Cong and T. Yang, Equivalent chemical substitution in double–double perovskite-type ALaLiTeO6:Mn4+ (A = Ba2+, Sr2+, Ca2+) phosphors enabling wide range crystal field strength regulation and efficient far-red emission, Dalton Trans., 2023, 52, 3458–3471 RSC.
- S. Su, J. Ma, C. Hu, J. Zhao, R. Liu, H. Dong, L. Sun, Y. Zou, Z. Lei, B. Teng and D. Zhong, An efficient double-perovskite CaLaLiTeO6:Mn4+ far-red phosphor towards indoor plant lighting application, J. Alloys Compd., 2023, 946, 169436 CrossRef CAS.
- R. Phatak, S. K. Gupta, K. Krishnan, S. K. Sali, S. V. Godbole and A. Das, Crystallographic site swapping of La3+ion in BaA′LaTeO6(A′ = Na, K, Rb) double perovskite type compounds: diffraction and photoluminescence evidence for the site swapping, Dalton Trans., 2014, 43, 3306–3312 RSC.
- B. Amrithakrishnan and G. Subodh, Crystal structure and optical properties of B site-ordered ALaLiTeO6 (A = Ba, Sr) ceramics, Mater. Res. Bull., 2017, 93, 177–182 CrossRef CAS.
- S. C. Lal, J. I. Naseemabeevi and S. Ganesanpotti, Deep–red–emitting SrLaLiTeO6: Mn4+ double perovskites: Correlation between Mn4+–O2− bonding and photoluminescence, J. Am. Ceram. Soc., 2021, 104, 5293–5306 CrossRef CAS.
- J. S. Gong, W. B. Dai, J. Luo, K. Nie and M. Xu, Insights into structure, local site symmetry, and energy transfer for regulating luminescent properties of SrLaLiTeO6: Dy/Eu and its application in wLEDs, Ceram. Int., 2023, 49, 31024–31034 CrossRef CAS.
- J. Zhu, T. Yang, H. Li, Y. Xiang, R. Song and H. Zhang, Cationic composition engineering in double perovskite XLaLiTeO6:Eu3+(X = Ba, Sr, Ca, and Mg) toward efficient and thermally stable red luminescence for domestic white-LEDs, J. Mater. Chem. C, 2023, 11, 11017–11026 RSC.
- X. Huang, B. Li and H. Guo, Synthesis, photoluminescence, cathodoluminescence, and thermal properties of novel Tb3+-doped BiOCl green-emitting phosphors, J. Alloys Compd., 2017, 695, 2773–2780 CrossRef CAS.
- K. Li, H. Lian, M. Shang and J. Lin, A novel greenish yellow-orange red Ba3Y4O9:Bi3+,Eu3+ phosphor with efficient energy transfer for UV-LEDs, Dalton Trans., 2015, 44, 20542–20550 RSC.
- X. Ding, Y. Min, C. Wang and Q. Zhang, Near-Infrared Emission Material with Superlong Afterglow Performance and Its Multifunctional Applications, Inorg. Chem., 2023, 62, 1686–1696 CrossRef CAS PubMed.
- Y. Min, X. Ding, B. Yu, H. Cong and Y. Shen, Rare-earth doped hexagonal NaYbF4 nanoprobes with size-controlled and NIR-II emission for multifunctional applications, React. Chem. Eng., 2023, 8, 2258–2269 RSC.
- H. Dong, L.-D. Sun and C.-H. Yan, Energy transfer in lanthanide upconversion studies for extended optical applications, Chem. Soc. Rev., 2015, 44, 1608–1634 RSC.
- M. M. Upadhyay, K. Shwetabh and K. Kumar, Comparative studies of upconversion luminescence and optical temperature sensing in Tm3+/Yb3+ codoped LaVO4 and GdVO4 phosphors, RSC Adv., 2023, 13, 20674–20683 RSC.
- K. Shwetabh, A. Banerjee, R. Poddar and K. Kumar, PEG-coated NaYF4:Tm3+/Yb3+ upconversion nanoparticles for OCT image contrast enhancer, optical thermometry, and security applications, J. Alloys Compd., 2024, 980, 173493 CrossRef CAS.
- A. Yin, Y. Zhang, L. Sun and C. Yan, Colloidal synthesis and blue based multicolor upconversion emissions of size and composition controlled monodisperse hexagonal NaYF4:Yb,Tm nanocrystals, Nanoscale, 2010, 2, 953 RSC.
- H. Zhang, Y. Fan, P. Pei, C. Sun, L. Lu and F. Zhang, Tm3+–Sensitized NIR–II Fluorescent Nanocrystals for In Vivo Information Storage and Decoding, Angew. Chem., Int. Ed., 2019, 58, 10153–10157 CrossRef CAS PubMed.
- W. Wei, Y. Zhang, R. Chen, J. Goggi, N. Ren, L. Huang, K. K. Bhakoo, H. Sun and T. T. Y. Tan, Cross Relaxation Induced Pure Red Upconversion in Activator- and Sensitizer-Rich Lanthanide Nanoparticles, Chem. Mater., 2014, 26, 5183–5186 CrossRef CAS.
- M. L. López, I. Alvarez, M. Gaitán, A. Jerez, C. Pico and M. L. Veiga, Structural study and magnetic measurements of some perovskites MLnLiTeO6, Solid State Ionics, 1993, 63, 599–602 CrossRef.
- M. Rathaiah, P. Haritha, A. D. Lozano-Gorrín, P. Babu, C. K. Jayasankar, U. R. Rodríguez-Mendoza, V. Lavín and V. Venkatramu, Stokes and anti-Stokes luminescence in Tm3+/Yb3+-doped Lu3Ga5O12 nano-garnets: a study of multipolar interactions and energy transfer dynamics, Phys. Chem. Chem. Phys., 2016, 18, 14720–14729 RSC.
- N. Rakov, Tm3+,Yb3+: Y2SiO5 up-conversion phosphors: Exploration of temperature sensing performance by monitoring the luminescence emission, Phys. B, 2022, 628, 413572 CrossRef CAS.
- H. Yu, W. Su, L. Chen, D. Deng and S. Xu, Excellent temperature sensing characteristics of europium ions self-reduction Sr3P4O13 phosphors for ratiometric luminescence thermometer, J. Alloys Compd., 2019, 806, 833–840 CrossRef CAS.
- Z. Sun, Z. Fu, L. Ma, H. Cao, M. Wang, H. Cao and A. Zhang, Excellent multi-color emission and multi-mode optical ratiometric thermometer in (Ca, Tb, Eu, Sm)Nb2O6 phosphors based on wide O2−→Nb5+ CTB, Appl. Surf. Sci., 2022, 575, 151791 CrossRef CAS.
- P. Du, J. Tang, W. Li and L. Luo, Exploiting the diverse photoluminescence behaviors of NaLuF4:xEu3+ nanoparticles and g-C3N4 to realize versatile applications in white light-emitting diode and optical thermometer, Chem. Eng. J., 2021, 406, 127165 CrossRef CAS.
- Y. Zhang, S. Xu, X. Li, J. Sun, J. Zhang, H. Zheng, H. Zhong, R. Hua, H. Xia and B. Chen, Concentration quenching of blue upconversion luminescence in Tm3+/Yb3+ co-doped Gd2(WO4)3 phosphors under 980 and 808ánm excitation, J. Alloys Compd., 2017, 709, 147–157 CrossRef CAS.
- B. P. Kore, A. Kumar, R. E. Kroon, J. J. Terblans and H. C. Swart, Origin of visible and near IR upconversion in Yb3+-Tm3+-Er3+ doped BaMgF4 phosphor through energy transfer and cross-relaxation processes, Opt. Mater., 2020, 99, 109511 CrossRef CAS.
- X. F. Wang, X. H. Yan, C. X. Kan, K. L. Ma, Y. Xiao and S. G. Xiao, Enhancement of blue emission in β-NaYbF4:Tm3+/Nd3+ nanophosphors synthesized by nonclosed hydrothermal synthesis method, Appl. Phys. B: Lasers Opt., 2010, 101, 623–629 CrossRef CAS.
- C. D. S. Brites, S. Balabhadra and L. D. Carlos, Lanthanide–Based Thermometers: At the Cutting–Edge of Luminescence Thermometry, Adv. Opt. Mater., 2018, 7, 1801239 CrossRef.
- M. Jia, F. Lin, Z. Sun and Z. Fu, Novel excited-state nanothermometry combining the red-shift of charge-transfer bands and a thermal coupling effect, Inorg. Chem. Front., 2020, 7, 3932–3937 RSC.
Footnotes |
| † Electronic supplementary information (ESI) available. See DOI: https://doi.org/10.1039/d4qi00395k |
| ‡ These authors contributed equally to this work. |
| This journal is © the Partner Organisations 2024 |

