 Open Access Article
Creative Commons Attribution 3.0 Unported Licence
HPLC-FLD determination of aflatoxins M1 and M2 in raw cow milk samples using in-syringe gas-controlled density tunable solidification of a floating organic droplet-based dispersive liquid–liquid microextraction method†
Maede Rabiea,
Mohammadhosein Movassaghghazani *b and
Mohammad Reza Afshar Mogaddam
 cd
cd
aFaculty of Veterinary Medicine, Shabestar Branch, Islamic Azad University, Shabestar, Iran
bDepartment of Food Hygiene and Quality Control, Faculty of Veterinary Medicine, Shabestar Branch, Islamic Azad University, Shabestar, Iran. E-mail: mh.movassagh@iau.ac.ir; drmhmg@gmail.com; Tel: +98-9143010292
cFood and Drug Safety Research Center, Tabriz University of Medical Sciences, Tabriz, Iran
dPharmaceutical Analysis Research Center, Tabriz University of Medical Sciences, Tabriz, Iran
First published on 8th February 2024
Abstract
Herein, an in-syringe gas-controlled density tunable solidification of a floating organic droplet-based dispersive liquid–liquid microextraction method was employed for the extraction of aflatoxin M1 and M2 from cow milk samples prior to their quantification with high-performance liquid chromatography equipped with a fluorescence detector. In this method, after precipitating the proteins of the sample using a zinc sulfate solution, the supernatant phase was transferred into a barrel of a glass syringe, with the end closed with a septum containing a mixture of menthol, phenylacetic acid DES (as the extraction solvent), and chloroform (as a density modifier). After that, an inert gas was bubbled into the syringe. In this manner, chloroform was evaporated and fine droplets of extractant were released, which extracted the analytes during their passing. Finally, the syringe was placed in an ice bath and the obtained solidified drop was injected into the separation system after diluting with a mobile phase. Under the best analysis conditions, low limits of detection (1.45 and 1.86 ng L−1 for AFM1 and AFM2, respectively) and quantification (4.83 and 6.21 ng L−1 for AFM1 and AFM2, respectively), high extraction recovery (75 and 70% for AFM1 and AFM2, respectively), and good precision (relative standard deviations ≤ 4.8%) were obtained by employing the approach reported in this study. In the end, this method was successfully employed to determine AFM1 and AFM2 in raw cow milk samples collected from Tabriz, Iran.
1. Introduction
Aflatoxins (AFs) are toxic and carcinogenic substances that appear in foodstuffs due to the fungal growth of Aspergillus flavus and Aspergillus parasiticus species during their production, packaging, transportation, and storage.1 AFB1, AFB2, AFG1, AFG2, AFM1, and AFM2 are the six most important and toxic (the International Agency for Research on Cancer classified these AFs as group I carcinogens) members of these compounds.2 AFM1 and AFM2 are highly toxic AFs that are known as major derivatives of AFB1 and AFB2, respectively (after ingestion, AFB1 and AFB2 are hydroxylated and metabolized in the cow's liver and subsequently excreted in milk, urine, and meat).3 The intake of AFM1 and AFM2 through diet and their accumulation in the human body can lead to mental disorders, immunotoxicity, chronic toxicity, carcinogenic toxicity, and mutagenicity.4 Therefore, monitoring AFM1 and AFM2 in foodstuffs such as cow milk, which is nutrient-rich (containing various vitamins, carbohydrates, proteins, and minerals), and extensively utilized (especially highly consumed by infants and elderly people who are unable to digest solid food well) is of great importance.5–7 The European Union has established maximum residual limits (MRLs) for AFM1 in milk samples (50 ng kg−1) to guarantee their safety.8 However, up to now, no MRL has been set for AFM2 in milk. According to the literature, high-performance liquid chromatography (HPLC) with a fluorescence detector (FLD) and tandem mass spectrometry (MS/MS) are the most commonly employed analytical instruments for the determination of AFs such as AFM1 and AFM2 in various samples.9,10 It should be mentioned that FLD is preferred due to its low cost in comparison with HPLC-MS/MS. Commonly, because of the complex matrices of food samples, e.g., milk samples (the presence of high percentages of proteins and fatty acids can restrict the extraction of analytes) and low concentration of analyte residues in them, an efficient sample preparation process before their instrumental analysis is required.11 Liquid–liquid extraction (LLE) is a traditional method for the extraction of analytes into the appropriate organic solvent.12 To overcome the problems of LLE (consuming high volumes of toxic organic solvents and being tedious), researchers are looking for alternative methods; as a result of these efforts, liquid phase microextraction (LPME) based methods are being introduced.13 Solidification of floating organic droplet-based dispersive liquid–liquid microextraction (SFOD-DLLME) is the well-known and efficient model of LPME.14 In this method, initially, a mixture of extraction (with low melting point and lower density compared to water) and dispersive solvents is injected into the sample solution and placed in a test tube. Thus, the fine droplets of the extractant are formed and the analytes are extracted into them. The test tube is then placed in an ice bath to help accumulate and solidify the droplets.15 Subsequently, the droplet is transferred to a microtube using a spatula and allowed to melt. Considering the above procedure, SFOD-DLLME is faster (owing to the removal of the centrifuging process, which is a time-consuming step) and safer (because of using greener solvents, e.g. 1-undecanol instead of toxic halogenated solvents) than conventional DLLME.16,17 Generally, the ease of operation and providing high extraction recovery (ER) and enrichment factor (EF) are considered as the major advantages of SFOD-DLLME.18 In recent years, several SFOD-DLLME-based works have been reported using new generation of green solvents, e.g., deep eutectic solvents (DESs) and ionic liquids.19,20 DESs are prepared through a reaction between a hydrogen-bond donor (HBD) and a hydrogen-bond acceptor (HBA) at an elevated temperature.21 The melting point of the formed solvent is lower than that of its components.22The key aim of this research was to validate and apply an in-syringe gas-controlled density tunable SFOD-DLLME method for the efficient extraction of AFM1 and AFM2 from cow milk samples. The extracted analytes were determined using HPLC-FLD. Acceptable extraction times, high ERs, simplicity, and good repeatability are the chief merits of the offered method. According to our preliminary studies, this is the first report on the application of the offered approach for the extraction and quantification of AFM1 and AFM2 in raw cow milk samples.
2. Experimental
2.1. Materials and solutions
AFM1 and AFM2 standards were purchased from Sigma-Aldrich (St. Louis, MA, USA). Acetonitrile (ACN), HPLC-grade water, NaCl, menthol, phenylacetic acid, zinc sulfate, and choline chloride (ChCl) were purchased from Merck (Darmstadt, Germany). A stock solution of the AFs (at a concentration of 10 mg L−1 of each analyte) was prepared in ACN and utilized in the validation and optimization steps.2.2. Synthesis of DESs
DESs were prepared based on a previously published procedure.23 Therefore, in menthol![[thin space (1/6-em)]](https://www.rsc.org/images/entities/char_2009.gif) :
:![[thin space (1/6-em)]](https://www.rsc.org/images/entities/char_2009.gif) phenylacetic acid and ChCl
phenylacetic acid and ChCl![[thin space (1/6-em)]](https://www.rsc.org/images/entities/char_2009.gif) :
:![[thin space (1/6-em)]](https://www.rsc.org/images/entities/char_2009.gif) phenylacetic acid DESs, phenylacetic acid (as an HBD) was mixed with menthol and ChCl (as HBAs) at molar ratios of 1
phenylacetic acid DESs, phenylacetic acid (as an HBD) was mixed with menthol and ChCl (as HBAs) at molar ratios of 1![[thin space (1/6-em)]](https://www.rsc.org/images/entities/char_2009.gif) :
:![[thin space (1/6-em)]](https://www.rsc.org/images/entities/char_2009.gif) 3 and 1
3 and 1![[thin space (1/6-em)]](https://www.rsc.org/images/entities/char_2009.gif) :
:![[thin space (1/6-em)]](https://www.rsc.org/images/entities/char_2009.gif) 1 in two tubes. Subsequently, the tubes were heated in a water bath maintained at 60 °C for an hour.
1 in two tubes. Subsequently, the tubes were heated in a water bath maintained at 60 °C for an hour.
2.3. Raw cow milk samples
Twenty-one raw cow milk samples were obtained from local producers (Tabriz, East Azarbaijan Province, Iran). After primary studies, one of these samples that were free of AFs (this point was confirmed by a validated analytical method24) was taken and utilized as a blank. All the samples were maintained in a refrigerator at 4 °C before their analysis by the suggested method.2.4. Instruments
In this work, an Agilent Liquid Chromatograph (Model 1200) equipped with an FLD was utilized for the quantification of AFM1 and AFM2. A Luna C18 ODS (2) column (150 × 4.6 mm, 3 μm particle size) (Phenomenex, Torrance, CA, USA) maintained at 30 °C was employed to isolate AFM1 and AFM2. For separation of the analytes, an isocratic elution using ACN and water (25![[thin space (1/6-em)]](https://www.rsc.org/images/entities/char_2009.gif) :
:![[thin space (1/6-em)]](https://www.rsc.org/images/entities/char_2009.gif) 75, v/v) was used at a flow rate of 1 mL min−1 for 15 min. For FLD, 365 and 435 nm were set as the excitation and emission wavelengths, respectively. All injections were performed utilizing a 20 μL sample loop. A Labinco L46 vortex mixer (Breda, Netherlands) and a Hettich centrifuge model ROTOFIX 32A (Kirchlengern, Germany) were used for the preparation of the samples.
75, v/v) was used at a flow rate of 1 mL min−1 for 15 min. For FLD, 365 and 435 nm were set as the excitation and emission wavelengths, respectively. All injections were performed utilizing a 20 μL sample loop. A Labinco L46 vortex mixer (Breda, Netherlands) and a Hettich centrifuge model ROTOFIX 32A (Kirchlengern, Germany) were used for the preparation of the samples.
2.5. Extraction process
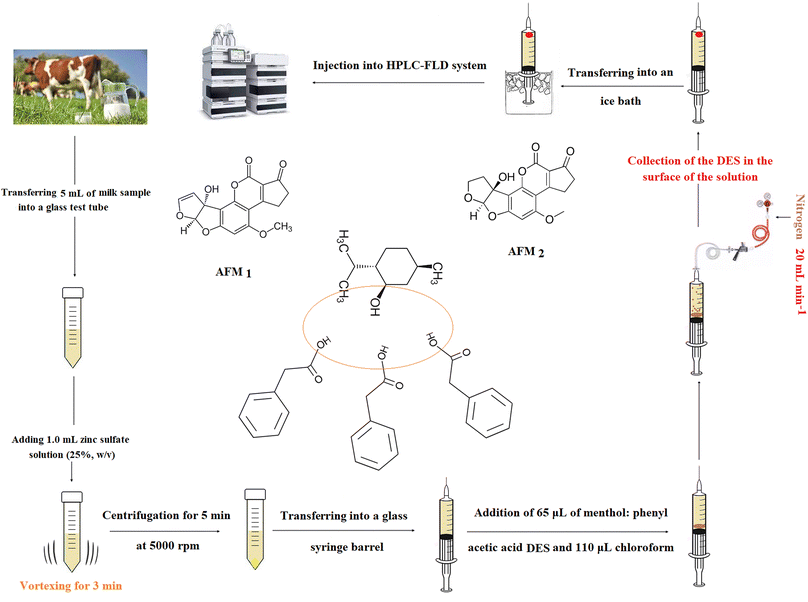
The extraction method was the modified version of perviously published method.22 First, a 5 mL raw cow milk sample spiked with the analytes (200 ng L−1) or real sample, was taken into a glass test tube and mixed with 1 mL zinc sulfate solution (25%, w/v). The obtained mixture was vortexed for 3 min and consequently the sample proteins were precipitated. After centrifuging (at 5000 rpm for 5 min), the upper phase was transferred into a barrel of a 10 mL glass syringe containing a mixture of 65 μL menthol![[thin space (1/6-em)]](https://www.rsc.org/images/entities/char_2009.gif) :
:![[thin space (1/6-em)]](https://www.rsc.org/images/entities/char_2009.gif) phenylacetic acid DES (as the extraction solvent), and 110 μL chloroform (as a density modifier). Subsequently, a needle was used to pierce the septum, and nitrogen gas (99.999%) was flown into the barrel at a flow rate of 20 mL min−1 adjusted using a nitrogen mass flow controller. After approximately 3 min, the chloroform content was completely evaporated, and the small droplets of menthol
phenylacetic acid DES (as the extraction solvent), and 110 μL chloroform (as a density modifier). Subsequently, a needle was used to pierce the septum, and nitrogen gas (99.999%) was flown into the barrel at a flow rate of 20 mL min−1 adjusted using a nitrogen mass flow controller. After approximately 3 min, the chloroform content was completely evaporated, and the small droplets of menthol![[thin space (1/6-em)]](https://www.rsc.org/images/entities/char_2009.gif) :
:![[thin space (1/6-em)]](https://www.rsc.org/images/entities/char_2009.gif) phenylacetic acid DES were released into the solution and the analytes extracted into its droplets. In the next step, the syringe was placed in an ice bath for 3 min and then a solidified drop was obtained. Finally, this drop was taken into a microtube using a spatula and injected into HPLC-FLD after diluting with the mobile phase till 50 μL. The steps and structure of the analytes and menthol
phenylacetic acid DES were released into the solution and the analytes extracted into its droplets. In the next step, the syringe was placed in an ice bath for 3 min and then a solidified drop was obtained. Finally, this drop was taken into a microtube using a spatula and injected into HPLC-FLD after diluting with the mobile phase till 50 μL. The steps and structure of the analytes and menthol![[thin space (1/6-em)]](https://www.rsc.org/images/entities/char_2009.gif) :
:![[thin space (1/6-em)]](https://www.rsc.org/images/entities/char_2009.gif) phenyl acetic acid DES are shown in Scheme 1.
phenyl acetic acid DES are shown in Scheme 1.
3. Results and discussion
3.1. Optimization of the extraction parameters
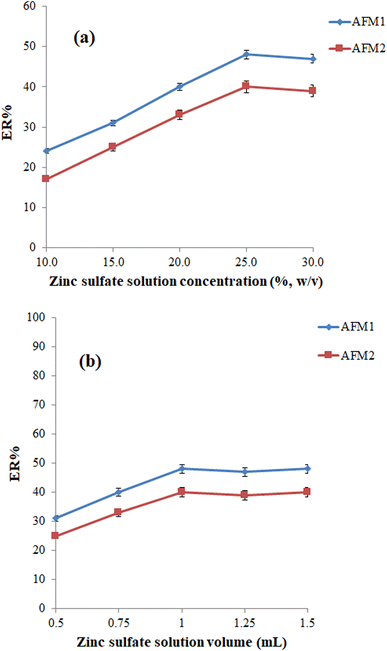
The volume of zinc sulfate solution is another parameter that can affect the efficiency of the protein precipitation step and consequently the efficiency of the extraction process. To optimize this parameter, various studies were performed using 0.50, 0.75, 1.00, 1.25, and 1.50 mL of zinc sulfate solution (25%, w/v). According to the outcomes shown in Fig. 1b, 1.00 is sufficient for the effective precipitation of the proteins.
![[thin space (1/6-em)]](https://www.rsc.org/images/entities/char_2009.gif) :
:![[thin space (1/6-em)]](https://www.rsc.org/images/entities/char_2009.gif) phenylacetic acid (65 μL) and ChCl
phenylacetic acid (65 μL) and ChCl![[thin space (1/6-em)]](https://www.rsc.org/images/entities/char_2009.gif) :
:![[thin space (1/6-em)]](https://www.rsc.org/images/entities/char_2009.gif) phenylacetic acid (80 μL) DESs was employed as the extraction solvent in the extraction process (various volumes were used to obtain an equal volume of the collected phase). As can be seen in Fig. 2, the best ERs for analytes were obtained using a menthol
phenylacetic acid (80 μL) DESs was employed as the extraction solvent in the extraction process (various volumes were used to obtain an equal volume of the collected phase). As can be seen in Fig. 2, the best ERs for analytes were obtained using a menthol![[thin space (1/6-em)]](https://www.rsc.org/images/entities/char_2009.gif) :
:![[thin space (1/6-em)]](https://www.rsc.org/images/entities/char_2009.gif) phenylacetic acid as the extraction solvent.
phenylacetic acid as the extraction solvent.
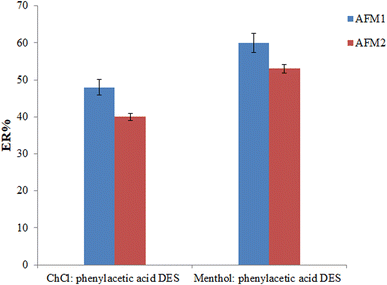 | ||
| Fig. 2 Selection of extraction solvent. Conditions: the same as those utilized in Fig. 1b, except the experiments were done using 1 mL zinc sulfate solution (25%, w/v) and 3 min vortexing time. | ||
To investigate the effect of menthol![[thin space (1/6-em)]](https://www.rsc.org/images/entities/char_2009.gif) :
:![[thin space (1/6-em)]](https://www.rsc.org/images/entities/char_2009.gif) phenylacetic acid volume on the efficiency of the offered method, its volume was varied in the range of 55–80 μL. Referring to the results, the ERs of both analytes increased up to 65 μL and remained constant at the higher volumes. So, the following experiments were performed using 65 μL of menthol
phenylacetic acid volume on the efficiency of the offered method, its volume was varied in the range of 55–80 μL. Referring to the results, the ERs of both analytes increased up to 65 μL and remained constant at the higher volumes. So, the following experiments were performed using 65 μL of menthol![[thin space (1/6-em)]](https://www.rsc.org/images/entities/char_2009.gif) :
:![[thin space (1/6-em)]](https://www.rsc.org/images/entities/char_2009.gif) phenylacetic acid DES.
phenylacetic acid DES.
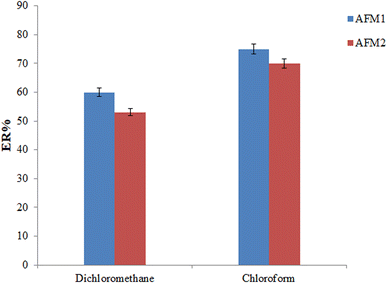 | ||
Fig. 3 Selection of density modifier. Conditions: the same as those utilized in Fig. 2, except menthol![[thin space (1/6-em)]](https://www.rsc.org/images/entities/char_2009.gif) : :![[thin space (1/6-em)]](https://www.rsc.org/images/entities/char_2009.gif) phenylacetic acid DES (65 μL) was utilized as extractant. phenylacetic acid DES (65 μL) was utilized as extractant. | ||
The volume of chloroform is another parameter that can affect the efficiency of the offered method and the required extraction time. To determine the optimum volume of chloroform, its volume was varied in the range of 110 (this volume was the least possible volume that could maintain the extractant at the bottom of the syringe prior to starting the extraction procedure) to 150 μL (at the intervals of 10 μL). Based on these outcomes, the ERs of the analytes were not altered by increasing the chloroform volume. Therefore, to shorten the required extraction time, 110 μL chloroform was used in the offered extraction procedure.
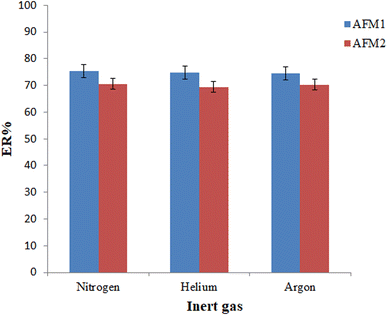 | ||
| Fig. 4 Selection of inert gas type. Conditions: the same as those utilized in Fig. 3, except the 110 μL chloroform was utilized in the extraction process. | ||
The flow rate of nitrogen is another parameter that can affect the required extraction time (the time needed for complete removal of chloroform) and the size of the released extractant droplets that consequently can affect the ERs of the analytes. Considering this point, the gas flow rate was varied in the range of 5 to 30 mL min−1 (a bubble flowmeter was employed for this purpose). As can be seen in Fig. 5, the ERs of both analytes increase up to 20 mL min−1 and then decrease due to splashing of the extractant on the inner walls of the syringe at higher flow rates and the large size of the released extractant droplets. Therefore, the gas flow rate was adjusted to 20 mL min−1 in the subsequent experiments.
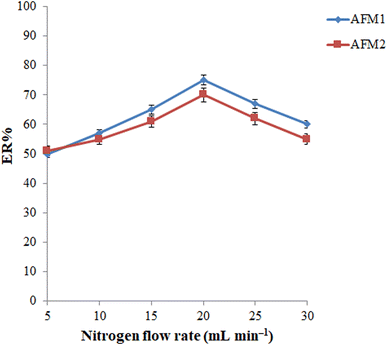 | ||
| Fig. 5 Optimization of inert gas flow rate. Conditions: the same as those utilized in Fig. 4, except nitrogen was used as an inert gas. | ||
3.2. Method validation
To assess the analytical performance of the offered method, some figures of merit including a limit of detection (LOD), limit of quantification (LOQ), linear range (LR), coefficient of determination, intra- and inter-day precisions, and ER were evaluated under the best extraction conditions. Based on the data (Table 1), the LODs, considered as signal (S) to noise (N) ratio of 3, were 1.45 and 1.86 ng L−1 for AFM1 and AFM2, respectively. By considering S/N = 10, the LOQs were calculated and data showed that they were 4.83 and 6.21 ng L−1 for AFM1 and AFM2, respectively. The linearity of the offered method obtained from the calibration curves was excellent (r2 ≥ 0.996) for the wide LRs (4.83–5 × 10⁵ ng L−1). ERs for AFM1 and AFM2 were 75% and 70%, respectively. The calibration curves were plotted from the data (peak area) obtained by performing the method on eight solutions versus concentration. For evaluation of the repeatability of the method, six solutions spiked at 100 ng L−1 were prepared and the obtained peak areas for each analyte after performing the method were recorded. RSD values were calculated on the same day (intra-day) and on four different days (inter-day); they were ≤4.8%.
| Analyte | LODa (ng L−1) | LOQb (ng L−1) | LRc (ng L−1) | r2d | RSDe (%) | ER ± SDf | |
|---|---|---|---|---|---|---|---|
| Intra-day (n = 6) | Inter-day (n = 4) | ||||||
| a Limit of detection (S/N = 3).b Limit of quantification (S/N = 10).c Linear range.d Coefficient of determination.e Relative standard deviation for intra- and inter-day precisions at a concentration of 100 ng L−1 of each analyte.f Extraction recovery ± standard deviation (n = 3). | |||||||
| AFM1 | 1.45 | 4.83 | 4.83–5 × 10⁵ | 0.998 | 3.5 | 4.2 | 75 ± 4 |
| AFM2 | 1.86 | 6.21 | 6.21–5 × 10⁵ | 0.996 | 3.9 | 4.8 | 70 ± 2 |
3.3. Analysis of the raw cow milk samples
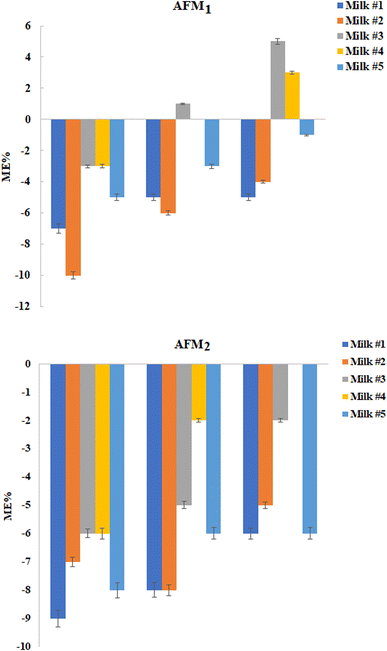
In this step, twenty raw cow milk samples were analyzed for monitoring AFM1 and AFM2 using the GCT-DT-SFOD-DLLME method under optimized conditions. Based on the outcomes, 9 out of 20 were contaminated with AFM1 whose concentration is presented in Table 2. Subsequently, the matrix effect of the raw cow milk samples was examined. As shown in Fig. 6, slight suppression of the analytical signals was obtained at the tested concentrations. The matrix effect (ME%) values were obtained in the range between −20% and +20%, and therefore it can be regarded as insignificant based on the SANTE guidelines.25| Sample | Mean concentration of the analyte (ng L−1) ± standard deviation (n = 3) | |
|---|---|---|
| AFM1 | AFM2 | |
| a Not detected. | ||
| Milk #1 | NDa | ND |
| Milk #2 | ND | ND |
| Milk #3 | 142 ± 11 | ND |
| Milk #4 | 96 ± 6 | ND |
| Milk #5 | 38 ± 2 | ND |
| Milk #6 | ND | ND |
| Milk #7 | ND | ND |
| Milk #8 | 78 ± 5 | ND |
| Milk #9 | ND | ND |
| Milk #10 | ND | ND |
| Milk #11 | ND | ND |
| Milk #12 | ND | ND |
| Milk #13 | 103 ± 8 | ND |
| Milk #14 | 114 ± 12 | ND |
| Milk #15 | 67 ± 3 | ND |
| Milk #16 | 132 ± 10 | ND |
| Milk #17 | ND | ND |
| Milk #18 | ND | ND |
| Milk #19 | 126 ± 9 | ND |
| Milk #20 | ND | ND |
3.4. Comparison of the method with other approaches
The quantitative data obtained using the offered method (LOD, LOQ, LR, and RSD) were compared with other methods.26–29 The details of these data are shown in Table 3. Referring to these results, the LODs and LOQs of the presented method are better than those of the previously reported ones. The RSDs for analytes using the suggested method are better than those from the other methods mentioned. Also, the LRs for the developed method are wider than those of the compared methods. Considering these outcomes, the offered analytical method is suitable for the determination of AFM1 and AFM2 in raw cow milk samples.| Sample | Analyte | RSDa (%) | LODb | LOQc | LRd | Method | Ref. |
|---|---|---|---|---|---|---|---|
| a Relative standard deviation.b Limit of detection (ng L−1).c Limit of quantification (ng L−1).d Linear range (ng L−1).e Liquid–liquid extraction-low temperature purification-high performance liquid chromatography-fluorescence detector.f Hollow fiber-liquid phase microextraction-high performance liquid chromatography-tandem mass spectrometry.g Solid phase extraction-high performance liquid chromatography-tandem mass spectrometry.h Liquid–liquid extraction-solid phase extraction-high performance liquid chromatography-fluorescence detector.i Gas-controlled density tunable solidification of floating organic droplet-based dispersive liquid–liquid microextraction-high performance liquid chromatography-fluorescence detector. | |||||||
| Breast milk | AFM1 | ≤5.9 | 10 (ng L−1) | 30 (ng L−1) | 100–15 × 103 (ng L−1) | LLE-LTP-HPLC-FLDe | 26 |
| Milk | AFM1 | 12.3 | 60 (ng L−1) | 210 (ng L−1) | 210–5 × 10³ (ng L−1) | HF-LPME-HPLC-MS/MSf | 27 |
| Peanut, maize and wheat | AFM1 | 8.4 | 70 (ng kg−1) | 240 (ng kg−1) | 102–105 (ng kg−1) | SPE-HPLC-MS/MSg | 28 |
| AFM2 | 11.4 | 160 (ng kg−1) | 520 (ng kg−1) | 102–105 (ng kg−1) | |||
| Milk | AFM1 | 5.28 | 125.42 (ng kg−1) | 418.05 (ng kg−1) | — | LLE-SPE-HPLC-FLDh | 29 |
| AFM2 | 5.71 | 151.73 (ng kg−1) | 505.77 (ng kg−1) | — | |||
| Milk | AFM1 | 6 (ng L−1) | 15 (ng L−1) | — | Immunoaffinity-HPLC-FLD | 24 | |
| Milk | AFM1 | 3.5 | 1.45 (ng L−1) | 4.83 (ng L−1) | 4.83–106 (ng L−1) | GCT-DT-SFOD-DLLME-HPLC-FLDi | Current work |
| AFM2 | 3.9 | 1.86 (ng L−1) | 6.21 (ng L−1) | 6.21–106 (ng L−1) | |||
4. Conclusions
In this study, the concentrations of AFM1 and AFM2 in raw cow milk samples were determined using GCT-DT-SFOD-DLLME and HPLC-FLD. The removal of the centrifugation step (a time-consuming step) and utilizing DES as an extraction solvent are the main advantages of this method compared with traditional DLLME. According to the validation outcomes, the suggested analytical method offers low LODs and LOQs, low RSDs, high ERs, and an insignificant matrix effect that can verify its suitability for the determination of AFM1 and AFM2 in raw cow milk samples. Also, referring to the real sample analysis, 45% of the tested raw cow milk samples were contaminated with AFM1, which is a warning and needs the attention of related regulatory organizations.Conflicts of interest
There are no conflicts to declare.References
- T. Bertuzzi, S. Rastelli, A. Mulazzi and A. Pietri, Food Anal. Methods, 2012, 5, 512–519 CrossRef.
- B. Huang, Z. Han, Z. Cai, Y. Wu and Y. Ren, Anal. Chim. Acta, 2010, 662, 62–68 CrossRef CAS PubMed.
- J. Li, X. Xu, X. Wang, C. Li, X. Feng, Y. Zhang and F. Zhang, Microchim. Acta, 2022, 189, 149 CrossRef CAS PubMed.
- G. Miklós, C. Angeli, Á. Ambrus, A. Nagy, V. Kardos, A. Zentai, K. Kerekes, Z. Farkas, Á. Jóźwiak and T. Bartók, Front. Microbiol., 2020, 11, 1916 CrossRef PubMed.
- D. Lee and K. G. Lee, Food Control, 2015, 50, 467–471 CrossRef CAS.
- G. C. Aran and C. Bayraç, Bioconjugate Chem., 2023, 34, 922–933 CrossRef CAS PubMed.
- N. Mollakhalili-Meybodi and A. Nematollah, Environ. Monit. Assess., 2023, 195(6), 786 CrossRef PubMed.
- M. Maggira, M. Ioannidou, I. Sakaridis and G. Samouris, Vet. Sci., 2021, 8, 46 CrossRef PubMed.
- F. Hepsag, O. Golge and B. Kabak, Food Control, 2014, 38, 75–81 CrossRef CAS.
- L. Liu, H. Jin, L. Sun, S. Ma and R. Lin, Phytochem. Anal., 2012, 23, 469–476 CrossRef CAS PubMed.
- O. Ketney, A. Santini and S. Oancea, Int. J. Dairy Technol., 2017, 70, 320–331 CrossRef CAS.
- A. Bokhary, M. Leitch and B. Q. Liao, J. Water Process Eng., 2021, 40, 101762 CrossRef.
- Y. Yamini, M. Rezazadeh and S. Seidi, Trends Anal. Chem., 2019, 112, 264–272 CrossRef CAS.
- H. Xu, Z. Ding, L. Lv, D. Song and Y. Q. Feng, Anal. Chim. Acta, 2009, 636, 28–33 CrossRef CAS PubMed.
- M. M. Sanagi, H. H. Abbas, W. A. Ibrahim and H. Y. Aboul-Enien, Food Chem., 2012, 133, 557–562 CrossRef CAS PubMed.
- L. Dai, J. Cheng, G. Matsadiq, L. Liu and J. K. Li, Anal. Chim. Acta, 2010, 674, 201–205 CrossRef CAS PubMed.
- Y. Wang, J. Li, D. Sun, S. Yang, H. Liu and L. Chen, J. Chromatogr. A, 2021, 1658, 462615 CrossRef CAS PubMed.
- C. Zheng, J. Zhao, P. Bao, J. Gao and J. He, J. Chromatogr. A, 2011, 1218, 3830–3836 CrossRef CAS PubMed.
- A. K. El-Deen and K. Shimizu, Molecules, 2021, 26, 7406 CrossRef CAS PubMed.
- H. Wang, L. Hu, W. Li, X. Yang, R. Lu, S. Zhang, W. Zhou, H. Gao and J. Li, Talanta, 2017, 162, 625–633 CrossRef CAS PubMed.
- M. Nemati, M. R. A. Mogaddam, M. A. Farajzadeh, M. Tuzen and J. Khandaghi, J. Chromatogr. A, 2021, 1660, 4626523 CrossRef PubMed.
- M. Nemati, M. A. Farajzadeh, M. R. A. Mogaddam, A. Mohebbi, A. R. Azimi, N. Fattahi and M. Tuzen, Microchem. J., 2022, 175, 107196 CrossRef CAS.
- A. Jouyban, M. A. Farajzadeh and M. R. A. Mogaddam, J. Chromatogr. B, 2019, 1124, 114–121 CrossRef CAS PubMed.
- M. Muscarella, S. Lo Magro, C. Palermo, D. Centonze, Microbial Toxins: Methods and Protocols, Methods in Molecular Biology, 2011, ch. 17, vol. 739 Search PubMed.
- Y. Wang, J. Li, L. Ji and L. Chen, Molecules, 2022, 27, 2160 CrossRef CAS PubMed.
- P. D. Andrade, J. L. G. Silva and E. D. Caldas, J. Chromatogr. A, 2013, 1304, 61–68 CrossRef CAS PubMed.
- S. Huang, D. Hu, Y. Wang, F. Zhu and G. Ouyang, J. Chromatogr. A, 2015, 1416, 137–140 CrossRef CAS PubMed.
- W. Guo, L. Wu, K. Fan, D. Nie, W. He, J. Yang, Z. Zhao and Z. Han, Sci. Rep., 2017, 7, 1–9 CrossRef PubMed.
- D. Lee and K. G. Lee, Food Control, 2015, 50, 467–471 CrossRef CAS.
Footnote |
| † Electronic supplementary information (ESI) available. See DOI: https://doi.org/10.1039/d3ra04149b |
| This journal is © The Royal Society of Chemistry 2024 |

