
 Open Access Article
 This Open Access Article is licensed under a Creative Commons Attribution-Non Commercial 3.0 Unported Licence
Quasi-spherical silver nanoparticles for human prolactin detection by surface-enhanced Raman spectroscopy†
Alejandra Ortiz-Dosal a,
M. C. Rodríguez-Arandacd,
Luis Carlos Ortiz-Dosalf,
Juan Manuel Núñez-Leyvaef,
Emmanuel Rivera-Pérezcd,
José Luis Cuellar Camachod,
Julián Rosendo Ávila-Delgadillobc and
Eleazar Samuel Kolosovas-Machuca*cd
a,
M. C. Rodríguez-Arandacd,
Luis Carlos Ortiz-Dosalf,
Juan Manuel Núñez-Leyvaef,
Emmanuel Rivera-Pérezcd,
José Luis Cuellar Camachod,
Julián Rosendo Ávila-Delgadillobc and
Eleazar Samuel Kolosovas-Machuca*cd
aCátedras CONAHCYT – Facultad de Ciencias Universidad Autónoma de San Luis Potosí, 1570, Parque Chapultepec Ave, 78295 San Luis Potosí, Mexico
bDoctorado Institucional en Ingeniería y Ciencia de Materiales (DICIM-UASLP), Universidad Autónoma de San Luis Potosí, 550 Sierra Leona Ave, 78210 San Luis Potosí, Mexico
cCoordinación para la Innovación y Aplicación de la Ciencia y la Tecnología, Universidad Autónoma de San Luis Potosí, 550 Sierra Leona Ave, 78210 San Luis Potosí, Mexico. E-mail: samuel.kolosovas@uaslp.mx
dFacultad de Ciencias, Universidad Autónoma de San Luis Potosí, 1570 Parque Chapultepec Ave, 78295 San Luis Potosí, Mexico
ePosdoctorado, CONAHCYT, Mexico
fMaestría en Ciencia e Ingeniería de los Materiales (MCIM-UAZ), Universidad Autónoma de Zacatecas, 801 López Velarde St, 9800 Zacatecas, Mexico
First published on 27th February 2024
Abstract
Prolactin is a polypeptide hormone made of 199 amino acids; 50% of the amino acid chain forms helices, and the rest forms loops. This hormone is typically related to initiating and maintaining lactation, although it is also elevated in various pathological conditions. Serum prolactin levels of 2 to 18 ng ml−1 in men, up to 30 ng ml−1 in women, and 10 to 210 ng ml−1 in pregnant women are considered normal. Immunoassay techniques used for detection are susceptible to error in different clinical conditions. Surface-enhanced Raman spectroscopy (SERS) is a technique that allows for obtaining the protein spectrum in a simple, fast, and reproducible manner. Nonetheless, proper characterization of human prolactin's Raman/SERS spectrum at different concentrations has so far not been deeply discussed. This study aims to characterize the Raman spectrum of human prolactin at physiological concentrations using silver nanoparticles (AgNPs) as the SERS substrate. The Raman spectrum of prolactin at 20 ng ul−1 was acquired. Quasi-spherical AgNPs were obtained using chemical synthesis. For SERS characterization, decreasing dilutions of the protein were made by adding deionized water and then a 1![[thin space (1/6-em)]](https://www.rsc.org/images/entities/char_2009.gif) :1 volume of the AgNPs colloid. For each mixture, the Raman spectrum was determined. The spectrum of prolactin by SERS was obtained with a concentration of up to 0.1 ng ml−1. It showed characteristic bands corresponding to the side chains of aromatic amino acids in the protein's primary structure and the alpha helices of the secondary structure of prolactin. In conclusion, using quasi-spherical silver nanoparticles as the SERS substrate, the Raman spectrum of human prolactin at physiological concentration was determined.
:1 volume of the AgNPs colloid. For each mixture, the Raman spectrum was determined. The spectrum of prolactin by SERS was obtained with a concentration of up to 0.1 ng ml−1. It showed characteristic bands corresponding to the side chains of aromatic amino acids in the protein's primary structure and the alpha helices of the secondary structure of prolactin. In conclusion, using quasi-spherical silver nanoparticles as the SERS substrate, the Raman spectrum of human prolactin at physiological concentration was determined.
1 Introduction
Prolactin (PRL) is a pleiotropic hormone whose chemical structure is characterized by a 199 amino acids chain, three intramolecular disulfide bonds in six cysteine residues; 50% of the amino acid chain forms α-helices, and the rest are loops.1,2 PRL is primarily synthesized and secreted from the lactotroph cells of the anterior pituitary gland and is also synthesized in non-pituitary sites, including the uterus, immune cells, brain, breast, prostate, skin, and adipose tissue, acting as a signalling molecule, and locally as a growth-promoting factor.3 PRL participates in various physiological events, including implantation, pregnancy, lactation, the proliferation and differentiation of mammary gland cells, immunoregulation, and angiogenesis.3 Prolactin is low in males and non-lactating non-pregnant females. In males, normal serum prolactin levels range from 2 to 18 ng ml−1; in females, 2 to 30 ng ml−1; and during the third trimester of pregnancy, 10 to 210 ng ml−1.3 PRL serum elevation could be used as a biomarker in different types of cancers (endometrial, ovarian, and cervical) and other diseases.4–6 This marker is especially useful in diagnosing a particular kind of tumor, prolactinoma, the most common pituitary adenoma.3 Prolactinoma is characterized by an increased secretion of prolactin (the serum prolactin level is typically greater than 200 ng ml−13 and symptoms like oligo-amenorrhea in females, erectile dysfunction in males, galactorrhea, infertility in both sexes and pathologic findings observed with magnetic resonance imaging of the sellar region.7,8 The evaluation of prolactin levels is helpful in the diagnosis, assessment of pharmacological response, and follow-up of patients with prolactinoma.9Immunoassay techniques usually quantify serum prolactin levels. However, this kind of analysis presents some disadvantages, for example, pre-, intra-, and post-analytical interferences.10 The availability of monoclonal antibodies and a solid-phase sandwich technique led to the development of non-competitive assays. In the sandwich technique, the two antibodies are raised against two different epitopes of the antigen, increasing the assay's specificity. The capture antibody is bound to a solid phase; the other is iodinated or conjugated to an enzyme. In the latter case, the substrate is added to give a colour, chemiluminescence, or fluorescence after the final incubation. The automated assays for prolactin are nonradioactive, mostly chemiluminescent, immunometric assays. All immunoassays are prone to interference, which can lead to erroneous results. Interferences that can influence the results from prolactin immunoassays are explained mainly by the presence of macroprolactin.11 Three primary forms of prolactin circulate in the body: monomeric (23 kD), big (50–60 kD), and big–big prolactin (150–170 kD). The latter is formed because circulating monomeric prolactin can be bound to an IgG antibody and is termed macroprolactin, an inactive form with a longer half-life. A possible explanation for developing these anti-prolactin antibodies is post-translational modifications that give rise to immunogenicity. Macroprolactin interference in the immunoassays leads to unnecessary radiological explorations because it results in the misdiagnosis and mistreatment of hyperprolactinemia, which occurs in as many as 10% of all reported biochemical hyperprolactinemia.11,12 The concentration at which macroprolactin is investigated varies in clinical laboratories, but a large proportion uses 700 mIU L−1 as the cutoff level. The presence of macroprolactin has been investigated in two ways. One is by precipitation of the macroprolactin with PEG, and the other by the more laborious gel filtration on a dextran column.11,13,14 Therefore, new techniques are explored.
Raman spectroscopy of proteins provides unique signatures for various secondary structures like helices, beta-sheets, turns, random coils, amino acid residues, and tertiary structures.15 This interaction allows the obtention of a qualitative measurement of biochemical composition and a distinctive ‘fingerprint’ of the sample. This technique has a high molecular specificity; however, Raman scattering is a weak phenomenon with an exceptionally low probability of occurrence (∼1 in 108). Thus, it is typically described as an insensitive technique.16 Therefore, a high protein concentration (greater than 10 mg ml−1) is usually required when determining protein Raman spectra, which do not reflect the concentrations found in clinical samples. For this reason, efforts are being made to enhance the Raman signals of proteins. It is observed that the Raman signal of analytes adsorbed on the surface of metallic nanoparticles increases by a factor of 102–1014.15,17 The enhancement is due to the amplification of the incident light by the excitation of localized surface plasmon resonances of metal nanoparticles. This phenomenon is termed surface-enhanced Raman scattering (SERS) and has been used to study analytes in very low concentrations down to single molecules.18 Some metallic nanoparticles used as SERS substrates for protein quantification allow a sub-picomolar detection limit.15
SERS has a high sensitivity and the instrumental benefits of Raman spectroscopy (minimal spectral recording time, non-invasive analysis, minimal or no sample preparation, and specificity).19
After an exhaustive literature review (the search strategy is described in Section 3 of ESI†), it was found that no detailed study on human PRL by Raman/SERS spectrum has been previously reported. Although, in an independent search, a recently reported study was found. In a probe of principle measurement, Wang et al. used SERS to obtain the prolactin spectrum.20 However, in that study, the prolactin spectrum was not sufficiently characterized.
Therefore, this study aims to characterize the human prolactin Raman and SERS spectra in physiological concentrations using quasi-spherical silver nanoparticles as substrate.
2 Materials and methods
Recombinant Human Prolactin >98% purity (PreproTech, Rocky Hill, NJ, USA) was used for the experiments. A model and Primary and secondary prolactin structure are showed in Section 1 of ESI.† Decreasing serial dilutions of the protein were prepared using deionized water, as described in Table 1.| Solution number | Protein concentration for Raman experiments | Protein concentration for SERS experiments |
|---|---|---|
| C0 | 20 ng μl−1 | 10 ng μl−1 |
| C1 | 1 ng μl−1 | |
| C2 | 0.1 ng μl−1 | |
| C3 | 0.01 ng μl−1 | |
| C4 | 0.001 ng μl−1 | |
| C5 | 0.0002 ng μl−1 | 0.0001 ng μl−1 |
The silver nanoparticles synthesis was adapted from the method reported by Mulfinger et al.:21 2 ml of a 0.001 M solution of silver nitrate (AgNO3, 99.3%. Purchased from Fermont) were added to a cooled 250 ml, 0.002 M solution of sodium borohydride (NaBH4, 98.6%. Purchased from Fermont) under continuous stirring. The mixture turns pale yellow which indicates the formation of silver nanoparticles. AgNO3 is reduced with NaBH4 following the reaction:

The nanoparticles were characterized using UV-vis spectroscopy, dynamic light scattering (DLS), and atomic force microscopy (AFM). No dispersant was added to the nanoparticles colloid to avoid undesired interactions during SERS analysis.
The purified protein was mixed with water to obtain different solutions with decrescent prolactin concentrations. Then, 40 μl of each prepared solution was mixed with 40 μl of the Ag nanoparticles colloid. We resuspended several times to incorporate the protein-nanoparticles solution, and then, we placed all the 80 μl volume of the final solution in a cell of the aluminum plate. This aluminum device consists of a disk with a 20 cm diameter and 2 cm height. In this disk ten cylinders with a diameter of 0.5 cm and a height of 1 cm were machined to be used as a surface for Raman spectroscopy (The design of aluminum device is showed in Fig. S6 in the ESI†).
The measurements were performed directly over the surface of the colloidal solution mixture containing the nanoparticles and the diluted solution containing the prolactin. This way, instead of a traditional SERS substrate, we use a three-dimensional colloid in an aqueous solution (water is not Raman active in the 400–2000 cm−1 region). This aqueous mixture is placed in the small aluminum container and the laser hits the liquid surface from above. Aluminum was chosen because FCC metals have only acoustic phonons and, consequently, do not show Raman spectra.22
For the absorption spectroscopy (UV-vis), a PerkinElmer Instruments Lambda 25 UV/VIS spectrometer, with a 300 to 750 nm measuring range, was used for all our AgNPs colloidal samples. Initial calibration was performed to subtract the baseline attributed to the light that hit the quartz cell without a sample, then 1.5 ml of each colloid were added into quartz cells and placed into the device. The spectra of each colloid showed silver-characteristic plasmonic resonance.23
The morphological and size characterization of Ag nanoparticles was performed with a Multimode AFM 8 from Bruker with a Nanoscope controller V in Tapping mode in dry conditions. AFM tips model PPP with an apex radius of <10 nm, a cantilever spring constant of 40 N m−1, and a resonance frequency of 330 MHz. For AFM measurements, Ag nanoparticles were analyzed directly after synthesis. 5 ml of stock solution produced with the synthesis were sonicated for 30 minutes at 65% power to avoid nanoparticle aggregation. Immediately after sonication, 5 μl of the sonicated solution was deposited onto cleaved (muscovite) mica and let to dry for at least 15 minutes. Afterwards, the mica substrate was mounted on the AFM piezo-element. Imaging was performed at 0.7–1 Hz scanning rate at 512 points per line. To analyze the obtained data, the software Nanoscope 4.1 was used to extract surface parameters and obtain the cross-section data to quantify the nanoparticle's height.
For the Dynamic Light Scattering (DLS) experiments, the Zetasizer NanoZS, Malvern Instruments Ltd, Worcestershire, UK, were used. Three measurements were made for each sample; 1.5 ml of each colloid were added to the cells indicated for the equipment. The measurement of each sample took approximately 20 min. The distribution of sizes of AgNPs and the Z-potential of the colloid were obtained.
Immediately after the preparation of dilutions. Raman and SERS measurements were performed on a Horiba Jobin Yvon XploRA ONE Raman spectrometer coupled to an Olympus BX41 optical microscope, using a 532 nm green laser source, 30 mW of power, and grating 2400 gr mm−1. The laser beam focused on the solution sample with a 20× objective (N. A. = 0.40). The Raman shift was obtained from 400 to 2000 cm−1, in an acquisition time of 20 s, and three acquisitions were taken and averaged to provide the final spectrum. The fitting process of the Raman bands was performed using the Fityk program (V 1.3.1).24 Fitting the baseline of the Raman spectra was carefully established before data fitting. To do this, the fluorescence background was removed by fitting a polynomial curve to the measured spectrum where no Raman signal was expected.25 The entire deconvolution process is explained in more detail in the Section 2 of ESI† for the reader's benefit. The SERS amplification factor was calculated in MATLAB software using the Estimation of Surface-enhanced Raman Spectroscopy (SERS) enhancement factor.26
3 Results
3.1. Morphological characterization of AgNPs
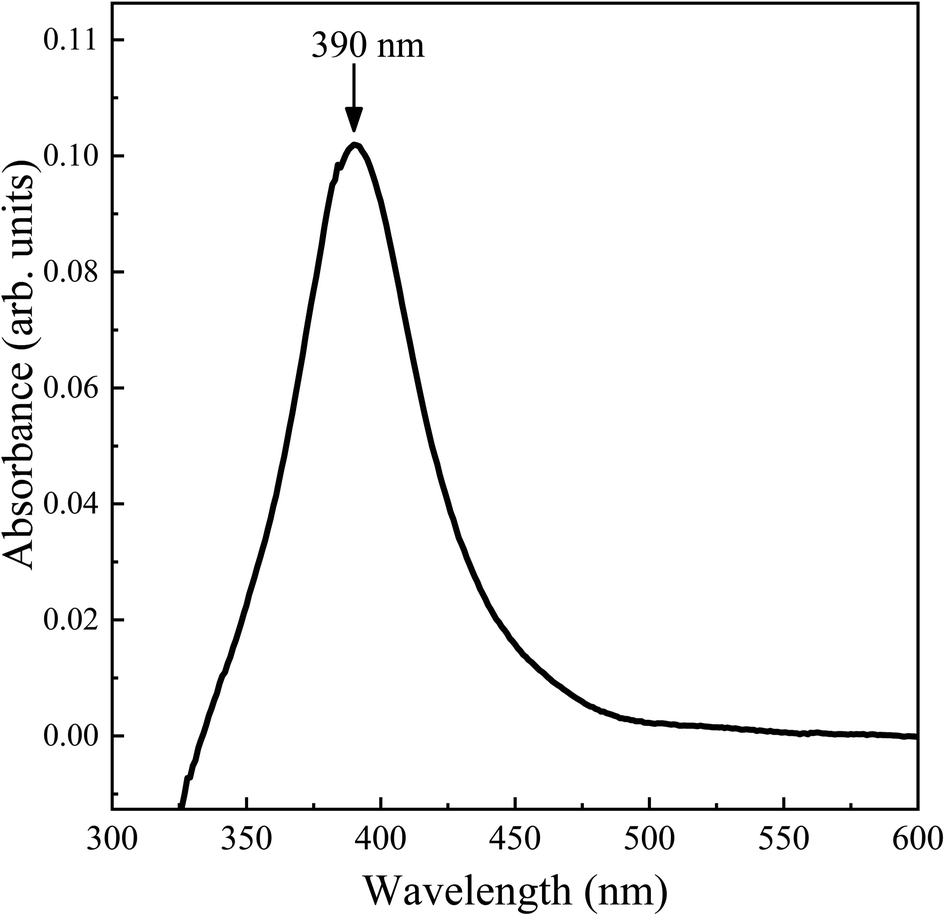 | ||
| Fig. 1 The plasmon resonance at 390 nm exhibited by the AgNPs as measured by UV-vis spectroscopy. | ||
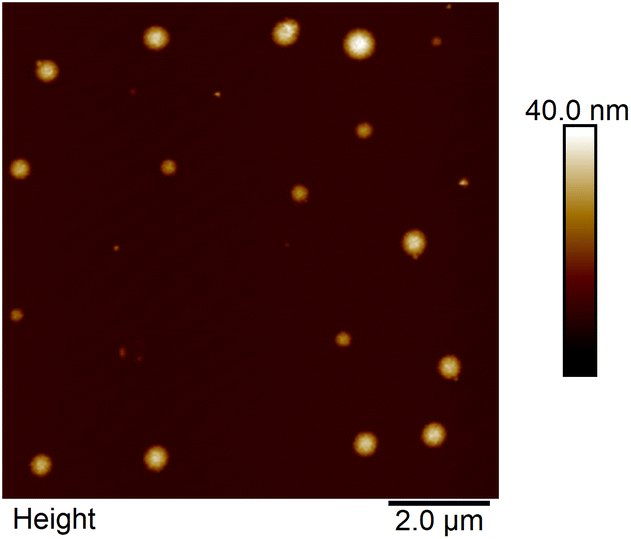 | ||
| Fig. 2 Atomic force microscopy of the AgNPs showing different sizes. | ||
The colloid has a wide dispersion of particle sizes. It is essential to point out that the AgNPs were used immediately after the synthesis to perform the SERS analysis, and the morphological characterization was subsequently performed. Consequently, a large number of agglomerates are expected to form in the colloidal suspension.
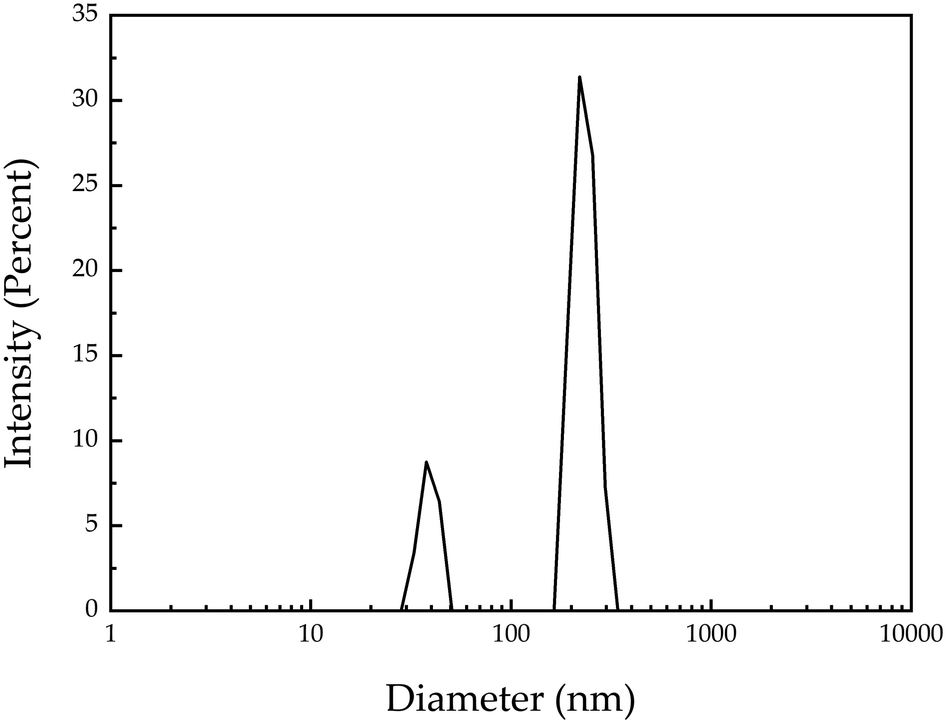 | ||
| Fig. 3 Bimodal size distribution of the AgNPs with peaks at 232 nm and 38 nm. | ||
3.2. Prolactin Raman and SERS spectra
All the Raman and SERS experiments were conducted with the purified protein in an aqueous solution. Fig. 4 shows the 0.0002 ng μl−1 PRL Raman and 0.0001 ng μl−1 PRL SERS spectra obtained after adding the AgNPs. In Raman experiment, we found Raman shifts at 447, 531, 608, 707, 752, 813, 904, 954, 1028, 1100, 1137, 1184, 1231, 1270 and 1411 cm−1. In SERS experiments, we found Raman shifts at 419, 523, 617, 707, 743, 827, 1023, 1080, 1140, 1170, 1326, 1353, 1405 cm−1 assigned to various amino acid functional groups, and 920, 950, 1240, 1292 cm−1, reflecting mainly the secondary structure of the PRL (Table 2 and Fig. S3;† raw data of SERS bands obtained at different prolactin concentrations are described in ESI Table S2†). We observed the most significant enhancement at 617 cm−1; this band is assigned to different vibrational modes of phenylalanine (Phe) (Fig. S4 in ESI† shows Raman mode corresponding to SERS Phe signal trends with different prolactin concentrations). As per the principles of the electromagnetic enhancement theory, it's essential to highlight that significantly enhanced Raman signals are observable exclusively in the amino acid residues situated in close proximity to the SERS-active surface.27 The complete amino acid sequence of human prolactin and the protein model are shown in the ESI (Section 1, Table S1 and Fig. S1†).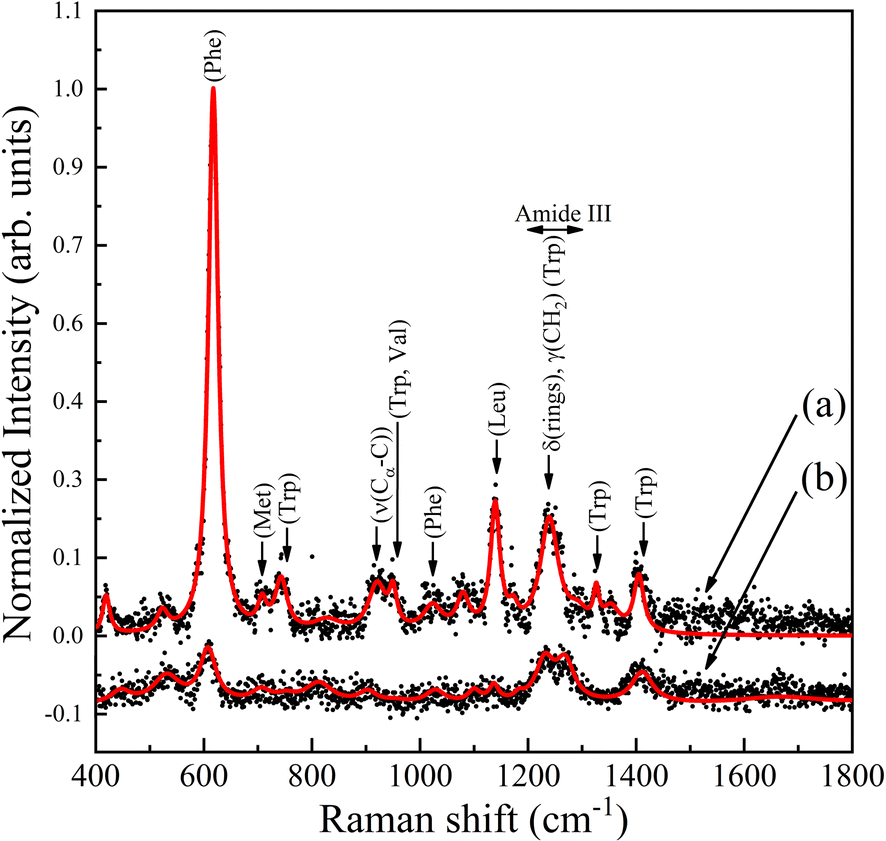 | ||
| Fig. 4 (a) SERS of prolactin (0.0001 ng μl−1) and (b) Raman spectra of prolactin (0.0002 ng μl−1). The red line represents the result of the fitting spectra, and the dark dots represent the experimental Raman shift points recorded. | ||
| Raman shift (Raman) (cm−1) | Raman shift (SERS) (cm−1) | Relative intensity | Proposed band assignment | References |
|---|---|---|---|---|
| 447 | 419 | W | Glutamine (409) | 29 and 30 |
| Ring torsion of phenyl (447) | ||||
| 531 | 523 | VW | S–S disulfide stretching in proteins (524) ν(S–S) aminoacid cysteine | 30 |
| 608 | 617 | VS | C–C twisting (proteins) | 30 and 31 |
| C–C twisting mode of phenylalanine (618, 621) | ||||
Deformation O–C![[double bond, length as m-dash]](https://www.rsc.org/images/entities/char_e001.gif) O (phenylalanine) (606) O (phenylalanine) (606) |
||||
| 707 | 707 | W | ν(C–S) trans (aminoacid methionine) | 30 |
| C–C stretching proline | ||||
| 752 | 743 | W | Symmetric stretching of tryptophan (749, 759) | 30–32 |
| Deformation ring C–H, out-of-plane bending ring (748) | ||||
| 813 | 827 | VW | Out-of-plane ring breathing tyrosine (823–831) | 30 |
| 904 | 920 | W | Skeletal C–C, α-helix (932) ν(Cα–C) skeletal backbone (933–34) | 30 and 31 |
| C–C stretching mode of proline (911), valine (948) and protein backbone, α-helix conformation (935) | ||||
| 954 | 950 | W | Single bond stretching vibrations of proline and valine (950) vs.(CH3) of proteins (α-helix) (951) | 30 |
| 1028 | 1023 | VW | C–H in-plane bending mode of phenylalanine (1031) | 30 |
| 1100 | 1080 | VW | Proline (1067) | 30 |
| C–N stretching mode of proteins (1083) | ||||
| 1137 | 1140 | M | ν(C–N) (1152) and C–C, C–N stretching (1155–56) | 30 |
| Tyrosine (1163) | ||||
| 1184 | 1170 | VW | CH bend, tyrosine, and phenylalanine (1174) | 30 |
| 1231 | 1240 | M | Amide III, a C–N stretch from α-helix proteins (1258–79), random structure amide III (1250) | 30–32 |
| Tryptophan (1261, 1266) | ||||
| 1270 | 1292 | VW | Amide III (1302), alpha helices (1270–1300) | 30 and 33 |
| CH3, δ(rings), γ(CH2) | ||||
| C–N asymmetric stretching in asymmetric aromatic amines (1308) | ||||
| 1326 | W | CH3CH2 wagging (1335) | 30 | |
| 1353 | VW | Tryptophan (1359), hydrophobicity marker for tryptophan (1360/1340) | 30 and 33 | |
| 1411 | 1405 | W | ν COO− (1409) | 30 and 31 |
| Serine (1413) |
Fig. 5 shows the SERS spectra of PRL at different concentrations, as described in Table 1. We observed the Raman spectrum of prolactin in Fig. 5a and the corresponding decreasing dilutions with NPs are shown in the subsequent spectra. All bands found in the spectra were consistent between them. It is important to mention that the SERS spectra of the prolactin exhibit a notable absence of peaks corresponding to the amide I bands, which typically fall within the range of 1640–1678 cm−1. This observation was clarified by Kurouski et al. through their SERS investigations on various homopeptides.28 This research demonstrated that the absence of amide I bands in the spectra depends on the amino acid side chain size. Specifically, a bulky side chain results in a greater separation between the peptide bond and the metal nanoparticle, thus preventing immediate contact between them.28 The successfully measured concentrations are in the physiological level range that is typically reported in the analysis of PRL as a biomarker of different pathologies.
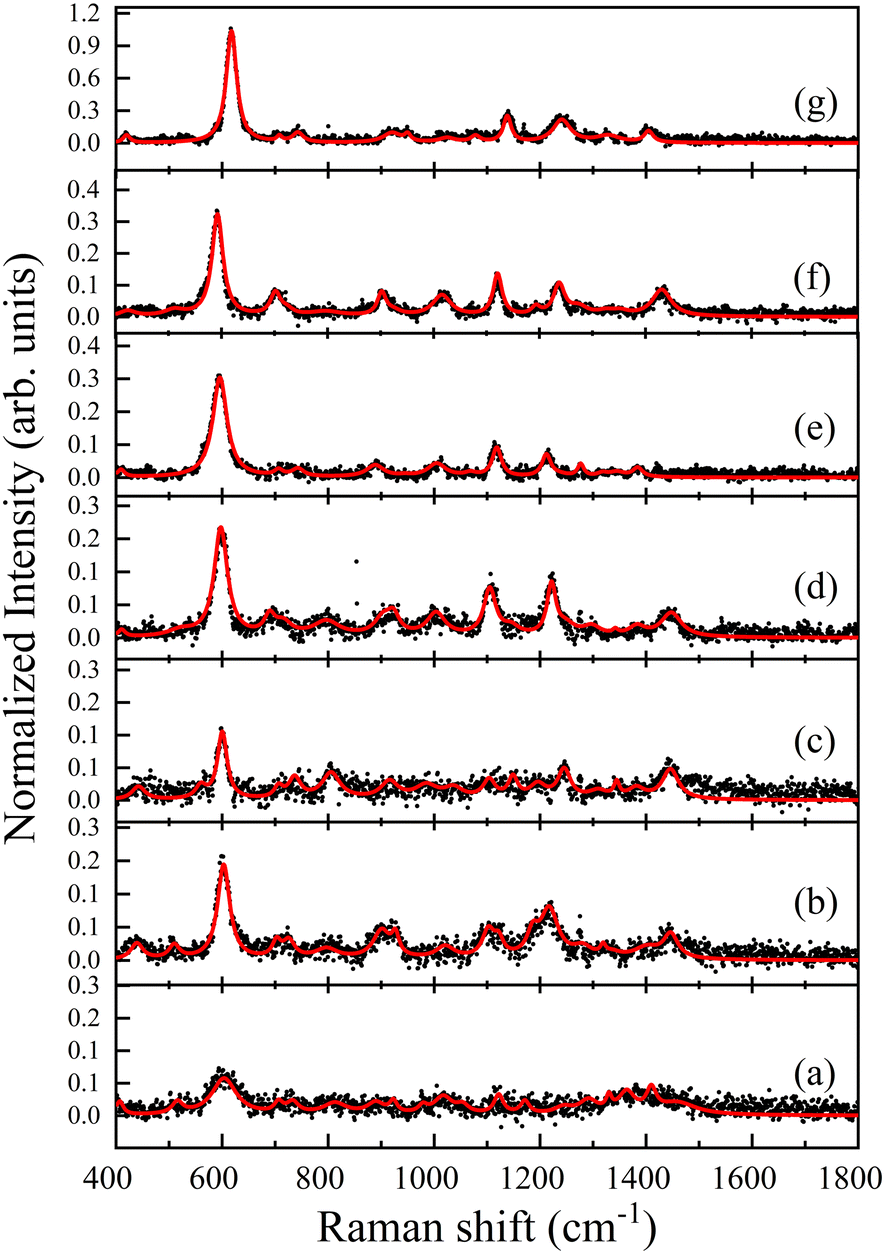 | ||
| Fig. 5 (a) Prolactin Raman spectra with concentration of 20 ng μl−1 and SERS spectra after adding AgNPs 1:1, with a protein concentration (b) 10 ng μl−1, (c) 1 ng μl−1, (d) 0.1 ng μl−1, (e) 0.01 ng μl−1, (f) 0.001 ng μl−1, and (g) 0.0001 ng ul−1. | ||
3.3. Characteristic Raman bands assignment
The characteristic Raman bands in PRL Raman and SERS spectra correspond to the amino acids' lateral chain that conforms to the protein's primary structure, the α-helices of the secondary structure, and the carbon skeletal backbone. Table 2 shows the Raman shifts and proposed band assignment for the prolactin Raman and SERS spectra obtained.3.4. Enhancement factor determination
We calculated the enhancement factor (EF) using the equation:| EF = (ISERS × Nnormal)/(Nnormal × NSERS). |
This was implemented in the MATLAB program: “Estimation of Surface-enhanced Raman spectroscopy (SERS) Enhancement Factor”.26 To this end, the following values were considered: The spectra of the protein at the lowest concentration at 0.0001 ng μl−1 with and without NPs (as shown in Fig. 4) because the purpose of the technique is to find the spectrum of the protein at physiological and clinically relevant concentrations; the most enhanced and prominent characteristic band (617 cm−1), the wavelength of the incident laser (532 nm), the molecular weight of the molecule under test (22930 g mol−1), the density of the molecule (1.41 g cm−3), the numerical aperture of the objective (0.40), and surface area of the molecule under test (157.07 nm2). With those introduced values, the obtained EF value was 4.64 × 10⁵.
4 Discussion
The analytical quantification and follow-up of the hormone prolactin are essential in diverse clinical settings. Measurement of prolactin is one of the most undertaken hormonal investigations in evaluating patients with reproductive disorders, infertility, polycystic ovarian syndrome, and in those with prolactinoma for diagnosis and follow-up.12,34,35 Laboratories rely on automated platforms to measure prolactin, most of which employ two-site immunoassay sandwich methods. Although generally robust, such immunoassays are susceptible to interference, and this issue must be considered when evaluating patients with suspected hormone disorders.12Developing a new, simple, fast, and less costly method is relevant in this scenario. Besides SERS, other biosensor techniques are being investigated for protein detection.36,37 In a 2019 study, authors synthesized praseodymium metal–organic framework nanofibers to determine human prolactin in serum samples. Through the nanofiber's photoluminescence, authors concluded that it could be used as a sensitive and selective nanofiber optical sensor to detect human prolactin 38.
In this study, we determined the prolactin Raman and SERS spectra in an aqueous solution, using AgNPs as substrate. The technique was sensitive enough to detect the spectra at low (physiological) concentrations. It was noted that the intensity of the signal increased with lower concentrations of prolactin, maybe due to the chemical enhancement effect. The SERS Raman intensity strongly depends on the nanosurface and prolactin molecules' electromagnetic and chemical enhancement effects. According to Jensen et al.,39 chemical enhancement primarily involves charge transfer mechanisms, where the excitation wavelength is resonant with the metal-molecule charge transfer electronic states. Also, the SERS effect is highly dependent on the surface interactions; having fewer protein molecules, steric and electrostatic repulsion effects decrease, which allows greater amplification of all the vibrational modules that cause Raman scattering due to better contact with the surface of the AgNps. This phenomenon could be explained by the AgNP:protein molecule ratio. Suppose the volume and concentration of the metallic nanoparticle colloid are kept, but the protein concentration is decreased. The molecules can interact freely with the nanoparticle surface because there is less electrostatic repulsion between protein molecules; hence, the intensity is greater in lower concentrations, according to Markina et al.40 In this experiment, the laser wavelength of the Raman spectroscope is 532 nm, and the AgNps plasmon resonance is at 390 nm; hence, the enhancement cannot be entirely attributed to an electromagnetic effect. However, according to Sharma et al., silver has localized surface plasmon resonances that cover a range of wavelength from around 400 nm to 1000 nm, where most Raman measurements occur.41 In the current work, a 532 nm laser was used, which is in this range. Also, silver has a higher plasmon quality than that of gold.42 Likewise, in our experience, silver is more suitable for the red and near-infrared regions.
In this study, our aim is to provide a more detailed characterization of the SERS spectra of human prolactin.
However, the study has limitations. The experiment was conducted with a purified protein. So, it did not require an extended analysis of the experimental data or the spectral obtention. However, this is not the case when analyzing a complex sample. The presence of other molecules in the sample and the interactions between different proteins could lead to different spectral characteristics. The prolactin spectra would appear different in a heterogeneous sample (such as human serum), so this analysis requires a different experimental approach. In this scenario, it is possible to discern between different molecules in the sample, but it will require an extended spectral analysis. In previous works, it was helpful to analyze the data using principal component analysis-support vector machine or linear discriminant analysis.43,44
For these SERS experiments, preparing the protein nanoparticle mixture did not require additional labels, antibodies, or dyes. It also does not require incubation time with the protein solution and the nanoparticle colloid before the obtention of the Raman and SERS spectra, making this approach less time-consuming than others reported in similar works.45,46 Therefore, further research is needed.
5 Conclusions
Silver nanoparticles with a surface plasmon resonance at 390 nm and a bimodal size distribution were used as a SERS substrate for the detection of human prolactin at physiological levels. The SERS experiments were conducted in a range of concentrations from 10 ng μl−1 to 0.0001 ng μl−1, and the characteristic vibrational bands were clearly identified in all the ranges of concentrations. It is demonstrated that using silver nanoparticles as SERS substrate allows the determination of the Raman spectrum of prolactin at physiological concentrations (0.1 ng ml−1).Author contributions
AOD conceived the original idea of this project and carried out the dilutions for Raman and SERS experiments, participated in the coordination of the experiment, and wrote the first draft of the manuscript. MCRA contributed substantially to the acquisition, analysis, and interpretation of spectroscopy data. LCOD performed the synthesis of nanoparticles and the interpretation of the characterization methods. JMNL supported all the technical details, helped draft the manuscript, and characterized nanoparticles with dynamic light scattering. ERP supported all the technical details. JLCC carried out the characterization of microscope techniques and wrote the draft of the manuscript. JRAD carried out the characterization of the employed nanoparticles with UV-vis spectroscopy. ESKM supervised and managed the project and conceived and planned the experiments, acquisition, formal analysis, and interpretation. All the authors discussed, revised, and approved the final version of this work.Conflicts of interest
There are no conflicts to declare.Acknowledgements
The authors acknowledge Dr Michelle Goodrich for her comments, corrections, and critical revision of this manuscript. The authors acknowledge the financial support of CONAHCYT (grant CF-2023-I-2045).References
- K. Teilum, J. C. Hoch, V. Goffin, S. Kinet, J. A. Martial and B. B. Kragelund, Solution Structure of Human Prolactin, J. Mol. Biol., 2005, 351, 810–823, DOI:10.1016/j.jmb.2005.06.042.
- M. E. Freeman, B. Kanyicska, A. Lerant and G. Nagy, Prolactin: Structure, Function, and Regulation of Secretion, Physiol. Rev., 2000, 80, 1523–1631, DOI:10.1152/physrev.2000.80.4.1523.
- M. Al-Chalabi, A. N. Bass and I. Alsalman, Physiology, Prolactin, StatPearls, 2022 Search PubMed.
- A. Ramírez-de-Arellano, J. C. Villegas-Pineda, C. D. Hernández-Silva and A. L. Pereira-Suárez, The Relevant Participation of Prolactin in the Genesis and Progression of Gynecological Cancers, Front. Endocrinol., 2021, 12, DOI:10.3389/fendo.2021.747810.
- C. A. Hathaway, M. S. Rice, M. K. Townsend, S. E. Hankinson, A. A. Arslan, J. E. Buring, G. Hallmans, A. Idahl, L. D. Kubzansky and I.-M. Lee, et al., Prolactin and Risk of Epithelial Ovarian Cancer, Cancer Epidemiol., Biomarkers Prev., 2021, 30, 1652–1659, DOI:10.1158/1055-9965.EPI-21-0139.
- M. Q. Salas, S. Ezzat, W. Lam, A. D. Law, I. Pasic, F. V. Michelis, D. D. H. Kim, A. Gerbitz, Z. Al-Shaibani and A. Viswabandya, et al., Prolactin, a Potential Biomarker for Chronic GVHD Activity, Eur. J. Haematol., 2021, 106, 158–164, DOI:10.1111/ejh.13531.
- Y. Wu, M.-L. Li, H.-J. Han, L.-J. Huang and Y. He, Elevated Plasma/Serum Levels of Prolactin in Patients with Systemic Sclerosis, Medicine, 2020, 99, e22239, DOI:10.1097/MD.0000000000022239.
- M. Dourado, F. Cavalcanti, L. Vilar and A. Cantilino, Relationship between Prolactin, Chronic Kidney Disease, and Cardiovascular Risk, Int. J. Endocrinol., 2020, 2020, 1–6, DOI:10.1155/2020/9524839.
- R. Cozzi, M. R. Ambrosio, R. Attanasio, C. Battista, A. Bozzao, M. Caputo, E. Ciccarelli, L. De Marinis, E. De Menis and M. Faustini Fustini, et al., Italian Association of Clinical Endocrinologists (AME) and International Chapter of Clinical Endocrinology (ICCE). Position Statement for Clinical Practice: Prolactin-Secreting Tumors, Eur. J. Endocrinol., 2022, 186, P1–P33, DOI:10.1530/EJE-21-0977.
- L. Aliberti, I. Gagliardi, R. M. Dorizzi, S. Pizzicotti, M. Bondanelli, M. C. Zatelli and M. R. Ambrosio, Hypeprolactinemia: Still an Insidious Diagnosis, Endocrine, 2021, 72, 928–931, DOI:10.1007/s12020-020-02497-w.
- M. J. Wheeler, The measurement of LH, FSH, and prolactin, Methods Mol. Biol., 2013, 1065, 105–116, DOI:10.1007/978-1-62703-616-0_6.
- T. Smith, L. Kavanagh and M. L. Healy, et al., Technology Insight: measuring prolactin in clinical samples, Nat. Rev. Endocrinol., 2007, 3, 279–289, DOI:10.1038/ncpendmet0447.
- K. Ghazal, S. Brabant, D. Prie and M. L. Piketty, Hormone Immunoassay Interference: A 2021 Update, Ann. Lab. Med., 2022, 42(1), 3–23, DOI:10.3343/alm.2022.42.1.3.
- V. Raverot, P. Perrin, P. Chanson, E. Jouanneau, T. Brue and G. Raverot, Prolactin immunoassay: does the high-dose hook effect still exist?, Pituitary, 2022, 25(4), 653–657, DOI:10.1007/s11102-022-01246-8.
- N. Kuhar, S. Sil and S. Umapathy, Potential of Raman Spectroscopic Techniques to Study Proteins, Spectrochim. Acta, Part A, 2021, 258, 119712, DOI:10.1016/j.saa.2021.119712.
- H. J. Butler, L. Ashton, B. Bird, G. Cinque, K. Curtis, J. Dorney, K. Esmonde-White, N. J. Fullwood, B. Gardner and P. L. Martin-Hirsch, et al., Using Raman Spectroscopy to Characterize Biological Materials, Nat. Protoc., 2016, 11, 664–687, DOI:10.1038/nprot.2016.036.
- B. Sharma, R. R. Frontiera, A.-I. Henry, E. Ringe and R. P. Van Duyne, SERS: Materials, Applications, and the Future, Mater. Today, 2012, 15, 16–25, DOI:10.1016/S1369-7021(12)70017-2.
- L. M. Almehmadi, S. M. Curley, N. A. Tokranova, S. A. Tenenbaum and I. K. Lednev, Surface Enhanced Raman Spectroscopy for Single Molecule Protein Detection, Sci. Rep., 2019, 9(1), 12356, DOI:10.1038/s41598-019-48650-y.
- M. A. Tahir, N. E. Dina, H. Cheng, V. K. Valev and L. Zhang, Surface-Enhanced Raman Spectroscopy for Bioanalysis and Diagnosis, Nanoscale, 2021, 13, 11593–11634, 10.1039/D1NR00708D.
- G. Wang, C. Hao, W. Ma, A. Qu, C. Chen, J. Xu, C. Xu, H. Kuang and L. Xu, Chiral plasmonic triangular nanorings with SERS activity for ultrasensitive detection of amyloid proteins in Alzheimer's disease, Adv. Mater., 2021, 2102337, DOI:10.1002/adma.202102337.
- L. Mulfinger, S. D. Solomon, M. Bahadory, A. V. Jeyarajasingam, S. A. Rutkowsky and C. Boritz, Synthesis and Study of Silver Nanoparticles, J. Chem. Educ., 2007, 84(2), 322, DOI:10.1021/ed084p322.
- J. A. Creighton and R. Withnall, The Raman spectrum of gallium metal, Chem. Phys. Lett., 2000, 326(3–4), 311–313, DOI:10.1016/S0009-2614(00)00782-X.
- A. Kumar and C. Kumar Dixit, Methods for characterization of nanoparticles, Adv. Nanomed. Delivery Ther. Nucleic Acids, 2017, 43–58, DOI:10.1016/B978-0-08-100557-6.00003-1.
- M. Wojdyr, Fityk: A General-Purpose Peak Fitting Program, J. Appl. Crystallogr., 2010, 43(5), 1126–1128, DOI:10.1107/S0021889810030499.
- J. Zhao, H. Lui, D. I. McLean and H. Zeng, Automated Autofluorescence Background Subtraction Algorithm for Biomedical Raman Spectroscopy, Appl. Spectrosc., 2007, 61, 1225–1232, DOI:10.1366/000370207782597003.
- R. Cabrera-Alonso, E. Guevara, M. G. Ramírez-Elías, B. Moncada and F. J. González, Detection of Hydroquinone by Raman Spectroscopy in Patients with Melasma before and after Treatment, Sking Res. Technol., 2019, 25, 20–24, DOI:10.1111/srt.12589.
- L. Cai, G. Fang, J. Tang, Q. Cheng and X. Han, Label-Free Surface-Enhanced Raman Spectroscopic Analysis of Proteins: Advances and Applications, Int. J. Mol. Sci., 2022, 23(22), 13868, DOI:10.3390/ijms232213868.
- D. Kurouski, T. Postiglione, T. Deckert-Gaudig, V. Deckert and I. K. Lednev, Amide I vibrational mode suppression in surface (SERS) and tip (TERS) enhanced Raman spectra of protein specimens, Analyst, 2013, 138(6), 1665–1673 RSC.
- S. M. Rolfe, M. R. Patel, I. Gilmour, K. Olsson-Francis and T. J. Ringrose, Defining Multiple Characteristic Raman Bands of α-Amino Acids as Biomarkers for Planetary Missions Using a Statistical Method, Origins Life Evol. Biospheres, 2016, 46(2–3), 323–346, DOI:10.1007/s11084-015-9477-7.
- Z. Movasaghi, S. Rehman and I. U. Rehman, Raman Spectroscopy of Biological Tissues, Appl. Spectrosc. Rev., 2007, 42, 493–541, DOI:10.1080/05704920701551530.
- G. Zhu, X. Zhu, Q. Fan and X. Wan, Raman Spectra of Amino Acids and Their Aqueous Solutions, Spectrochim. Acta, Part A, 2011, 78, 1187–1195, DOI:10.1016/j.saa.2010.12.079.
- F. Wei, D. Zhang, N. J. Halas and J. D. Hartgerink, Aromatic Amino Acids Providing Characteristic Motifs in the Raman and SERS Spectroscopy of Peptides, J. Phys. Chem. B, 2008, 112, 9158–9164, DOI:10.1021/jp8025732.
- N. Kuhar, S. Sil, T. Verma and S. Umapathy, Challenges in Application of Raman Spectroscopy to Biology and Materials, RSC Adv., 2018, 8, 25888–25908, 10.1039/C8RA04491K.
- Z. Davoudi, F. Araghi, M. Vahedi, N. Mokhtari and M. Gheisari, Prolactin Level in Polycystic Ovary Syndrome (PCOS): An approach to the diagnosis and management, Acta Biomed., 2021, 92(5), e2021291, DOI:10.23750/abm.v92i5.9866.
- R. S. Auriemma, R. Pirchio, C. Pivonello, F. Garifalos, A. Colao and R. Pivonello, Approach to the Patient With Prolactinoma, J. Clin. Endocrinol. Metab., 2023, 108(9), 2400–2423, DOI:10.1210/clinem/dgad174.
- M. Pirzada and Z. Altintas, Nanomaterials for Healthcare Biosensing Applications, Sensors, 2019, 19(23), 5311, DOI:10.3390/s19235311.
- I. Irkham, A. U. Ibrahim, P. C. Pwavodi, F. Al-Turjman and Y. W. Hartati, Smart Graphene-Based Electrochemical Nanobiosensor for Clinical Diagnosis: Review, Sensors, 2023, 23(4), 2240, DOI:10.3390/s23042240.
- S. M. Sheta, S. M. El-Sheikh and M. M. Abd-Elzaher, A novel optical approach for determination of prolactin based on Pr-MOF nanofibers, Anal. Bioanal. Chem., 2019, 411(7), 1339–1349, DOI:10.1007/s00216-018-01564-6.
- L. Jensen, C. M. Aikens and G. C. Schatz, Electronic Structure Methods for Studying Surface-Enhanced Raman Scattering, Chem. Soc. Rev., 2008, 37, 1061, 10.1039/b706023h.
- N. E. Markina, I. Y. Goryacheva and A. V. Markin, Amplification of SERS Signal of Methotrexate Using Beta-Cyclodextrin Modified Silver Nanoparticles, Colloids Interfaces, 2023, 7(2), 42, DOI:10.3390/colloids7020042.
- B. Sharma, R. R. Frontiera, A. I. Henry, E. Ringe and R. P. Van Duyne, SERS: Materials, applications, and the future, Mater. Today, 2021, 15(1–2), 16–25, DOI:10.1016/S1369-7021(12)70017-2.
- A. I. Pérez-Jiménez, D. Lyu, Z. Lu, G. Liu and B. Ren, Surface-enhanced Raman spectroscopy: benefits, trade-offs, and future developments, Chem. Sci., 2020, 11(18), 4563–4577, 10.1039/D0SC00809E.
- H. Shin, H. Jeong, J. Park, S. Hong and Y. Choi, Correlation between cancerous exosomes and protein markers based on Surface-Enhanced Raman Spectroscopy (SERS) and Principal Component Analysis (PCA), ACS Sens., 2018, 3(12), 2637–2643, DOI:10.1021/acssensors.8b01047.
- A. Barucci, C. D'Andrea, E. Farnesi, M. Banchelli, C. Amicucci, M. de Angelis, B. Hwang and P. Matteini, Label-free SERS detection of proteins based on machine-learning classification of chemo-structural determinants, Analyst, 2021, 146(2), 674–682, 10.1039/d0an02137g.
- Y. Wang, L. J. Tang and J. H. Jiang, Surface-enhanced Raman spectroscopy-based, homogeneous, multiplexed immunoassay with antibody-fragments-decorated gold nanoparticles, Anal. Chem., 2013, 85(19), 9213–9220, DOI:10.1021/ac4019439.
- H. J. Ryu, W. K. Lee, Y. H. Kim and J. S. Lee, Interfacial interactions of SERS-active noble metal nanostructures with functional ligands for diagnostic analysis of protein cancer markers, Mikrochim. Acta, 2021, 188(5), 164, DOI:10.1007/s00604-021-04807-z.
Footnote |
| † Electronic supplementary information (ESI) available. See DOI: https://doi.org/10.1039/d3ra06366f |
| This journal is © The Royal Society of Chemistry 2024 |