
 Open Access Article
 This Open Access Article is licensed under a Creative Commons Attribution-Non Commercial 3.0 Unported Licence
Rheological and radioactive decontamination properties of ethyl cellulose sols in green solvents at a temperature below 0 °C†
Xunhai Panab,
Xiaoyan Lin *ac,
Hao Zhanga,
Lili Lianga,
Chunxia Pangab,
Kai Gua,
Yang Hua and
Hailing Xi*d
*ac,
Hao Zhanga,
Lili Lianga,
Chunxia Pangab,
Kai Gua,
Yang Hua and
Hailing Xi*d
aSchool of Materials and Chemistry, Southwest University of Science and Technology, 621010 Mianyang, Sichuan, China. E-mail: lxy20100205@163.com
bSchool of Bioengineering, Sichuan University of Science and Engineering, 644005 Yibin, Sichuan, China
cEngineering Research Center of Biomass Materials, Ministry of Education, Southwest University of Science and Technology, 621010 Mianyang, Sichuan, China
dState Key Laboratory of NBC Protection for Civilian, 102205 Beijing, China. E-mail: fhxihl@163.com
First published on 23rd January 2024
Abstract
Strippable film decontamination has been considered one of the best prospects for radioactive surface decontamination due to its high decontamination effect and less secondary pollution. However, research into strippable films has until now focused on radioactive decontamination at room temperature. Therefore, it is vital to seek a suitable degradable material for preparing strippable films in removing contaminants in an extremely cold region, as it will face the problem of the freezing of the detergent. Ethyl cellulose (EC) is a kind of degradable biopolymer which is easily dissolved in volatile green organic solvents to form a sol below 0 °C which is advantageous for forming a film. Therefore, it would be the best choice for preparing a strippable film detergent. In this study, EC sols were obtained by placing EC powder into the green solvents anhydrous ethanol and ethyl acetate. The steady and dynamic rheological behavior of EC sols was investigated with a rotary rheometer with the temperature ranging from −10 °C to 0 °C to disclose their spraying performance. Moreover, the radioactive decontamination effect of EC sols and the mechanism were also investigated. The results showed that the EC sols were pseudoplastic fluids which obeyed the Ostwald–de Waele power law below 0 °C. Furthermore, the viscosity of EC sols could be reduced by stirring, which is convenient for large-area spraying during decontamination below 0 °C. At −10 °C, the comprehensive decontamination rates of all plates were over 85%. Therefore, EC sols could be used as a basic material for strippable film decontamination below 0 °C.
1. Introduction
To face the energy crisis, nuclear power, as a stable form of green energy, has been extensively developed for decades.1 However, nuclear accidents along with radioactive waste pose a great threat to humans and the environment. The Chernobyl and Fukushima nuclear accidents caused serious pollution to the environment around them, which did a great deal of harm to human health.2–6 The Fukushima nuclear disaster resulted from an inadequate nuclear emergency response.7 Therefore, it is of great significance to deal with radioactive contamination promptly for the protection of the environment and human society.At present, there are many surface decontamination technologies, including chemical or physical methods, supercritical fluid methods, electrochemical methods, laser methods, stripping film methods and foam methods.8–14 Among these methods, the stripping film method is a promising method for decontaminating radioactive pollutants due to its high decontamination rate and less secondary pollution.15,16 Stripping film decontaminating technologies at room temperature have already been extensively reported and discussed.17–21 However, there are few reports on stripping film decontamination at temperatures below 0 °C.16,22 It is urgent to develop a stripping film decontaminating material to be applied below 0 °C because of the poor spraying properties in a low-temperature environment. At the same time, it is very important to minimize the volume of decontaminating film in order to reduce the costs of storage, transportation and disposal after decontamination. The degradation of decontaminating film is one important method to minimize the volume. Therefore, the preparation of decontaminating film should apply a degradable material to minimize the volume. Biomass-based materials, due to their degradable properties, have become the prospective choice for preparing detergents.
Cellulose, as a kind of biodegradable polymer which is renewable and widely available, has aroused great interest from researchers.23 While ethyl cellulose (EC) obtained from the modification of cellulose, which is also degradable, has been widely used in film, textile, food, pharmaceutical, and coating applications.24–28 Besides, EC could be dissolved in a green organic solvent such as ethyl acetate and so could be volatile and flow at low temperature. Therefore, it has probably become the most preferred basic material in preparing a strippable film. To perform decontamination at low temperature successfully, it is necessary to understand the rheological behavior of EC sols at low temperature. The rheological behavior of cellulose dissolved in ionic liquids (ILs) has been carefully researched.29–31 The effect of the rheological behavior of inks which contained 6–15 wt% of cellulose nanocrystals (CNC) on 3D-printability has been evaluated.32 The rheological behavior of some cellulose derivatives has also been studied. For example, the rheological behavior of hydroxypropyl cellulose (HPC) solution and hydroxy ethyl cellulose (HEC) dispersions has been studied.33,34 The rheological properties of ceramic pastes together with EC dissolved in ethylene glycol monobutyl ether acetate were investigated by K. Inukai et al.35 However, understanding of the properties of EC sols has been rather limited until now, especially in the case of organic solvents at a temperature below 0 °C. Moreover, the decontamination characteristics and rheological properties of EC sols at low temperature have rarely been reported. Therefore, it is very important to know the characteristic of EC sols at a temperature below 0 °C.
In this study, EC sols were prepared by dissolving EC in green volatile organic solvents of anhydrous ethanol and ethyl acetate which had the characteristics of low freezing and rapid volatilization. The spraying properties were analyzed by investigating the rheological behavior of EC sols at a low temperature below 0 °C. The radioactive decontamination efficiencies of EC sols on different kinds of plates at −10 °C were also studied. The results of the rheological behavior and decontamination properties of EC sols revealed that the EC sols have extensive application prospects in strippable film decontamination at low temperatures below 0 °C.
2. Materials and methods
2.1 Materials
Anhydrous ethanol, ethyl acetate, ChengDu Chron Chemicals Co., Ltd.; ethyl cellulose (intrinsic viscosity 90–110 mPa s; 5% in toluene/isopropanol 80![[thin space (1/6-em)]](https://www.rsc.org/images/entities/char_2009.gif) :20 (v/v)), Shanghai Aladdin Biochemical Technology Co., Ltd.; uranyl nitrate, Chushengwei Chemical Co., Ltd. All reagents were analytically pure (AR).
:20 (v/v)), Shanghai Aladdin Biochemical Technology Co., Ltd.; uranyl nitrate, Chushengwei Chemical Co., Ltd. All reagents were analytically pure (AR).
Ethyl cellulose (EC) sols were obtained by dissolving a certain amount of EC in a mixed solvent of anhydrous ethanol and ethyl acetate. The EC sols were stirred at room temperature for 12 h in a flask to make the sol homogeneous. The content of anhydrous ethanol in the mixed solvent was 10% (v/v).
2.2 Methods
The decontamination rate (DR) was calculated in accordance with eqn (1):
 | (1) |
3. Results and discussion
3.1 Study of rheological properties with a steady shear rate
It is known that the leveling, sagging and spraying properties of the detergents could be reflected in the rheological properties, which are significantly affected by the polymer concentration and environmental temperature. Furthermore, a favorable detergent applied at low temperature should have good fluidity for easy spraying. Therefore, it is necessary to understand the rheological behavior of EC sols at low temperature to perform decontamination at low temperature successfully. The steady shear rheological properties of the EC sols at a temperature below 0 °C were studied by applying a rotary rheometer, and the rheological curves of the EC sols are shown in Fig. 1.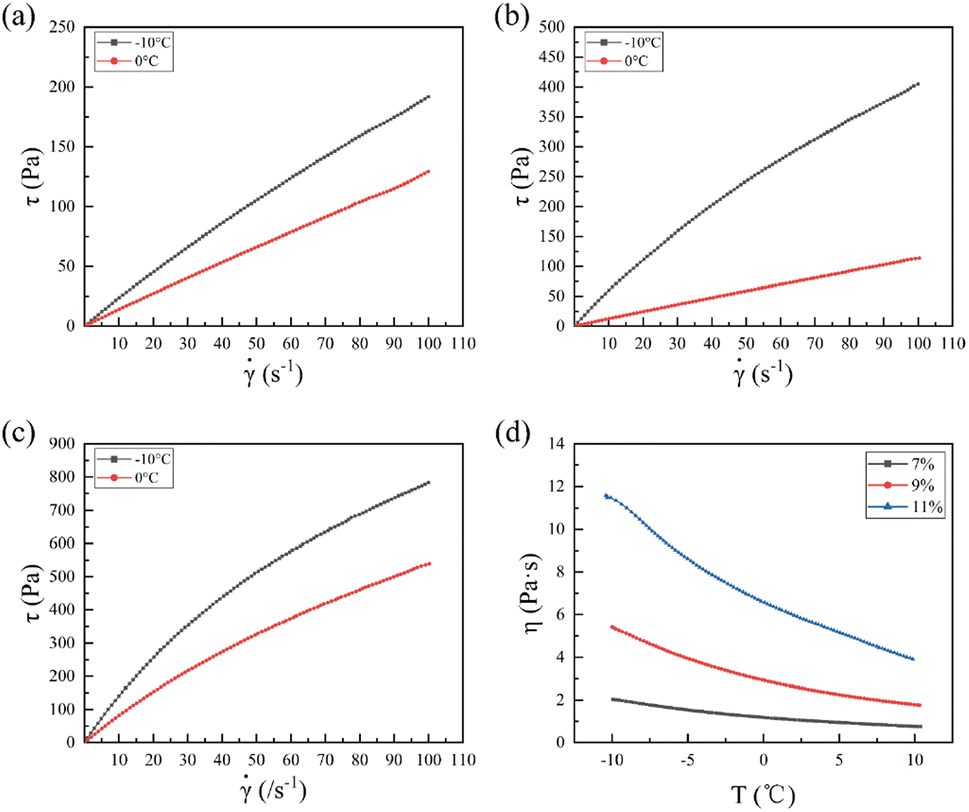 | ||
Fig. 1 Variation of shear stress (τ) along with shear rate (![[small gamma, Greek, dot above]](https://www.rsc.org/images/entities/i_char_e0a2.gif) ) for (a) 7 wt% EC sol, (b) 9 wt% EC sol, (c) 11 wt% EC sol. (d) The viscosity (η) changes of the EC sols with change in temperature. ) for (a) 7 wt% EC sol, (b) 9 wt% EC sol, (c) 11 wt% EC sol. (d) The viscosity (η) changes of the EC sols with change in temperature. | ||
Fig. 1(a)–(c) show the variation in shear stress (τ) along with shear rate () (0.1–100 s−1) for 7 wt% EC sol, 9 wt% EC sol, and 11 wt% EC sol at temperatures of 0 °C and −10 °C, respectively. It was obvious that the shear stress of the three kinds of EC sol increased with the increase in shear rate, temperature (T) and EC concentration. Meanwhile, the shear stress of the EC sol at −10 °C was greater than that of the EC sol at 0 °C under the same shear rate. Contrasting Fig. 1(a)–(c), the relationship between shear stress and shear rate of the sol with 7 wt% EC was close to linear. In contrast, the flow curve of shear stress along with shear rate became more nonlinear with increasing EC concentration. Accordingly, the slope of the shear stress versus shear rate (τ ∼ ) curve decreased with increasing shear rate, which indicated that the EC sols showed shear rate dependency,36 and the EC sols showed shear thinning characteristics. This confirmed that the EC sol is a pseudoplastic fluid, a kind of non-Newtonian fluid. Additionally, the viscosity of the EC sols could be reduced by stirring, which was convenient for large-area spraying during decontamination at a temperature below 0 °C.
Regression analysis was conducted on the relevant experimental data using the Ostwald–de Waele power law,37 as shown in eqn (2):
|
τ = kn
| (2) |
is the shear rate and n is the flow behavior index.
The parameters shown in Table 1, calculated according to eqn (2), show that the rheological properties of the EC sols were classical shear thinning behavior. Besides, the relationship between the shear stress (τ) and the shear rate () could fit well with the Ostwald–de Waele power law.
| Sample | Conc. (wt%) | Temperature (°C) | Rheological parameters | ||
|---|---|---|---|---|---|
| k | n | R2 | |||
| EC sols | 7 | −10 | 2.5309 | 0.9504 | 0.9992 |
| 0 | 1.4409 | 0.9778 | 0.9999 | ||
| 9 | −10 | 6.6625 | 0.9137 | 0.9958 | |
| 0 | 1.2405 | 0.9864 | 0.9997 | ||
| 11 | −10 | 16.9060 | 0.8660 | 0.9890 | |
| 0 | 9.9940 | 0.8858 | 0.9970 | ||
The greater the viscosity of the sol, the greater the viscosity coefficient (k). As shown in Table 1, the viscosity coefficient (k) of the sol with 7 wt% EC decreased from 2.5309 at −10 °C to 1.4409 at 0 °C, and the viscosity coefficient (k) of the sol with 9 wt% EC decreased from 6.6625 at −10 °C to 1.2405 at 0 °C. The viscosity coefficient (k) of the sol with 11 wt% EC decreased from 16.9060 at −10 °C to 9.9940 at 0 °C, which indicated that the viscosity of the EC sols decreased as the temperature increased and the concentration of EC decreased.
The smaller the flow behavior index (n), the stronger the non-Newtonian property of the sol. Table 1 shows that the n values of the sol with 7 wt% EC at −10 °C and 0 °C were greater than 0.9504, that is, close to 1. Moreover, the n of the sol with 7 wt% EC was not obviously changed with temperature, and the non-Newtonian property of the sol with 7 wt% EC was low. The reason could be that the probability of overlapping and entangling between EC polymer chains was less in a dilute solution.
As shown in Table 1, the n values of the sol with 9 wt% EC were greater than those of the sol with 11 wt% EC at −10 °C and 0 °C, respectively. The n of the sol decreased, and the non-Newtonian property increased with increasing EC concentration. The n values of the sols with 9 wt% EC and 11 wt% EC increased with increasing temperature. The thermal motion of the molecular chain segments accelerated, and the intermolecular force decreased with increasing temperature. The viscosity of the EC sols decreased as the temperature increased, and the EC sols showed less non-Newtonian properties but more Newtonian properties.
Fig. 1(d) shows the viscosity changes in EC sols with the temperature ranging from −10 °C to 0 °C. The viscosity of 7 wt% EC sol increased from 1.1766 Pa s to 2.0400 Pa s when the temperature was reduced from 0 °C to −10 °C. In comparison, the viscosity of the sol with 9 wt% EC increased from 2.9110 Pa s to 5.4310 Pa s when the temperature was reduced within the same testing range, while the sol viscosity of 11 wt% EC increased from 6.5566 Pa s to 11.4700 Pa s. This could be explained by the molecular chain moving more slowly at the lower temperature together with shrinkage of the polymer chains, resulting in tight winding and overlapping between polymer chains and the enhancing of intermolecular interaction, finally leading to increasing viscosity with decreasing temperature. In contrast, the molecular thermodynamic movement in the sol quickened with increasing temperature, and the interaction between the polymer chains of EC was weakened, which led to the loose winding of the polymer chains and finally to the decrease in viscosity. Fig. 1(d) also shows that the viscosity of EC sols increased with increasing EC concentration at the same temperature. The reason could be that the probability of overlapping and entangling between EC polymer chains increased with increasing EC concentration, and the interaction between polymer chains increased.
3.2 Dynamic oscillation rheological behavior of EC sols
The storage modulus (G′) and loss modulus (G′′) of the EC sols with changes in frequency at temperatures of −10 °C and 0 °C are shown in Fig. 2.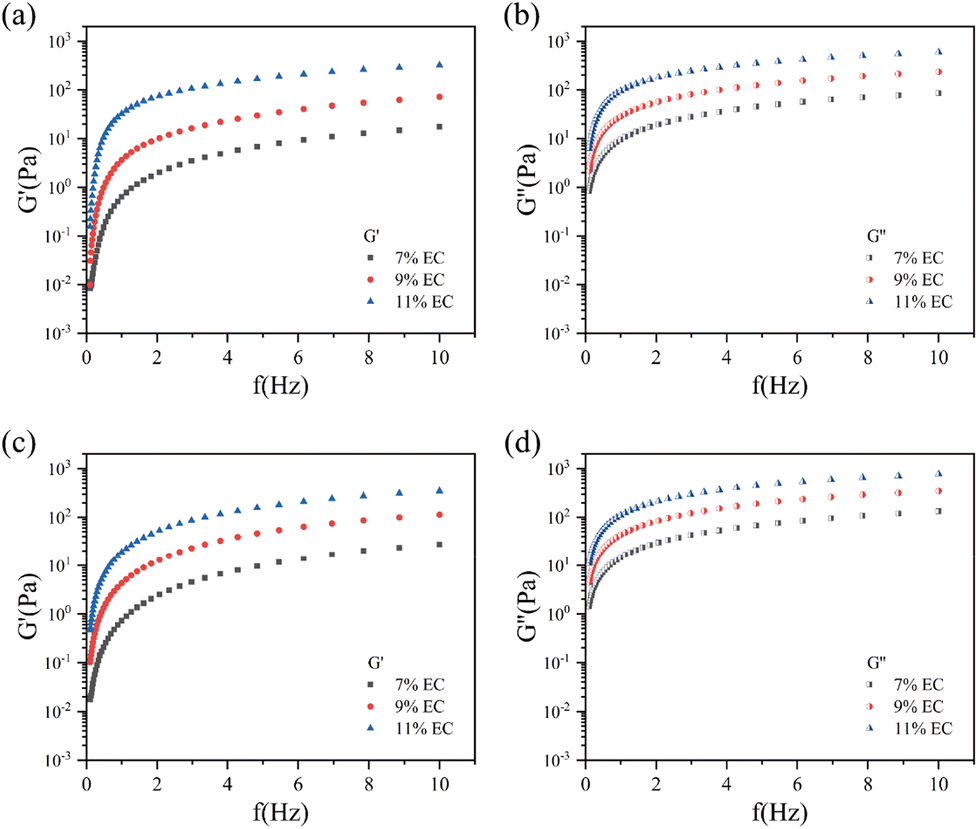 | ||
| Fig. 2 Storage modulus (G′) and loss modulus (G′′) for the EC sols with changing frequency (f) at temperatures of (a) and (b) 0 °C and (c) and (d) −10 °C, respectively. | ||
It was obvious that the G′ and G′′ of the three kinds of EC sols increased with increasing frequency. The G′ and G′′ increased more quickly when the frequency was low, and increased more slowly at higher frequency. At the same frequency, the G′ and G′′ of the EC sols always decreased in the order of 11 wt% EC, 9 wt% EC, 7 wt% EC, at temperatures of 0 °C and −10 °C. At the temperature of 0 °C, with the decrease in EC concentration from 11 wt% to 7 wt%, the G′ of the EC sol decreased from 320.80 Pa to 17.50 Pa, and the G′′ of the EC sol decreased from 598.80 Pa to 85.81 Pa at the frequency of 10 Hz. At the temperature of −10 °C, with the decrease in EC concentration from 11 wt% to 7 wt%, the G′ of the EC sol decreased from 346.70 Pa to 27.41 Pa, and the G′′ of the EC sol decreased from 774.50 Pa to 134.20 Pa at the frequency of 10 Hz.
Fig. 3 shows the complex viscosity (|η*|) for the EC sols with changing frequency at 0 °C and −10 °C.
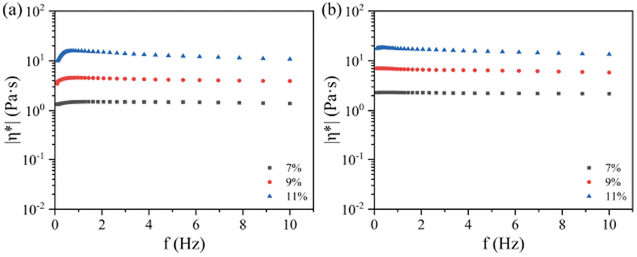 | ||
| Fig. 3 Complex viscosity (|η*|) of the EC sols with changing frequency at (a) 0 °C, (b) −10 °C. | ||
At the same frequency, the complex viscosity of the EC sols always decreased in the order of 11 wt% EC, 9 wt% EC, 7 wt% EC, at temperatures of 0 °C and −10 °C. The complex viscosity for the samples showed a plateau while the frequencies were low, which indicated that chain entanglement occurred.38 The complex viscosity (|η*|) increased with increasing concentration of EC, because the higher concentration of EC produced many entanglements in the sols. At higher frequency, the complex viscosity of the EC sols decreased little with further increase in the frequency. The complex viscosity of EC sols showed a constant value at higher frequencies below 0 °C.
Fig. 4 shows the G′ and G′′ of the EC sols with 7 wt%, 9 wt%, and 11 wt% EC as a function of temperature ranging from −10 °C to 0 °C.
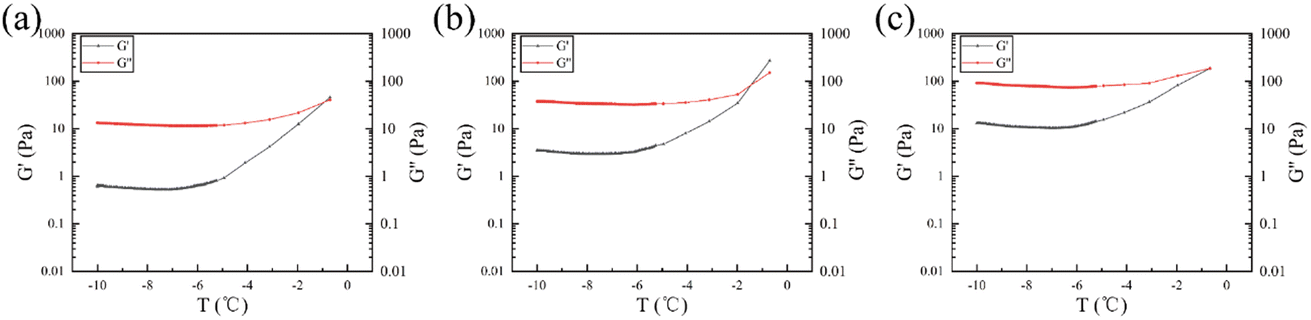 | ||
| Fig. 4 G′ and G′′ of the EC sols with changing temperature: (a) 7 wt% EC sol. (b) 9 wt% EC sol. (c) 11 wt% EC sol. | ||
As shown in Fig. 4, the G′ of the sols with 7 wt%, 9 wt%, and 11 wt% EC were almost all less than their G′′ when the temperature ranged from −10 to 0 °C. The result showed that the EC sols mainly exhibited viscous behavior and they could flow and be favorable for spraying above −10 °C.
3.3 Radioactive decontamination by EC sols and its mechanism
The film-forming properties of EC sols were studied by pouring the EC sols over the surfaces of marble, ceramic tile, glass, stainless steel and concrete to be dried and form films at −10 °C, 0 °C and room temperature, respectively. The film-forming properties were observed and recorded every two hours. The results showed that the film-forming time of the EC sols was shorter with higher drying temperature. The film-forming time of the EC sols was about 4 hours at room temperature and about 22 hours at −10 °C. To ensure that the EC sols are completely dry at −10 °C, 24 h was chosen for the drying time of the EC sols. Fig. S1† shows photographic images of the EC films after the EC sols had been dried for 24 h. After the EC sols had been dried, the EC films are almost self-peeling off the surface of marble, ceramic tile, glass and stainless steel, and are very easy to peel off. The EC film cannot be self-peeled off the concrete surface, but it can be peeled off completely.
Fig. 5 shows the changes in the decontamination rate of the 9 wt% EC sol on different plates as a function of spraying dose at −10 °C. As shown in Fig. 5, the α decontamination rates (α DR) on marble, ceramic tile, glass, and stainless steel changed little with spraying dose in the range of 7–13 mL/100 cm2. While the α DR on concrete shows a great change with spraying dose. The β decontamination rate (β DR) on the above five plates shows a great change with the spraying dose in the range of 7–13 mL/100 cm2. Considering the decontamination rate and economy, the optimal spraying dose of the EC sols is 10 mL/100 cm2.
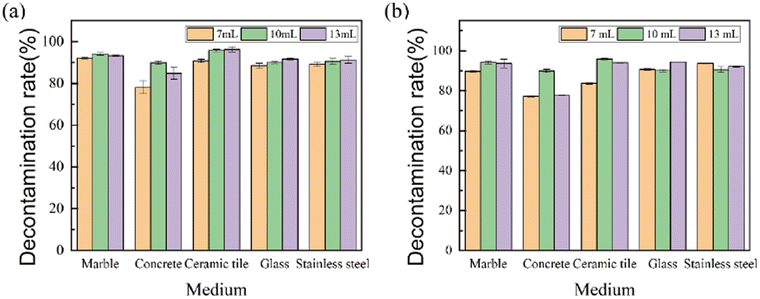 | ||
| Fig. 5 Changes in the decontamination rate of 9 wt% EC sol as a function of spraying dose on different plates at −10 °C: (a) α DR, (b) β DR. | ||
The decontaminating properties of EC sols at −10 °C for radioactive contaminants on different plates were investigated with the dose of EC sols being 10 mL/100 cm2. The decontamination rates of the EC sols are shown in Fig. 6.
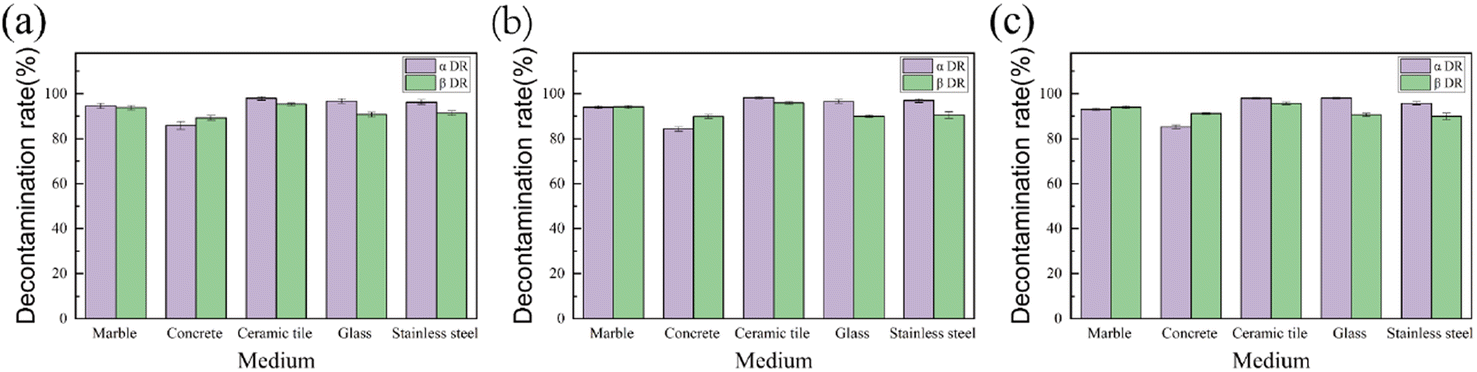 | ||
| Fig. 6 Decontamination rate on different plates at −10 °C: (a) 7 wt% EC sol, (b) 9 wt% EC sol, (c) 11 wt% EC sol. | ||
Fig. 6(a) shows that the α DR and β DR of the 7 wt% EC sol on the concrete plate at −10 °C were 85.80% and 89.19%, respectively. The α DR and β DR on the other plates were all over 90.00%. The comprehensive decontamination rates on different plates for the 7 wt% EC sol decreased according to the following rules: ceramic tile > marble > glass > stainless steel > concrete. In contrast, the α DR and β DR on the concrete plate were 84.30% and 89.84%, respectively, as shown in Fig. 6(b) when the EC sol was 9 wt%. Additionally, the β DR on the glass plate was 89.97% while they were all over 90% on the other three plates. The comprehensive decontamination rate on different plates for the 9 wt% EC sol decreased according to the following rules: ceramic tile > marble > stainless steel > glass > concrete. Fig. 6(c) shows that, at −10 °C, the α DR of the 11 wt% EC sol on the concrete plate was only 85.23%, and the β DR on the stainless steel plate was 89.87%, while the other values were all over 90%. The comprehensive decontamination rate on different plates for the 11 wt% EC sol decreased according to the following rules: ceramic tile > glass > marble > stainless steel > concrete. When the concentration of EC in the sol rises from 7 to 11 wt%, the α DR and β DR of the EC sols on all five different kinds of surface changed little. Moreover, the comprehensive decontamination rate on concrete was over 85% while it was over 90% on the other four kinds of plate.
Fig. S2† shows the decontamination rates of the EC sols at room temperature. Obviously, the decontaminating properties of EC sols at room temperature are below those at a temperature below 0 °C.
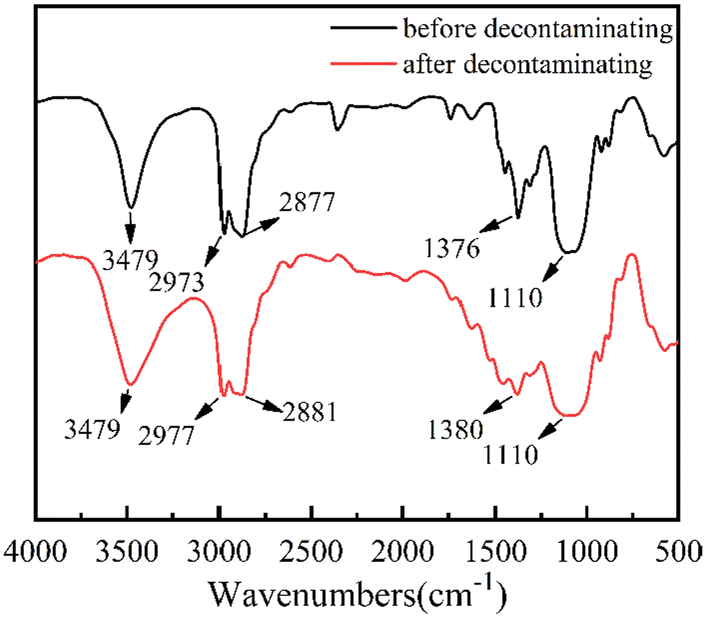 | ||
| Fig. 7 A comparison of the FTIR spectra of EC films. | ||
As depicted in Fig. 7, the adsorption peak at 3479 cm−1 was assigned to O–H stretching vibration in the EC chains,40,41 and the adsorption peaks at 2973 cm−1 and 2877 cm−1 were attributed to the stretching vibration of methyl and methylene groups.25 The adsorption peak at 1376 cm−1 was related to the C–H bending vibration.42 The broad absorption band at 1110 cm−1 was associated with the C–O stretching vibration.43,44 In comparison, the adsorption peaks of the EC films after decontamination, shown in Fig. 7 at 3479 cm−1, 2973 cm−1, 2877 cm−1, 1376 cm−1 and 1110 cm−1, changed little, which confirmed the stability of the EC films.
The changes in the morphological structure of the EC films were investigated by comparing the SEM images of the EC films before and after decontamination, as shown in Fig. 8.
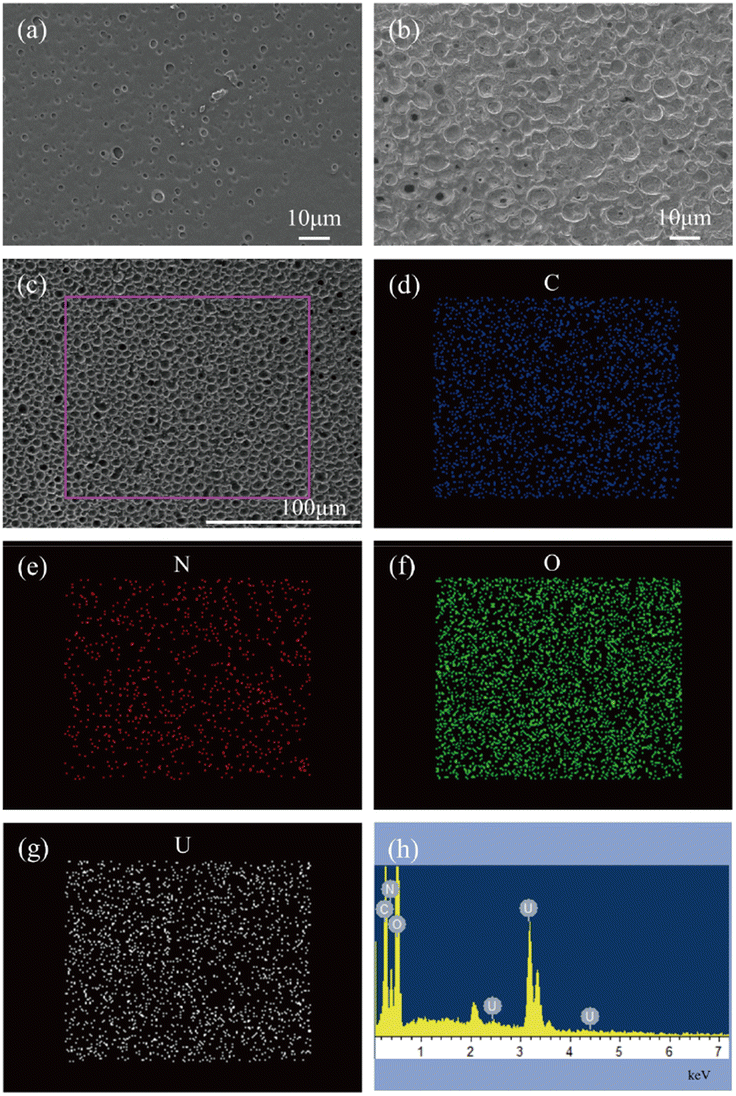 | ||
| Fig. 8 Characterization. SEM micrographs of EC film before decontamination (a) and after decontamination (b) and (c); mapping images of the selected region of the EC film (d)–(g); EDS of the selected region of the EC film (h). | ||
As demonstrated in Fig. 8(a), the SEM images indicate that the surface of the EC film before decontamination is smooth and there were some small pores distributed uniformly in the film, which was advantageous for the contaminants being enveloped and fixed on the EC film. However, the pores became fewer, and many uniform craters appeared in the film after decontamination (Fig. 8(b) and (c)). One reason might be that uranyl ions were complexed with O–H in the EC polymer chains, and an EC–U complex, centered on the uranyl ion, was formed between multiple EC polymer chains. So, the distance between different EC polymer chains became narrow, and the EC polymer chains further interacted to form a uniform and fine network structure. The elemental mapping images (Fig. 8(d)–(g)) and energy dispersive spectroscopy (Fig. 8(h)) demonstrate that the elements of the EC film after decontamination are C, O, N, and U. The simulated uranium contamination is dispersed into the EC film.
Fig. 9 shows X-ray photoelectron spectroscopy (XPS) analysis of the EC film after decontamination.
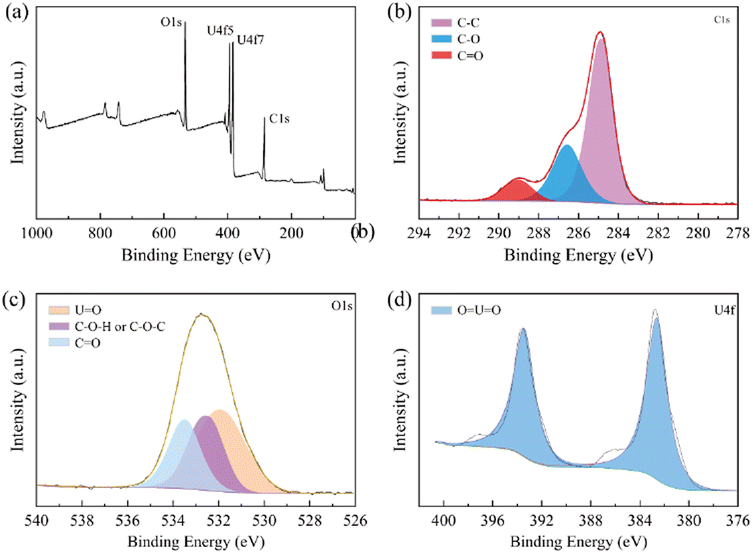 | ||
| Fig. 9 XPS spectra of EC film after decontamination: (a) full spectrum; (b) C 1s spectrum; (c) O 1s spectrum; (d) U 4f spectrum. | ||
The overall spectrum (Fig. 9(a)) shows the main constituent elements of the EC film after decontamination, where the peaks around 285, 383 and 533 were C, U and O, respectively. As for the C 1s spectrum (Fig. 9(b)), the peaks at 284.8 eV, 286.6 eV and 289.0 eV represent C–C, C–O and C![[double bond, length as m-dash]](https://www.rsc.org/images/entities/char_e001.gif) O.45 Fig. 9(c) shows the peak fitting diagram for O 1s, in which the O 1s spectrum was divided into three main peaks at 531.9 eV, 532.5 eV and 533.5 eV corresponding to UO, C–O–H or C–O–C, and CO, respectively. Fig. 9(d) shows the double peak of U 4f of UO22+ at 382.7 eV and 393.5 eV.41 Therefore, the XPS results illustrate that the simulated uranium contamination is in the EC films.
O.45 Fig. 9(c) shows the peak fitting diagram for O 1s, in which the O 1s spectrum was divided into three main peaks at 531.9 eV, 532.5 eV and 533.5 eV corresponding to UO, C–O–H or C–O–C, and CO, respectively. Fig. 9(d) shows the double peak of U 4f of UO22+ at 382.7 eV and 393.5 eV.41 Therefore, the XPS results illustrate that the simulated uranium contamination is in the EC films.
The decontamination mechanism of the EC sols was disclosed by comprehensive analysis of FTIR, SEM-EDS, XPS and decontamination efficiency results. The probable decontamination mechanism is illustrated in Fig. 10.
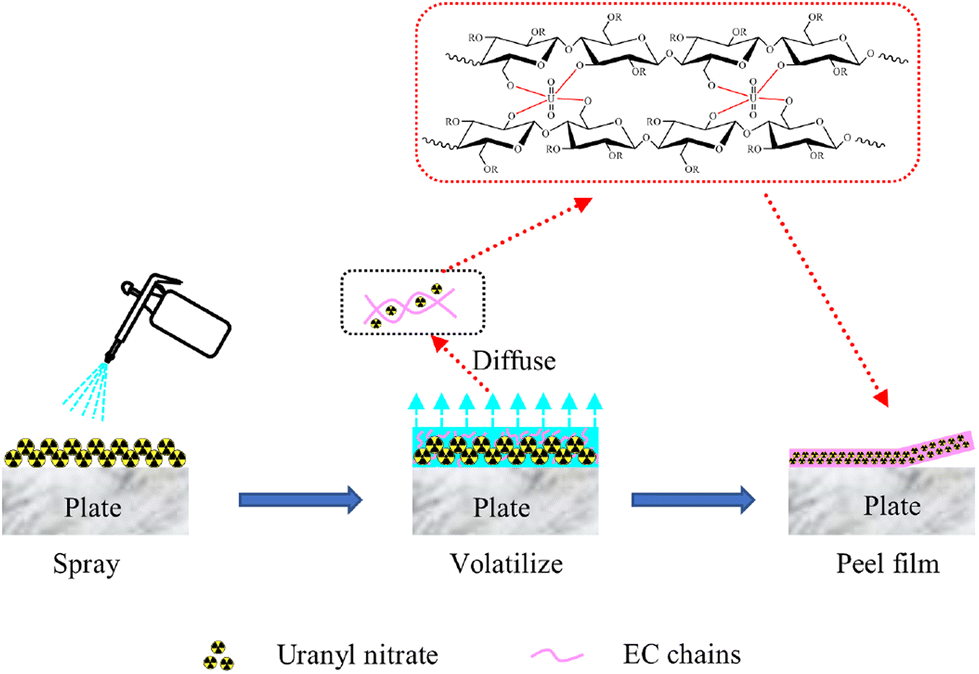 | ||
| Fig. 10 Schematic diagram of mechanism of decontamination. | ||
During the decontamination process, an EC sol layer formed after the sols had flowed and coated the different surfaces of the contaminants.16 As shown in Fig. 10, the uranyl nitrate would be wrapped and gradually dissolved into anhydrous ethanol in the sols and be diffused into the EC sols. Then the action of solvent volatilization would accelerate the diffusion of uranyl nitrate into the EC sol layer, together with the coordination action of the hydroxyl groups in the EC polymer chains, so the uranyl nitrates would finally be captured and then enter into the EC polymer chains. Besides, with the continuous volatilization of solvent, the solid content increased together with the continuous increase in EC sol viscosity, and the EC polymer chains appeared to be overlapping and entangled in concentrated sol. Moreover, an EC–U complex, centered around the uranyl ion, was formed between multiple EC polymer chains.
As a result, the EC sols gradually accumulated to form a uniform and fine network structure film, with the contaminants being encapsulated gradually and simultaneously fixed in the films.16 When the films were peeled off, the contaminants would be removed.
In conclusion, the decontamination mechanism of EC sols consisted of at least three actions: diffusion, complexation and embedding.
4. Conclusions
In this study, EC sols were prepared with EC being dissolved in green organic solvents of anhydrous ethanol and ethyl acetate. Analysis of rheological behavior disclosed that the EC sols were pseudoplastic fluids and obeyed the Ostwald–de Waele power law, when the temperature ranged from −10 °C to 0 °C. Besides, the viscosity of the EC sols decreased as the temperature increased and the EC concentration decreased. Furthermore, the viscosity of the EC sols could be reduced by stirring, which was convenient for large-area spraying during decontamination at a temperature below 0 °C. The EC polymer film was formed with the polymer chains of EC being crosslinked and solidified after volatilization of the solvent in the EC sols. Simultaneously, an EC–U complex was formed between multiple EC polymer chains centered around the uranyl ion. At the temperature of −10 °C, the comprehensive decontamination rates on marble, stainless steel, ceramic tile and glass plates were all over 90%, while that on concrete was over 85%. The decontamination mechanism of EC sols consisted of at least three actions: diffusion, complexation and embedding. The EC sols could be the best choice as a basic material for preparing a strippable film detergent in removing radioactive contaminants at low temperatures below 0 °C.Author contributions
Xunhai Pan: conceptualization, methodology, formal analysis, investigation, data curation, writing – original draft. Xiaoyan Lin: methodology, funding acquisition, writing – review & editing, project administration. Hao Zhang: formal analysis, investigation. Lili Liang: conceptualization, writing – review. Chunxia Pang: conceptualization, formal analysis. Kai Gu: investigation, data curation. Yang Hu: formal analysis, conceptualization. Hailing Xi: formal analysis, investigation, supervision.Conflicts of interest
There are no conflicts to declare.Acknowledgements
This work is financially supported by Institute of Chemical Defense, Academy of Military Sciences (TC19046DN/5) and Engineering Research Center of Biomass Materials, Ministry of Education, China.References
- R. Pravalie and G. Bandoc, J. Environ. Manage., 2018, 209, 81–92 CrossRef PubMed.
- K. Akahane, S. Yonai, S. Fukuda, N. Miyahara, H. Yasuda, K. Iwaoka, M. Matsumoto, A. Fukumura and M. Akashi, Sci. Rep., 2013, 3, 1670 CrossRef PubMed.
- N. A. Beresford, S. Fesenko, A. Konoplev, L. Skuterud, J. T. Smith and G. Voigt, J. Environ. Radioact., 2016, 157, 77–89 CrossRef CAS PubMed.
- S. Kim, B.-I. Min, K. Park, B.-M. Yang, J. Kim and K.-S. Suh, J. Radioanal. Nucl. Chem., 2018, 316, 1091–1098 CrossRef CAS.
- M. Lopez-Vicente, Y. Onda, J. Takahashi, H. Kato, S. Chayama and K. Hisadome, Environ. Pollut., 2018, 239, 448–456 CrossRef CAS.
- G. Steinhauser, A. Brandl and T. E. Johnson, Sci. Total Environ., 2014, 470, 800–817 CrossRef PubMed.
- H. Saito, Poetics, 2022, 93, 101594 CrossRef.
- P. Delaporte, M. Gastaud, W. Marine, M. Sentis, O. Uteza, P. Thouvenot, J. L. Alcaraz, J. M. Le Samedy and D. Blin, Appl. Surf. Sci., 2003, 208–209, 298–305 CrossRef CAS.
- G. Greifzu, T. Kahl, M. Herrmann, W. Lippmann and A. Hurtado, Opt. Laser Technol., 2019, 117, 293–298 CrossRef CAS.
- M. D. Kaminski, S. D. Lee and M. Magnuson, J. Hazard. Mater., 2016, 305, 67–86 CrossRef CAS PubMed.
- A. Wadood Khan, S. Kotta, S. Hussain Ansari, R. Kumar Sharma, V. Kumar, S. Rana and J. Ali, J. Renewable Sustainable Energy, 2012, 4, 012704 CrossRef.
- J. Wang, G. Q. Liu, L. Zhao, S. H. Wang and J. Li, J. Radioanal. Nucl. Chem., 2019, 322, 1049–1054 CrossRef CAS.
- H. M. Yang, C. W. Park and K. W. Lee, J. Hazard. Mater., 2019, 362, 72–81 CrossRef CAS PubMed.
- H. Zhang, H. Xi, Z. Li, X. Pan, Y. Wang, C. Chen, X. Lin and X. Luo, Colloids Surf., A, 2021, 624, 126774 CrossRef CAS.
- P. G. Wagle, S. S. Tamboli and A. P. More, Prog. Org. Coat., 2021, 150, 106005 CrossRef CAS.
- K. Zhang, S. Wang, Z. He, M. Wu and X. Cao, Appl. Radiat. Isot., 2020, 162, 109187 CrossRef CAS PubMed.
- Z. He, Y. Li, Z. Xiao, H. Jiang, Y. Zhou and D. Luo, Polymers, 2020, 12, 1556 CrossRef CAS PubMed.
- D. Pulpea, T. Rotariu, G. Toader, G. B. Pulpea, V. Neculae and M. Teodorescu, Chemosphere, 2020, 258, 127227 CrossRef CAS PubMed.
- H. M. Yang, C. W. Park and K. W. Lee, Prog. Nucl. Energy, 2018, 104, 67–74 CrossRef CAS.
- H.-M. Yang, K. S. Hwang, C. W. Park and K.-W. Lee, Ann. Nucl. Energy, 2017, 109, 359–364 CrossRef CAS.
- H.-M. Yang, I.-H. Yoon and Y. Lee, Chem. Eng. J., 2020, 402, 126299 CrossRef CAS.
- X. Xu, X. Pan, J. Li, Z. Li, Y. Xie and X. Lin, Chemosphere, 2022, 308, 136187 CrossRef CAS PubMed.
- F. Lu, J. Song, B. W. Cheng, X. J. Ji and L. J. Wang, Cellulose, 2013, 20, 1343–1352 CrossRef CAS.
- P. Filipa and S. Lúcia, Food Hydrocolloids, 2018, 84, 104–116 CrossRef.
- M. Li, J. L. Xia, C. X. Ding, W. Mao, H. Y. Ding, L. N. Xu and S. H. Li, Carbohydr. Polym., 2017, 175, 131–140 CrossRef CAS.
- A. Zaitoon and L.-T. Lim, Materialia, 2020, 10, 100649 CrossRef CAS.
- H. Zhang, B. Lin, J. Tang, Y. Wang, H. Wang, H. Zhang, J. Cao, J. Hou, M. Sun and H. Zhang, Surf. Coat. Technol., 2021, 424, 127647 CrossRef CAS.
- Y. K. Bai, C. Jiang, Q. H. Wang and T. M. Wang, Carbohydr. Polym., 2013, 96, 522–527 CrossRef CAS.
- X. Chen, Y. Zhang, H. Wang, S.-W. Wang, S. Liang and R. H. Colby, J. Rheol., 2011, 55, 485–494 CrossRef CAS.
- F. Lu, B. W. Cheng, J. Song and Y. Liang, J. Appl. Polym. Sci., 2012, 124, 3419–3425 CrossRef CAS.
- L. J. Wang, G. Lei, B. W. Cheng, X. J. Ji, J. Song and L. Fei, Carbohydr. Polym., 2014, 110, 292–297 CrossRef CAS.
- V. K. Vorobiov, M. P. Sokolova, N. V. Bobrova, V. Y. Elokhovsky and M. A. Smirnov, Carbohydr. Polym., 2022, 290, 119475 CrossRef CAS PubMed.
- R. Masrat, M. Maswal, O. A. Chat, G. M. Rather and A. A. Dar, Colloids Surf., A, 2016, 489, 113–121 CrossRef CAS.
- M. G. Bekaroglu, Y. Isci and S. Isci, Mater. Sci. Eng., C, 2017, 78, 847–853 CrossRef CAS PubMed.
- K. Inukai, Y. Takahashi, K. Ri and W. Shin, Ceram. Int., 2015, 41, 5959–5966 CrossRef CAS.
- C. L. Ang, K. K. Tha Goh, K. Lim and L. Matia-Merino, Food Hydrocolloids, 2021, 120, 106908 CrossRef CAS.
- V. A. Burmistrov, I. M. Lipatova, J. A. Rodicheva, N. V. Losev, I. P. Trifonova and O. I. Koifman, Eur. Polym. J., 2019, 120, 109209 CrossRef CAS.
- Y. Zare, S. P. Park and K. Y. Rhee, Results Phys., 2019, 13, 102245 CrossRef.
- P. J. Shi, Y. Zuo, Q. Zou, J. Shen, L. Zhang, Y. B. Li and Y. S. Morsi, Int. J. Pharm., 2009, 375, 67–74 CrossRef CAS PubMed.
- Y. B. Sun, S. B. Yang, Y. Chen, C. C. Ding, W. C. Cheng and X. K. Wang, Environ. Sci. Technol., 2015, 49, 4255–4262 CrossRef CAS PubMed.
- J. Yu, X. Luo, B. Liu, J. Zhou, J. Feng, W. Zhu, S. Wang, Y. Zhang, X. Lin and P. Chen, J. Mater. Chem. A, 2018, 6, 15359–15370 RSC.
- S. T. Sikhosana, T. P. Gumede, N. J. Malebo, A. O. Ogundeji and B. Motloung, Polym. Eng. Sci., 2023, 63, 1411–1422 CrossRef CAS.
- B. W. Hu, Q. Y. Hu, D. Xu and C. G. Chen, Sep. Purif. Technol., 2017, 175, 140–146 CrossRef CAS.
- A. Hivechi, S. H. Bahrami, R. A. Siegel, P. B. Milan and M. Amoupour, Cellulose, 2020, 27, 5179–5196 CrossRef CAS.
- C. Pang, H. Wang and X. Lin, Colloids Surf., A, 2021, 630, 127643 CrossRef CAS.
Footnote |
| † Electronic supplementary information (ESI) available. See DOI: https://doi.org/10.1039/d3ra06641j |
| This journal is © The Royal Society of Chemistry 2024 |