 Open Access Article
Carbon-coated selenium nanoparticles for photothermal therapy in choriocarcinoma cells
Hui Yu,
Xinyi He,
Xiaoya Gu,
Yuemin Hou,
Haoyi Zhao,
Li Gao,
Ruifang An* and
Jia Wang *
*
Department of Obstetrics and Gynecology, The First Affiliated Hospital of Xi'an Jiaotong University, Xi'an Jiaotong University, Xi'an, Shaanxi, P. R. China. E-mail: anruifang@xjtu.edu.cn; wangjia_80@163.com
First published on 2nd January 2024
Abstract
Choriocarcinoma can be cured by chemotherapy, but this causes resistance and severe side effects that bring about physical and psychological consequences for patients. Therefore, there is still an urgent need to find other alternative minimally invasive therapies to halt the progression of choriocarcinoma. Novel carbon-coated selenium nanoparticles (C–Se) were successfully synthesized for choriocarcinoma photothermal therapy. C–Se combined with near-infrared laser irradiation can inhibit the proliferation of human choriocarcinoma (JEG-3) cells and induce cell apoptosis. C–Se killed cells and produced ROS under near-infrared laser irradiation. Finally, the therapeutic mechanism of C–Se + laser was explored showing that C–Se + laser influenced numerous biological processes. Taken together, C–Se exhibited significant potential for choriocarcinoma photothermal therapy.
1 Introduction
Choriocarcinoma is a gynecological malignancy that can develop after any type of pregnancy and is caused by abnormal proliferation and excessive invasion of trophoblast cells.1,2 In severe cases, choriocarcinoma can metastasize to the lung, vagina, brain, and liver, causing physical, psychological, and social sequelae for patients.3,4 Owing to the semi-alloantigen immunity feature, choriocarcinoma can be cured by chemotherapy, but chemotherapy resistance and severe side effects bring about patient discomfort, anxiety, and a loss of financial support for medical treatment.5,6 Therefore, there is still an urgent need for current scientific research to find other alternative minimally invasive therapies to halt the progression of choriocarcinoma.In recent years, photothermal therapy (PTT) has opened up new avenues for cancer treatment as a minimally invasive method that uses photothermal agents to convert light energy into heat energy in order to achieve the purpose of thermal damage to tumor tissues.7–9 At present, the main type of photothermal agents, near-infrared (NIR) absorptive nanomaterials, have been developed for cancer treatment both in vitro and in vivo.10,11 However, the disadvantages of some photothermal agents, such as poor biological metabolism and high cost of gold nanomaterials,12,13 and poor dispersion of carbon nanomaterials to induce immune responses,14 greatly hinder their application in the biomedical field. At this time, two-dimensional (2D) transition metal disulfides (TMDs) provide rich application prospects in biomedicines and other fields due to their strong near-infrared light absorption, high photothermal conversion efficiency, good photothermal stability, strong loading capacity, and low cost.15–17 As an essential trace element involved in cellular metabolism for the human body, selenium-containing nanocarriers have lower cytotoxicity than other TMD materials and show strong biological activities such as high bioavailability, regulation of selenoproteins functions, scavenging free radicals, and preventing oxidative DNA damage.18 Se nanoparticles have also been proven to promote cancer cell apoptosis and autophagy, and selectively kill cancer cells by inducing reactive oxygen species (ROS) production through redox regulation.18–21 In addition, the surface coating treatment can isolate selenium nanoparticles from the external environment, improving the biocompatibility and stability of selenium nanoparticles to meet the criteria for biological applications. Bio-derived carbonaceous nanomaterials (Bd-CNMs) are a new type of materials that have surface modification structure, strong hybridization ability, low toxicity and good biocompatibility, and are widely used in biomedical fields such as tumor hyperthermia, drug delivery, and biological imaging.22 For example, carbon nanotubes (CNTs) are typical 1D nanomaterials with flexible and effective loading structure, superior stability, biocompatibility, site-targeted drug release, and exhibit fluorescence emission in the NIR region.23,24 Sarin et al.25 confirmed that Se/C bifunctional nanoparticles were highly effective in inducing the death of malignant mesothelial cells in vitro. On the one hand, selenium nanoparticles can not only enhance the cytotoxicity to cancer cells but also serve as a carrier for targeted drug delivery. On the other hand, carbon coating can enhance cellular uptake, reduce Se to active selenide in cells, and have the potential of high biocompatibility and biodegradability, which makes up for the lack of versatility. Therefore, selenium–carbon composite nanostructures may be a new type of nanoparticles that can be internalized by target cells quickly and are stable enough in extracellular fluid to reach the target cells completely.25
In this study, carbon-coated selenium (C–Se) nanoparticles were prepared in a high-pressure reactor, and the successful preparation of C–Se nanoparticles was characterized by a series of chemical methods. In order to evaluate the therapeutic efficacy of C–Se in treating choriocarcinoma, we used the JEG-3 cell line, which is the most commonly used, most comprehensive in function and closest to primary human choriocarcinoma.26,27 Furthermore, there are many studies which evidenced the powerful utilization of JEG-3 cells as an excellent in vitro model for nanoparticle assessment in the context of choriocarcinoma.27–29 The uptake behavior of C–Se nanoparticles by choriocarcinoma JEG-3 cells was subsequently intracellular internalization analyzed by biological transmission electron microscopy. Se nanoparticles and C–Se nanoparticles have cytotoxicity towards JEG-3 cells, while C–Se nanoparticles combined with near-infrared laser irradiation killed more cells. C–Se + laser treatment caused photothermal therapy to inhibit the proliferation and migration of choriocarcinoma cells, induced cell apoptosis, and produced a high level of ROS. In order to further investigate the mechanism of C–Se + laser anti-tumor ability, the differentially expressed genes for affecting choriocarcinoma JEG-3 cells were screened by bioinformatics methods. The work presented here provides a detailed analysis of the role of C–Se nanoparticles in the treatment of choriocarcinoma, which will help to understand their disordered mechanisms in choriocarcinoma and realize their possible clinical applications.
2 Experimental
2.1 Materials
Selenium (Se) powder was purchased from Beilian Fine Chemicals Development Co., Ltd. (Tianjin, China). Glycerol and acetic acid were obtained from Chemical Reagent Plant Four (Tianjin, China). Ethanol was purchased from Damao Chemical Reagent Factory (Tianjin, China). The reagents and materials applied in this research were of an analysis grade (AR).2.2 Preparation of Se nanoparticles
Selenium powder (0.5 g), ethanol (10 mL) and N2H4·H2O (5 mL) as a strong reducing agent were added to 40 mL of deionized water and stirred for 30 minutes at 500 rpm using a magnetic stirrer. Subsequently, the mixture was put into a 100 mL Teflon high-pressure reactor and kept at 200 °C for 12 hours. After the autoclave had cooled to room temperature, the complex in the reactor was extracted and centrifuged three times with deionized water. Finally, Se nanoparticles were generated by drying the centrifugation-produced sediment at 60 °C for 12 h.2.3 Preparation of C–Se nanoparticles
Glycerol and acetic acid were used to supply carbon sources to form a coating of carbon on selenium nanoparticles. 0.5 g of Se powder, 0.5 g of glycerol, 3 mL of acetic acid, and 10 mL of ethanol were mixed with 40 mL of deionized water. After stirring with a magnetic agitator at 500 rpm for 30 minutes, the mixture was then transferred to a 100 mL Teflon high-pressure reactor and held at 200 °C for 12 hours. After the autoclave had cooled to room temperature, the contents in the autoclave were removed and centrifugally washed three times with deionized water. In order to obtain C–Se nanoparticles, the centrifugation-derived sediment was further dried at 60 °C for 12 hours.2.4 Characterization
Transmission electron microscopy (TEM; H-7650, HITACHI, Japan) and scanning electron microscopy (SEM; OXFORD instruments, UK) were employed to examine the surface morphology of nanoparticles. The chemical element composition and element content of nanoparticles were determined using an energy-dispersive spectrometer (EDS; OXFORD instruments, UK). The crystal phase structure of the produced nanoparticles was investigated by X-ray diffraction (XRD; D8 Advance Diffractometer, Bruker, Germany) (scanning speed: 10° min−1; scanning range: 5–80°). The chemical functional groups of the produced nanoparticles were examined using Fourier transform infrared spectroscopy (FT-IR; Nicolet iS50 spectrometer, Thermo Fisher Scientific, USA), with a spectral resolution of 4 cm−1 in the range of 530–4000 cm−1. Raman spectroscopy (Hr800; Horiba Jobin Yvon, Edison, New Jersey, USA) was used to characterize the interaction between nanoparticles in the range of 100–1650 cm−1 at an excitation wavelength of 532 nm. Thermogravimetric analysis (TGA; NETZSCH Group, Germany) of the produced nanoparticles was employed to evaluate their thermal stability from room temperature to 500 °C. With a range of 0–800 eV, X-ray photoelectron spectroscopy (XPS; Escalab 250Xi, Thermo Fisher Scientific, USA) was utilized to analyze the chemical composition of the generated nanoparticles. XPSpeak41 software was used to perform multi-peak fitting for elements including O, C, and Se.2.5 Cell culture
Human choriocarcinoma cell line JEG-3 cells were obtained from the National Collection of Authenticated Cell Cultures (Catalog No. TCHu195, Shanghai, China) and grown in DMEM medium (Gibco, USA) supplemented with 10% fetal bovine serum (FBS, ExCell Bio), penicillin (100 U mL−1) and streptomycin (100 μg mL−1). Cells were grown at 37 °C in a humidified incubator with 5% CO2. Cells were trypsinized and diluted 1![[thin space (1/6-em)]](https://www.rsc.org/images/entities/char_2009.gif) :
:![[thin space (1/6-em)]](https://www.rsc.org/images/entities/char_2009.gif) 3 for passage when they reached 80% confluence.
3 for passage when they reached 80% confluence.
2.6 Biological transmission electron microscopy (Bio-TEM) analysis
JEG-3 cells (5 × 10⁶) were plated overnight in 10 cm dishes and treated with Se or C–Se (10 μg mL−1) for 24 hours. Treated and untreated cells were collected and fixed with 2.5% glutaraldehyde. The samples were dehydrated and prepared for examination with an H-7650 transmission electron microscope (Hitachi, Tokyo, Japan).2.7 In vitro cytotoxicity assay
A 3-(4,5-dimethyl-2-thiazolyl)-2,5-diphenyl-2H-tetrazolium bromide (MTT) assay was used to measure cell viability. JEG-3 cells in the logarithmic growth stage were seeded into 96-well plates (5 × 10³ per well) and incubated overnight. On the second day, gradient concentrations of C–Se, Se, or GLAC (0.1, 1, 5, 10, 20, 50, 100 μg mL−1) were added to each well and incubated under 37 °C. After treatment for 24 h, 100 μL of medium containing 10% MTT reagent (0.5 mg mL−1, Solarbio) was added into each well, and the cells were cultured in an incubator at 37 °C for 4 h. Thereafter, the MTT solution was removed, and 150 μL of dimethyl sulfoxide (DMSO) was added into each well. Finally, absorbance was recorded at 570 nm using a BioTek Synergy NEO2 multi-mode reader (Biotek Instruments, Winooski, VT). The cell viability was evaluated as follows: cell viability (%) = (ODsamples − ODblank)/(ODcontrol − ODblank) × 100%. To assess the photothermal effect of C–Se, JEG-3 cells were exposed to NIR laser irradiation (808 nm, 1 W cm−2) for 10 min after being treated with C–Se for 12 h and incubated for another 12 h. Other operations were performed as described previously.2.8 Colony formation assay
JEG-3 cells were seeded and cultured in the six-well plates at a density of 1000 cells per well in DMEM high glucose containing 10% FBS for 48 h. Next, the cells were treated with different concentrations of C–Se nanoparticles. After incubating for 24 h, near-infrared light irradiation (808 nm, 10 min) was applied to the experimental groups. Cells were cultured in the 5% CO2, 37 °C environments for another 10 days to allow colony formation. The plate was washed with PBS three times. The colonies were fixed with 4% polyformaldehyde for 15 min and dyed with crystal violet staining solution (C0121, Beyotime) for 15 min at room temperature. After washing with PBS 3 times, the colonies were counted. Three individual experiments were performed.2.9 Migration assay
Transwell migration assays were performed using 24-well transwell chambers with 8 μm pore size filters to assess the migration activity of JEG-3 cells. JEG-3 cells (5 × 10⁴) suspended in 200 μL of serum-free DMEM were seeded in the upper chamber, whereas 800 μL of medium supplemented with 10% FBS was placed in the lower chamber. Cells were allowed to migrate through the chamber for 24 hours. After being washed with PBS three times, cells were fixed with 4% polyformaldehyde for 15 min and stained with crystal violet staining solution (C0121, Beyotime) for 15 min at room temperature. The non-migrating cells were wiped away from the upper face of the filter with a cotton swab. The migrating cells to the lower face of the filter were counted using an inverted light microscope in five randomly selected fields at a magnification of 100×. Each assay was done in triplicate.2.10 Live/dead assays
JEG-3 cells were seeded in a 12-well plate and cultured overnight. On the second day, cells were treated with different concentrations of C–Se NPs for 24 h. Cells of the laser group were irradiated by NIR laser irradiation (808 nm, 1 W cm−2) for 10 min. Thereafter, the Viability/Cytotoxicity Assay Kit for Animal Live & Dead Cells (Calcein AM/PI, Proteintech, Cat No. PF00007, Wuhan, China) was used to assess cytotoxicity. After being washed with PBS twice, cells were incubated with calcein AM (2 μM) and propidium iodide (PI, 4.5 μM) for 20 min at room temperature. Finally, the cells were washed with PBS and observed via an inverted fluorescence microscope.2.11 Apoptosis assay
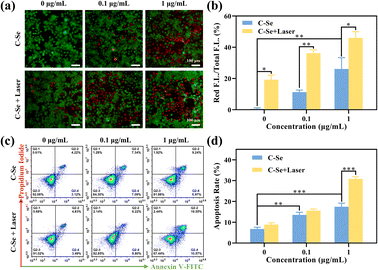
Apoptosis of JEG-3 cells was detected using the Annexin V-FITC/PI Apoptosis Detection Kit, which was purchased from Yeasen Biotechnology (Shanghai) Co., Ltd. JEG-3 cells were seeded in 6-well plates at a density of 1 × 10⁵ cells per well and incubated in 37 °C under 5% CO2. On the second day, the medium was replaced with fresh DMEM or containing different concentrations of C–Se NPs (1 μg mL−1, 10 μg mL−1) for 12 h. Then, the C–Se treated cells were irradiated with an 808 nm laser at 1 W cm−2 for 10 min. Following, after incubation for another 12 h, the cells were digested by trypsin without EDTA and collected by centrifugation. After being washed with cold PBS twice, the cells were resuspended in binding buffer, and Annexin V-FITC and PI solution were added to each sample for 15 min in the dark. Finally, stained cells were detected by flow cytometry analysis using an ACEA Novocyte flow cytometer. In the apoptosis map, Annexin V-FITC+/PI+ (Q2) indicates late apoptosis, Annexin V-FITC+/PI− (Q4) indicates early apoptosis, Annexin V-FITC−/PI− (Q3) indicates normal live cells, and Annexin V-FITC−/PI+ (Q1) indicates necrosis.2.12 Intracellular ROS generation
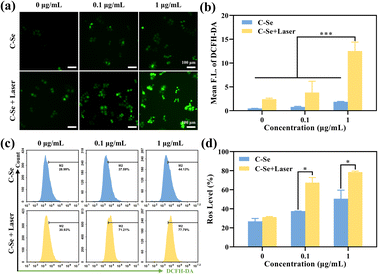
Cellular ROS plays a crucial role in tumor therapy. The generation of intracellular reactive oxygen species (ROS) was determined by a 2′,7′-dichlorodihydrofluorescein diacetate probe (DCFH-DA, Beyotime, S0033S), a ROS-sensitive probe that can be oxidized to fluorescent 2′,7′-dichlorodihydrofluorescein (DCF) with green fluorescence by intracellular peroxides.30 JEG-3 cells were seeded into a 24-well plate overnight and treated with different concentrations of C–Se for 12 h. After that, cells were washed with PBS three times and replaced with fresh medium. Especially, each laser group was further exposed to NIR laser irradiation (808 nm, 1 W cm−2) for 10 min. Thereafter, the cells were washed twice with FBS-free medium and incubated with medium containing 10 μM DCFH-DA for 30 min at 37 °C. Finally, the cells were washed with PBS and observed via an inverted fluorescence microscope. Quantification of the fluorescence intensity of DCFH-DA was conducted with Image J software. A total of 1 × 10⁴ events of each sample were detected by flow cytometer.2.13 Transcriptome sequencing
JEG-3 cells were seeded overnight in 10 cm dishes and subjected to individual or combined C–Se treatments (10 μg mL−1) in triplicate for 24 hours. Afterwards, cells treated with C–Se were exposed to irradiation with NIR laser for 10 minutes before RNA extraction. According to the manufacturer's protocol, total RNA was extracted utilizing the TRIzol reagent kit (Invitrogen, 10296010CN, USA). RNA quality was evaluated on an Agilent 2100 Bioanalyzer electrophoresis. Oligo (dT) beads were employed to concentrate eukaryotic mRNA after total RNA had been extracted. Then the enriched mRNA was fragmented into short fragments using fragmentation buffer and reversly transcribed into cDNA by using NEBNext Ultra RNA Library Prep Kit for Illumina (NEB #7530, New England Biolabs, Ipswich, MA, USA). The purified double-stranded cDNA fragments were end-repaired, a base was added and ligated to Illumina sequencing adapters. The ligation reaction was purified with the AMPure XP Beads (1.0×). And polymerase chain reaction (PCR) amplified. The resulting cDNA library was sequenced using Illumina Novaseq6000 by Gene Denovo Biotechnology Co. (Guangzhou, China).Then RNA sequencing and bioinformatic data processing were performed as part of the high-throughput sequencing by Gene Denovo Biotechnology Co., Ltd (Guangzhou, China). The cDNA libraries were sequenced on the Illumina sequencing platform by Gene Denovo Biotechnology Co., Ltd (Guangzhou, China). DESeq2_edgeR was used to normalize raw counts and identify differentially expressed genes. The data were analyzed online with Omicsmart (https://www.omicsmart.com). The transcriptomics study helped to clarify a deeper understanding of the effect mechanism.
2.14 Statistical analysis
All statistical analyses were performed with GraphPad Prism 8.0. The data were expressed as mean ±SD based on at least three independent experiments. The statistical significance of the difference among groups was determined using an unpaired T-test. P value <0.05 was considered statistically significant.3 Results and discussion
3.1 TEM and SEM analysis
The morphology of C–Se was investigated using TEM and SEM at different scales. The irregular circular lamellar structure of C–Se and the stacking phenomenon between lamellae can be clearly seen in the TEM images of C–Se (Fig. 1a and b). The figure demonstrated that the diameter of the C–Se irregular circular lamellar structure was between 500 and 800 nm, which was more than the diameter of a single Se nano-sheet.31,32 Moreover, the SEM images in Fig. 1c and d revealed that C–Se primarily appeared in the form of a block. Block C–Se appeared to be made up of smaller lamellae that were stacked on top of one another in the magnified SEM pictures (Fig. 1e). This result was in accordance with the TEM findings, which indicate that the small lamellae have clustered together as a result of the high energy on the surface. A larger version of the SEM image (Fig. 1f) showed defects at the edges of the bulk C–Se and cracks between the lamellae, which may be caused by the dehydration of C–Se during the heating and drying process of sample preparation.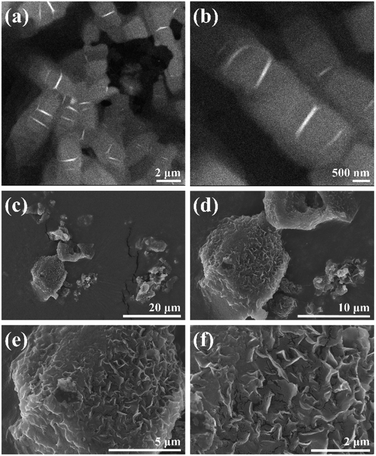 | ||
| Fig. 1 (a and b) TEM images of C–Se at different scales. (c–f) SEM images of C–Se at different scales. | ||
3.2 EDS analysis
The elemental analysis of C–Se was performed utilizing EDS, and Fig. 2 exhibited the EDS spectrum. Fig. 2b–d showed that the primary components of C–Se were C, O, and Se. As shown in Fig. 2e, the contents of C and O in C–Se were 5.272% and 39.811%, respectively, and they were mainly derived from glycerol. While the element Se made up the majority of C–Se and accounted for up to 54.917% of the total element content. Additionally, Fig. 2f confirmed that the main elements in C–Se were C, O, and Se, with Se having the highest content.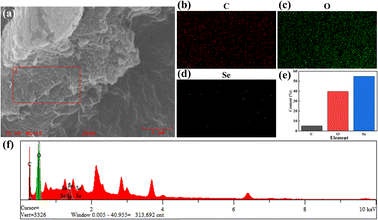 | ||
| Fig. 2 (a–d) SEM images and elemental distribution fluorescence images on the surface, (e) elemental content images, and (f) corresponding elemental energy distribution images of C–Se. | ||
3.3 XRD, FT-IR, Raman and TGA analysis
XRD analysis was used to elucidate the composition and crystal phase of C–Se, as displayed in Fig. 3a. According to the C–Se XRD curve, three conspicuous diffraction peaks were found at 23.4°, 29.6°, and 43.6° that were indexed to the (100), (101), and (102) lattice planes of the C–Se crystalline structures, respectively. And it can be seen that eleven weak diffraction peaks at 41.2°, 45.3°, 48.0°, 51.6°, 56.0°, 61.6°, 65.1°, 68.2°, 71.5°, 76.8°, and 78.1° corresponding to the diffraction peaks of the (110), (111), (200), (201), (112), (202), (210), (211), (113), (212), and (301) planes, respectivley. The XRD results of C–Se were consistent with those of Se/C (JCPDS card no. 06-0362).33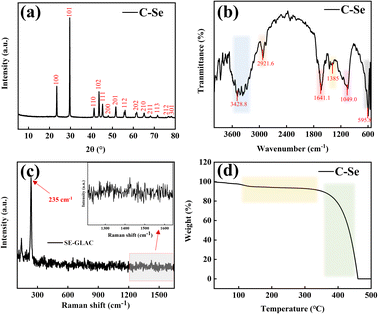 | ||
| Fig. 3 (a) X-ray diffraction (XRD) patterns, (b) Fourier transform infrared spectroscopy (FT-IR), (c) Raman spectrum (Raman), and (d) thermogravimetric analysis (TGA) of C–Se. | ||
Fig. 3b shows the FT-IR spectral image of C–Se. It can be seen that the absorption band at 3428.8 cm−1 is mainly attributed to the stretching of –OH, and the absorption band at 2921.6 cm−1 is mainly attributed to the vibration of the C–H bond.34 The absorption band at 1641.1 cm−1 and the weak absorption band at 1385 cm−1 may represent the asymmetric and symmetric tensile vibrations of carboxylate.35 The absorption band at 1049.0 cm−1 are mainly attributed to the vibration of the C–O bond, and the absorption band at 595.8 cm−1 is mainly attributed to the tensile vibration of symmetric rings.34,35
Fig. 3c shows the Raman spectral image of C–Se. It can be seen that a strong front appears at 235 cm−1, which is the characteristic front of triangular selenium. The occurrence of this front is mainly attributed to the stretching vibration of the spiral selenium chain, and no characteristic front of C is found in the Raman spectrum, which may be due to the low carbon content in C–Se.36
Fig. 3d shows the TGA image of C–Se. It can be seen that there is a small mass loss of C–Se at 100–350 °C, which may be caused by the oxidation of part of Se and C in C–Se and the formation of SeO2 and carbon-containing oxides. However, C–Se has a polar mass loss when the heating temperature is higher than 350 °C, which may be due to the sublimation of SeO2 and the complete oxidation of the carbon matrix.37
3.4 XPS analysis
Fig. 4 is the XPS image of C–Se. It can be seen from Fig. 4a that C–Se is mainly composed of C, O, and Se, in which the energy of the C element is low, which is similar to the Raman results in Fig. 3c. Fig. 4b shows the high-resolution spectra of O 1s, and two fronts of –OH and C–O are fitted at 532.4 and 533.3 eV, respectively, which confirms that the O element in C–Se mainly exists in the form of –OH and C–O, and its main source is glycerol. Fig. 4c shows the high-resolution spectrum of C 1s, and the C–H and C–O fronts are fitted at 285 and 287.3 eV, respectively, which confirms that C–H and C–O elements in C–Se mainly exist in the form of C–H and C–O, and their main sources are also glycerol. Fig. 4d shows the high-resolution spectra of Se 3d, and two fronts of Se 3d5/2 and Se 3d3/2 are fitted at 55.2 and 56.3 eV, respectively, which are the main forms of Se in C–Se.38,39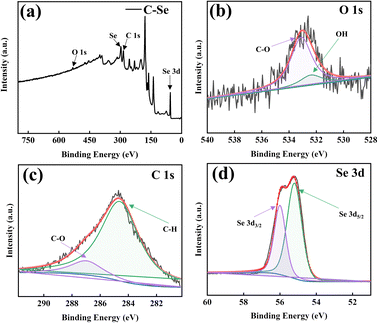 | ||
| Fig. 4 X-ray photoelectron spectroscopy (XPS) spectrum of C–Se: (a) survey, (b) O 1s, (c) C 1s, and (d) Se 3d. | ||
3.5 Intracellular internalization analysis
Fig. 5 depicts the results of biological transmission electron microscopy (Bio-TEM), which was used to investigate the cellular uptake behavior of nanoparticles in JEG-3 cells. For control, no nanoparticles were observed on the TEM grid. Bio-TME images of Se and C–Se nanoparticles at low- and high-magnifications proved that these particles easily aggregate to create larger particles. Choriocarcinoma cell line JEG-3 cells have high uptake efficiency of these particles, which may be due to the ligand-mediated intracellular endocytosis pathway. These particles can be phagocytized by lysosomes implying that the phagocytosis of particles by lysosomes may be related to cell apoptosis. Therefore, these particles can enter JEG-3 cells and suppress cell proliferation by inducing cell apoptosis. The bio-TEM photographs pointed out that C–Se was endocytosed when entering JEG-3 cells (Fig. 5).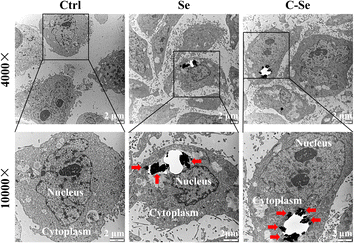 | ||
Fig. 5 Low- (4000×) and high-magnification (100![[thin space (1/6-em)]](https://www.rsc.org/images/entities/char_2009.gif) 00×) bio-TEM images of JEG-3 cells incubated with Se and C–Se for 24 h. 00×) bio-TEM images of JEG-3 cells incubated with Se and C–Se for 24 h. | ||
3.6 Anti-cancer ability of C–Se
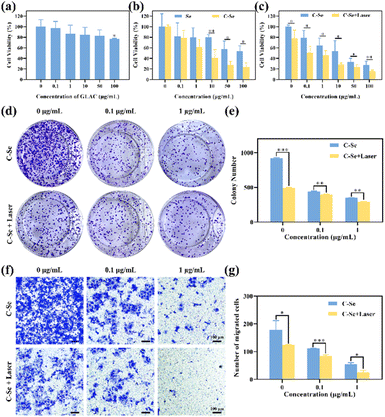
MTT assay was used to evaluate the cytotoxicity of different formulations on JEG-3 cells, in order to verify the appropriate concentration of nanoparticles for use in the experiments. As indicated in Fig. 6a, GLAC solution showed no obvious cytotoxicity, and the cell viability was higher than 80% when the concentration was no higher than 100 μg mL−1, indicating the great biocompatibility of GLAC. As shown in Fig. 6b, there was a significant antiproliferative effect on JEG-3 cells in a dose-dependent manner when JEG-3 cells were incubated with Se nanoparticles or C–Se nanoparticles. Particularly, C–Se nanoparticles had greater cytotoxicity against JEG-3 cells compared with Se nanoparticles. After incubation with C–Se nanoparticles at 10 μg mL−1, the relative cell viability dramatically decreased to 40.80 ± 15.85%, while that of Se nanoparticles at 10 μg mL−1 was 80.33 ± 4.12% (P < 0.01). Upon irradiation with a 1 W cm−2 power NIR laser, C–Se nanoparticles revealed higher toxicity against JEG-3 cells compared with in the absence of laser irradiation, suggesting that C–Se induces hyperthermic conditions for PTT upon laser irradiation.The colony formation assays showed that C–Se had the lowest number of colonies formed by JEG-3 cells (Fig. 6d), compared with other groups, suggesting that C–Se significantly inhibited the colony formation capacity. The numbers of colonies formed in each group were as follows: control: 918.50 ± 12.02, laser: 495.5 ± 4.95, 0.1 μg mL−1 C–Se: 438.5 ± 9.19; 0.1 μg mL−1 C–Se with NIR laser: 398.5 ± 3.54; 1 μg mL−1 C–Se: 348 ± 2.83; 1 μg mL−1 C–Se with NIR laser: 295 ± 2.84 (Fig. 6e). As the concentration of C–Se increased, the number of colonies was lower, indicating that C–Se could suppress the colony formation ability of cells. Additionally, NIR laser irradiation groups had a lower number of cellular colonies compared with those without irradiation groups, implying that laser irradiation groups could significantly inhibit colony formation ability.
Transwell migration assays (Fig. 6f) were undertaken to identify JEG-3 cells' migration potential since tumor cell migration is the cytological underpinning for tumor metastasis. Cells were seeded in the Transwell chamber to allow migration for 24 hours. The numbers of migrating cells in Transwells in each group were as follows: control: 178.67 ± 33.25, laser: 124.67 ± 1.53, 0.1 μg mL−1 C–Se: 111.33 ± 0.58; 0.1 μg mL−1 C–Se with NIR laser: 84.67 ± 4.04; 1 μg mL−1 C–Se: 54.33 ± 6.11; 1 μg mL−1 C–Se with NIR laser: 24.50 ± 9.19 (Fig. 6g). Two groups were analyzed by unpaired T-test, and the numbers from laser groups were lower than without group (P < 0.001). These results revealed that C–Se could inhibit the migration capability of choriocarcinoma cells, and in combination with laser irradiation this ability could be enhanced.
3.7 C–Se induced apoptosis
There was strong green fluorescence tagged by the AM probe in JEG-3 cells from the control and low-dose groups, illustrating that many cells remained viable (Fig. 7a). The cells treated with C–Se showed some red fluorescence and green fluorescence became weaker than that in the above group, indicating that some cells are killed, while most are still alive (Fig. 7a). The C–Se with laser irradiation group showed the highest amount of red fluorescence in the indicated group, demonstrating a high percentage of dead cells and a high capacity for tumor killing (Fig. 7b).To investigate whether treatment with C–Se could induce cell death in JEG-3 cells, apoptosis was detected using flow cytometry. As demonstrated in Fig. 7c, JEG-3 cells were treated with C–Se alone, the results exhibit increased apoptosis in JEG-3 cells. In Fig. 7d, the percentage of apoptotic JEG-3 cells following 0.1 μg mL−1 C–Se treatment was 14.43%, and 15.02% under laser irradiation. When the treatment concentration of C–Se was increased to 1 μg mL−1, the percentage of apoptotic JEG-3 cells was 16.21%, and 30.12% under the laser irradiation, which had significantly increased compared with the control group. These results indicated that cell death induced by C–Se nanoparticles mainly resulted from apoptosis.
3.8 Intracellular ROS generation
ROS is a crucial intracellular transduction molecule that can be widely involved in the redox reaction of cells. An increase in ROS can cause oxidative stress, which can result in damage to biological macromolecules such as nucleic acids, proteins, and cell membranes.40 Additionally, a high concentration of ROS can result in apoptosis and control the expression of associated genes through signal transduction. Cellular ROS has a significant impact on tumor therapy.The higher cytotoxicity of C–Se upon NIR laser irradiation was probably due to the enhanced catalytic generation of reactive oxygen species (ROS). In order to evaluate intracellular ROS levels, we used a broad-spectrum ROS fluorescence probe 2′,7′-dichlorodihydrofluorescein diacetate probe (DCFH-DA). As shown in Fig. 8a, JEG-3 cells treated with 0.1 μg mL−1 and 1 μg mL−1 C–Se upon 808 nm laser irradiation indicated a stronger green fluorescence compared with those without laser irradiation. The green fluorescence intensity of JEG-3 cells becomes brighter, indicating that higher levels of ROS were induced by C–Se nanoparticles in the presence of NIR laser irradiation (Fig. 8b). Moreover, we quantified intracellular ROS levels by flow cytometry. As shown in Fig. 8c and d, NIR laser irradiation could induce ROS generation compared to the non-irradiation group.
3.9 Transcriptome sequencing analysis
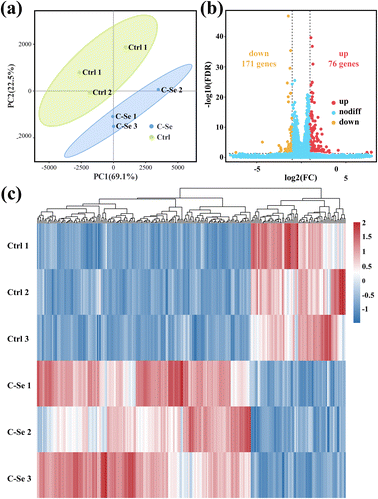
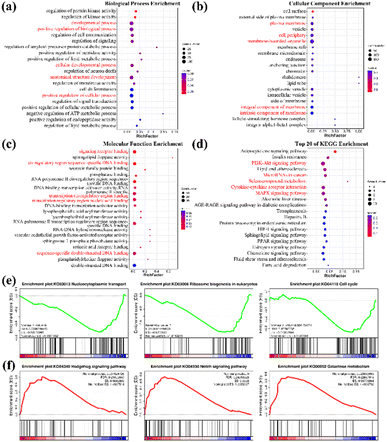
To further elucidate the mechanism involved in C–Se + laser enhancing anti-tumor ability, high-throughput RNA sequencing (RNA-seq) analysis was carried out on two groups of JEG-3 cells (control group and C–Se group). For each sample, the mapping ratio ranged from 97.04% to 97.21% on the reference genome, suggesting that they are suitable for deeper bioinformatic analysis. Principal component analysis (PCA) of mRNA expression data in Fig. 9a corroborated the consistency of biological replicates, revealing significant variations between the two sets of JEG-3 cells (n = 3 in each group). Differentially expressed genes (DEGs) between two groups were identified for 247 genes using the DESeq2 algorithm, based on fold change ≥2 and FDR <0.05. The volcano plot in Fig. 9b illustrated 171 up-regulated mRNAs and 76 down-regulated mRNAs in C–Se-treated JEG-3 cells as compared to untreated JEG-3 cells. The heat map displayed data in a two-dimensional format with each value representing a matrix of upregulated (red) and downregulated (blue) genes, indicating a significant difference in mRNA profiles between cells treated with C–Se and PBS, as shown in Fig. 9c.In light of the genes with discovered differential expression, a bioinformatics technique was employed to investigate the regulators and the functional importance of these alterations. To ascertain the potential biological functions of the identified DEGs, we annotated them by Gene Ontology (GO) analysis. GO analysis includes three items: Cellular Component (CC), Molecular Function (MF), and Biological Process (BP). Fig. 10a showed the Top 20 GO terms in the biological process, dominating terms were positive regulation of biological process, developmental process, cellular developmental process, anatomical structure development, and positive regulation of cellular process. Fig. 10b displayed the Top 20 GO terms in the cellular component, the main terms were plasma membrane, cell periphery, membrane-bounded organelle, integral component of membrane, and intrinsic component of membrane. Fig. 10c exhibited the Top 20 GO terms in molecular function, the majority of DEGs were related to signaling receptor binding, cis-regulatory region sequence-specific DNA binding, transcription cis-regulatory region binding, transcription regulatory region nucleic acid binding, and sequence-specific double-stranded DNA binding.
A deeper understanding of these DEGs was gained by classifying and annotating them through the Kyoto Encyclopedia of Genes and Genomes (KEGG) orthology database to determine their functional characteristics as well as their main biochemical metabolic pathways and signal transduction pathways. By taking the Top 20 path terms based on the significance of enrichment, a KEGG enrichment bubble diagram was created in Fig. 10d. According to enrichment analysis of KEGG, most of the DEGs induced by C–Se + laser were closely correlated with P13K-Akt signaling pathway, MicroRNAs in cancer, selenocompound metabolism, cytokine–cytokine receptor interaction, and MAPK signaling pathway. The phosphatidylinositol 3 kinase/threonine kinase (PI3K/AKT) signal pathway is associated with apoptosis damage in organs and tissues.41 Guo et al.42 reported that PI3K-AKT signal pathways played a vital role in curcumin-surface decorated selenium nanoparticles (Se@Cur) to promote intracellular ROS overproduction and induce hepatocellular carcinoma cell apoptosis. MAPK signaling pathway is involved in both autophagy and apoptosis,43 Wang et al.44 found that the MAPK signaling pathway played an important regulatory role in the process of hepatocellular carcinoma cell death induced by selenium compounds combined with oxygen therapy. Therefore, the mechanism of apoptosis and ROS production induced by C–Se + laser is related to PI3K-AKT signal pathways and MAPK signaling pathway induction. These DEGs-enriched processes and pathways are mainly fulfilled by genes relevant to the occurrence and development of cancer that are brought on by C–Se treatment.
Gene set enrichment analysis (GSEA) further revealed numerous pathways from KEGG with significant enrichment. A pathway with a negative enrichment score is down-regulated, whereas a pathway with a positive enrichment score is up-regulated.45 Three representative pathways in Fig. 10e are significantly down-regulated by C–Se + laser treatment, including nucleocytoplasmic transport (KO03013; normalized enrichment score −1.93, FDR q-value = 0.004, NOM p-value <0.001), ribosome biogenesis in eukaryotes (KO03008; normalized enrichment score −1.82, FDR q-value = 0.015, NOM p-value <0.001) and cell cycle (KO04110; normalized enrichment score −1.25, NOM p-value = 0.05). These pathways play key roles in cell survival, and their downregulation may be the mechanism by which C–Se + laser causes cytotoxicity according to the above experimental results. Additionally, Hedgehog signaling pathway (KO04340; normalized enrichment score 1.50, FDR q-value = 0.21, NOM p-value <0.01), Notch signaling pathway (KO04330; normalized enrichment score 1.69, FDR q-value = 0.24, NOM p-value <0.001) and galactose metabolism (KO00052; normalized enrichment score 1.50, FDR q-value = 0.23, NOM p-value <0.05) were up-regulated by C–Se + laser treatment in Fig. 10f. The Hedgehog signaling pathway and Notch signaling pathway played key roles in many developmental processes including cell proliferation, differentiation, and apoptosis,46–48 which further confirmed the previous results.
4 Conclusions
In the present study, one novel carbon-coated selenium nanoparticle (C–Se) was successfully synthesized for choriocarcinoma photothermal therapy. C–Se showed excellent cellular uptake in JEG-3 cells. The results showed significant cytotoxicity in a dose-dependent manner towards JEG-3 cells after incubation with Se nanoparticles or C–Se nanoparticles. After combining C–Se nanoparticles with near-infrared laser irradiation, the cytotoxicity increased significantly. C–Se with near-infrared laser irradiation was superior in suppressing the proliferation of JEG-3 cells, inducing JEG-3 cell apoptosis and producing ROS to selectively kill cancer cells in vitro, compared with other groups. Furthermore, C–Se + laser influenced numerous functional activities and biochemical metabolic pathways related to cell survival, as well as signal transduction pathways that play important roles in cell development, such as PI3K-AKT signal pathways and MAPK signal pathway. Taken together, C–Se exhibits significant potential for choriocarcinoma photothermal therapy, which provides new strategies and theoretical basis for targeted therapy of choriocarcinoma. It is helpful to solve the problems of frequent drug resistance and serious side effects of chemotherapy, the main treatment method for choriocarcinoma at present. It can be predicted that C–Se may also have a significant anti-cancer effect on other solid tumors, and its potential application in targeted therapy of solid tumors in the future is promising.Author contributions
Hui Yu: conceptualization, data curation, methodology, software, validation, writing – original draft, review & editing; Xinyi He, Xiaoya Gu, Yuemin Hou and Haoyi Zhao: formal analysis, writing – original draft; Li Gao: resources, project administration, writing – review & editing; Ruifang An and Jia Wang: supervision, visualization, funding acquisition, investigation.Conflicts of interest
There are no conflicts to declare.Acknowledgements
This work was supported by the National Natural Science Foundation of China (No. 81972428) and the Shaanxi Province Science and Technology Research Project (2020SF-030).References
- N. R. Abu-Rustum, C. M. Yashar, S. Bean, K. Bradley, S. M. Campos, H. S. Chon, C. Chu, D. Cohn, M. A. Crispens, S. Damast, O. Dorigo, P. J. Eifel, C. M. Fisher, P. Frederick, D. K. Gaffney, E. Han, W. K. Huh, J. R. Lurain, A. Mariani, D. Mutch, C. Nagel, L. Nekhlyudov, A. N. Fader, S. W. Remmenga, R. K. Reynolds, R. Sisodia, T. Tillmanns, S. Ueda, E. Wyse, N. R. McMillian and J. Scavone, J. Natl. Compr. Cancer Network, 2019, 17, 1374–1391, DOI:10.6004/jnccn.2019.0053.
- M. J. Seckl, N. J. Sebire and R. S. Berkowitz, Lancet, 2010, 376, 717–729, DOI:10.1016/S0140-6736(10)60280-2.
- A. Silva, K. Monteiro, S. Y. Sun and A. U. Borbely, Placenta, 2021, 116, 38–42, DOI:10.1016/j.placenta.2021.02.013.
- J. Ireson, G. Jones, M. C. Winter, S. C. Radley, B. W. Hancock and J. A. Tidy, Lancet Oncol., 2018, 19, e56–e64, DOI:10.1016/S1470-2045(17)30686-1.
- I. Shih, Lancet Oncol., 2007, 8, 642–650, DOI:10.1016/S1470-2045(07)70204-8.
- N. Lukinovic, E. P. Malovrh, I. Takac, M. Sobocan and J. Knez, Radiol. Oncol., 2022, 56, 430–439, DOI:10.2478/raon-2022-0038.
- J. Chen, C. Ning, Z. Zhou, P. Yu, Y. Zhu, G. Tan and C. Mao, Prog. Mater. Sci., 2019, 99, 1–26, DOI:10.1016/j.pmatsci.2018.07.005.
- H. S. Han and K. Y. Choi, Biomedicines, 2021, 9, 305–319, DOI:10.3390/biomedicines9030305.
- Z. Jiang, T. Li, H. Cheng, F. Zhang, X. Yang, S. Wang, J. Zhou and Y. Ding, Asian J. Pharm. Sci., 2021, 16, 738–761, DOI:10.1016/j.ajps.2021.10.001.
- W. S. Yun, J. H. Park, D. K. Lim, C. H. Ahn, I. C. Sun and K. Kim, Cancers, 2022, 14, 2044–2063, DOI:10.3390/cancers14082044.
- S. K. Mishra, A. C. Dhadve, A. Mal, B. Reddy, A. Hole, M. K. Chilakapati, P. Ray, R. Srivastava and A. De, Biomater. Adv., 2022, 143, 213153, DOI:10.1016/j.bioadv.2022.213153.
- R. Vankayala, C. C. Lin, P. Kalluru, C. S. Chiang and K. C. Hwang, Biomater., 2014, 35, 5527–5538, DOI:10.1016/j.biomaterials.2014.03.065.
- B. Jang, J. Y. Park, C. H. Tung, I. H. Kim and Y. Choi, ACS Nano, 2011, 5, 1086–1094, DOI:10.1021/nn102722z.
- O. Akhavan and E. Ghaderi, Small, 2013, 9, 3593–3601, DOI:10.1002/smll.201203106.
- Y. Tan, M. Yi, Z. Zhu, X. Zhang, K. Qin, J. Zhang and R. Zhu, Mater. Sci. Eng. B, 2021, 271, 115239, DOI:10.1016/j.mseb.2021.115239.
- M. Chhowalla, H. S. Shin, G. Eda, L. J. Li, K. P. Loh and H. Zhang, Nat. Chem., 2013, 5, 263–275, DOI:10.1038/nchem.1589.
- D. Gopalakrishnan, D. Damien and M. M. Shaijumon, ACS Nano, 2014, 8, 5297–5303, DOI:10.1021/nn501479e.
- W. Ali, Y. Chen, J. A. Gandahi, I. H. Qazi, J. Sun, T. Wang, Z. Liu and H. Zou, Biol. Trace Elem. Res., 2023 DOI:10.1007/s12011-023-03886-8.
- A. Khurana, S. Tekula, M. A. Saifi, P. Venkatesh and C. Godugu, Biomed. Pharmacother., 2019, 111, 802–812, DOI:10.1016/j.biopha.2018.12.146.
- G. L. Liao, J. N. Tang, D. Wang, H. R. Zuo, Q. Zhang, Y. Liu and H. Y. Xiong, World J. Surg. Oncol., 2020, 18, 81–91, DOI:10.1186/s12957-020-01850-7.
- A. Golara, M. Kozlowski, P. Guzik, S. Kwiatkowski and A. Cymbaluk-Ploska, Int. J. Mol. Sci., 2023, 24, 10887–10910, DOI:10.3390/ijms241310887.
- J. Wang, Y. Fu, Z. Gu, H. Pan, P. Zhou, Q. Gan, Y. Yuan and C. Liu, Small, 2023, e2303773, DOI:10.1002/smll.202303773.
- J. Ma, G. Wang, X. Ding, F. Wang, C. Zhu and Y. Rong, ACS Omega, 2023, 8, 10656–10668, DOI:10.1021/acsomega.2c06242.
- M. K. Shukla, W. Dong, S. Azizov, K. R. Singh, D. Kumar, R. P. Singh and J. Singh, Mater. Lett., 2022, 311, 131606, DOI:10.1016/j.matlet.2021.131606.
- L. Sarin, V. C. Sanchez, A. Yan, A. B. Kane and R. H. Hurt, Adv. Mater., 2010, 22, 5207–5211, DOI:10.1002/adma.201002607.
- Y. Abbas, M. Y. Turco, G. J. Burton and A. Moffett, Hum. Reprod. Update, 2020, 26, 501–513, DOI:10.1093/humupd/dmaa017.
- L. Fliedel, K. Alhareth, N. Mignet, T. Fournier and K. Andrieux, Biomedicines, 2022, 10, 936–964, DOI:10.3390/biomedicines10050936.
- M. Rothbauer, N. Patel, H. Gondola, M. Siwetz, B. Huppertz and P. Ertl, Sci. Rep., 2017, 7, 5892, DOI:10.1038/s41598-017-06364-z.
- H. Yu, H. Zhao, Y. Zhang, Y. Hou, R. Li, T. Liang, Y. Zhang, C. Li, J. Zhao, M. Zhang and R. An, Chem. Eng. J., 2023, 472, 144690, DOI:10.1016/j.cej.2023.144690.
- H. Sies, V. V. Belousov, N. S. Chandel, M. J. Davies, D. P. Jones, G. E. Mann, M. P. Murphy, M. Yamamoto and C. Winterbourn, Nat. Rev. Mol. Cell Biol., 2022, 23, 499–515, DOI:10.1038/s41580-022-00456-z.
- P. Liang, D. Qian, G. Zhenfeng, C. Yongyi, S. Yi and L. Liang, J. Cluster Sci., 2021, 32, 1623–1633, DOI:10.1007/s10876-020-01920-6.
- K. S. Prasad, H. Patel, T. Patel, K. Patel and K. Selvaraj, Colloids Surf., B, 2013, 103, 261–266, DOI:10.1016/j.colsurfb.2012.10.029.
- K. Sridharan, M. S. Ollakkan, R. Philip and T. J. Park, Carbon, 2013, 63, 263–273, DOI:10.1016/j.carbon.2013.06.079.
- L. Luo, Y. Wang, S. Zhang, L. Guo, G. Jia, W. Lin, Z. Gao, Y. Gao and T. Sun, Carbohydr. Polym., 2021, 264, 117982, DOI:10.1016/j.carbpol.2021.117982.
- N. Shahabadi, S. Zendehcheshm and F. Khademi, Biotechnol. Rep., 2021, 30, e615, DOI:10.1016/j.btre.2021.e00615.
- Z. Zhang, X. Yang, Z. Guo, Y. Qu, J. Li and Y. Lai, J. Power Sources, 2015, 279, 88–93, DOI:10.1016/j.jpowsour.2015.01.001.
- X. Yang and Z. Zhang, Mater. Lett., 2017, 189, 152–155, DOI:10.1016/j.matlet.2016.12.001.
- L. Chen, N. Tu, Q. Wei, T. Liu, C. Li, W. Wang, J. Li and H. Lu, Surf. Interface Anal., 2022, 54, 218–230, DOI:10.1002/sia.7044.
- H. Lu, L. Chen, Q. Liu, Y. Li and L. Gao, Mater. Chem. Phys., 2021, 272, 125053, DOI:10.1016/j.matchemphys.2021.125053.
- J. D. Hayes, A. T. Dinkova-Kostova and K. D. Tew, Cancer Cell, 2020, 38, 167–197, DOI:10.1016/j.ccell.2020.06.001.
- Z. Li, T. Xu, X. Fan, K. Chen, C. Wan, X. Li, H. Yin and S. Li, J. Cell. Physiol., 2023, 238, 1256–1274, DOI:10.1002/jcp.31007.
- M. Guo, Y. Li, Z. Lin, M. Zhao, M. Xiao, C. Wang, T. Xu, Y. Xia and B. Zhu, RSC Adv., 2017, 7, 52456–52464, 10.1039/C7RA08796A.
- X. Sui, N. Kong, L. Ye, W. Han, J. Zhou, Q. Zhang, C. He and H. Pan, Cancer Lett., 2014, 344, 174–179, DOI:10.1016/j.canlet.2013.11.019.
- C. Wang, T. Cheng, Q. Lu, W. Li, B. Liu, L. Yue, M. Du, W. Sheng, Z. Lu, J. Yang, F. Geng, X. Gao, J. Lu and X. Pan, Pharmacol. Res., 2023, 187, 106624, DOI:10.1016/j.phrs.2022.106624.
- T. Huang, L. Yu, H. Pan, Z. Ma, T. Wu, L. Zhang, K. Liu, Q. Qi, W. Miao, Z. Song, H. Zhang, L. Zhou and Y. Li, Front. Nutr., 2021, 8, 751436, DOI:10.3389/fnut.2021.751436.
- L. Signetti, N. Elizarov, M. Simsir, A. Paquet, D. Douguet, F. Labbal, D. Debayle, A. D. Giorgio, V. Biou, C. Girard, M. Duca, L. Bretillon, C. Bertolotto, B. Verrier, S. Azoulay and I. Mus-Veteau, Cancers, 2020, 12, 1500–1527, DOI:10.3390/cancers12061500.
- Y. Gao, R. Zhang, G. Wei, S. Dai, X. Zhang, W. Yang, X. Li and C. Bai, Front. Cell Dev. Biol., 2019, 7, 342, DOI:10.3389/fcell.2019.00342.
- Z. Ren, C. Zhang, L. Ma, X. Zhang, S. Shi, D. Tang, J. Xu, Y. Hu, B. Wang, F. Zhang, X. Zhang and H. Zheng, Int. J. Mol. Med., 2019, 44, 67–78, DOI:10.3892/ijmm.2019.4186.
| This journal is © The Royal Society of Chemistry 2024 |

