 Open Access Article
Divalent manganese stimulates the removal of nitrate by anaerobic sludge
Zhaojie Jiang b,
Xuejiao Huang*ad,
Shuangfei Wangc,
Jianhua Xiongbd,
Chunmin Xied and
Yongli Chend
aGuangxi Key Laboratory of Agro-Environment and Agro-Product Safety, College of Agriculture, Guangxi University, Nanning, Guangxi 530004. E-mail: hxuejiao0412@sina.com; Tel: +86 18577976592
bSchool of Resources, Environment and Materials, Guangxi University, Nanning 530004, China
cCollege of Light Industry and Food Engineering, Guangxi University, Nanning, Guangxi 530004, China
dGuangxi Bossco Environmental Protection Technology Co., Ltd., Nanning 530007, Guangxi, China
First published on 12th January 2024
Abstract
This study investigated the effect of different concentrations of Mn2+ on the removal of nitrate by anaerobic sludge and changes in the microbial communities through batch experiments. The results showed that the addition of Mn2+ promoted nitrate removal by anaerobic sludge; the nitrate was completely removed within 6 d in the treatment group with >5 mM Mn2+. With the increase in Mn2+, the concentration of nitrite and nitrous oxide increased in the first 4 d and then decreased to 0 μM after 8 d of incubation. The increasing tendency of ammonium increased firstly and then decreased with the addition of Mn2+ compared to A. Moreover, the Mn2+ removal efficiency gradually decreased with the increase of Mn2+ concentration. The changes of microflora structure in sludge before and after adding Mn2+ were analyzed, and the results revealed that the microbial communities in the sludge may have evolved towards an energy-efficient association of short-cut nitrification, denitrification, and anaerobic ammonia oxidation after adding Mn2+. Mn2+ stimulated the removal of nitrate by anaerobic sludge mainly by promoting the growth of PHOS-HE36.
1. Introduction
With the acceleration of industrialization and urbanization, and the widespread use of agricultural fertilizers, NO3−–N pollution of water bodies has become a prominent environmental problem.1,2 NO3− is a highly soluble, widespread pollutant in aquatic environments, and it is widely found in surface water, groundwater, and wastewater.3,4 Groundwater, which is an important water resource, is currently the main source of drinking and industrial water in China,5 and NO3−–N contamination is a serious threat to drinking water safety. High levels of NO3−–N in groundwater pose a threat to human health (e.g., methemoglobinemia).6 Therefore, there is an urgent need to reduce NO3−–N concentrations in groundwater. Conventional heterotrophic denitrification techniques require the addition of an external organic carbon source and regulation of the amount of carbon to prevent nitrite accumulation or high organic matter contents in the wastewater, which is unsustainable on both an economic and environmental scale. In recent decades, as energy and environmental issues have become more prominent, organic waste has been used as an external organic carbon source to satisfy the needs of the heterotrophic denitrification process. For example, short-chain fatty acids, waste leachate, and hydrolyzed primary sludge have been successfully applied for denitrification, maintaining a balance in waste management as well the efficient use of nitrogen removal properties.7 Anaerobic digestion (AD) is a promising biomass energy conversion technology that has been widely used in integrated treatments of livestock manure, sewage sludge, and food waste.8 Some scholars have developed an anaerobic simultaneous denitrification and methanogenesis process based on AD for NO3−–N removal without the need for additional nitrogen removal equipment or organic carbon sources.9AD includes hydrolysis, acidification, and methanogenesis steps. Nitrogen conversion during AD includes microbial assimilation, ammonification, denitrification, and anaerobic ammonia oxidation. These reactions rely mainly on anaerobic microorganisms. Trace metal elements are important sources of microbial nutrients that are crucial for the synthesis and activity of enzymes in the AD process. These microbial nutrients promote the decomposition of organic matter and enhance the production of biogas and methane (CH4).10 Low concentrations of essential metals (e.g., Fe, Cu, Mn, Zn, and Co) can stimulate biological systems.11 However, above a certain threshold, they can affect or even inhibit microbial growth and metabolic activity.12
Excess NO3−–N in natural groundwater bodies is often accompanied by high concentrations of Mn2+.13 Coupled with microorganisms, Mn2+ and Mn4+ can act as reducing and oxidizing agents in oceans, soils, continental shelves, and sediments to facilitate the formation of biochemical interactions. Moreover, the manganese redox cycle can efficiently augment microbial metabolic processes. Specifically, Mn2+ acts as a reductant to provide an electron donor for anaerobic denitrification reactions, including Mn2+-driven denitrification and Mn2+ oxidation combined with nitrification.14 He et al.15 found that 0.5 mg L−1 significantly stimulated denitrification by Arthrobacter arilaitensis Y-10. Liu et al.16 revealed that under sustained manganese–humic acid complex domestication conditions, the sludge microbial community may have evolved into an energy-efficient consortium of short-cut nitrification, denitrification, and anaerobic ammonia oxidation to achieve excellent ammonium removal. However, little attention has been paid to the influence of Mn2+ on the removal of NO3−–N by anaerobic sludge.
Therefore, this study focused on the effect of Mn2+ on the NO3−–N removal capacity of anaerobic sludge. The relationship between Mn2+ and microbial community structure was also analyzed. The results provide a reference for the application of anaerobic sludge to the Mn2+-containing nitrate wastewater.
2. Results and discussion
2.1. Effect of Mn2+ on nitrogen transformation in anaerobic sludge
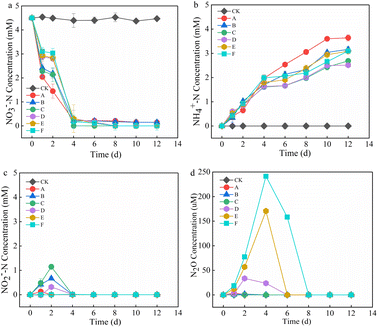
The effect of Mn2+ on NO3−–N removal is shown in Fig. 1a. In the initial stage (0–2 d), the NO3−–N removal rate of the treatment groups was in the order of A > C > B > D > E > F, and the NO3−–N removal rate of the control group was significantly higher than that of the other treatment groups. This may have occurred because the addition of Mn2+ hindered the adaptation of microorganisms involved in denitrification, and the microorganisms were in a stagnant period of growth and metabolism, which decelerated the NO3−–N removal rate. With an increase in time, the microorganisms adapted to the environment and started to develop, the NO3−–N removal rates of the treatment groups exceeded that of the control group, and NO3−–N was completely removed within 6 d in the treatment group with >5 mM Mn2+. The average NO3−–N removal rate of groups with >10 mM Mn2+ increased by 0.404, 0.429, and 0.697 mM d−1 after 2–4 d compared with the initial stage, and the NO3−–N was completely removed within 8 d, which indicated that the addition of Mn2+ promoted NO3−–N removal. This might be because there are manganese-oxidizing bacteria in the anaerobic sludge and they oxidised Mn2+ to form Bio-MnOx to stimulate nitrogen removal.7,16–18 The NH4+–N concentration of each treatment group increased continuously with time, first, at a fast rate and then at a slower rate, followed by a levelled period (Fig. 1b). This may have occurred because of the higher degree of protein hydrolysis at the early reaction stage. The faster growth of NH4+–N and the later stage of the sludge entering the methanogenic stage was coupled with the depletion of nutrients, which reduced the protein content and decelerated the NH4+–N growth.19 With the increase in Mn2+, the NH4+–N content decreased and then increased, and the lowest NH4+–N concentration was observed in the group with the addition of 10 mM Mn2+. This could be attributed to the fact that as the Mn2+ content increased, the extreme environment enhanced sludge hydrolysis, which led to an increase in the production of NH4+–N. Moreover, the utilization of NH4+–N might be affected by the bacterial activity of ammonia oxidation and the nitrate anisotropic reduction to ammonia (DNRA). NO2−–N and N2O are common intermediates in denitrification, and their production is shown in Fig. 1c and d. At different stages, both NO2−–N and N2O accumulated, and their concentrations increased and then decreased to 0 mg L−1. The groups treated with 1, 5, and 10 mM Mn2+ presented higher accumulation of NO2−–N on day 2, and the group treated with 5 mM Mn2+ presented the highest accumulation. However, there was no accumulation in any of the treatment groups after 4 d. Previous studies have shown that high Mn2+ concentrations under pure bacterial conditions can lead to higher NO2−–N accumulation.13 However, the NO2−–N produced in this study did not accumulate. The following processes may have occurred: (1) complete denitrification; (2) anaerobic ammonia oxidation with NH4+–N from sludge hydrolysis to produce N2; (3) production of NH4+–N via the DNRA pathway. The groups treated with 10, 15, and 20 mM Mn2+ showed detectable accumulation of N2O in the first 8 d, with production in the order of F > E > D. However, there was no N2O accumulation in the other treatment groups, probably because the increase in Mn2+ addition stimulated denitrification and inhibited anaerobic ammonia oxidation.2.2. Effect of Mn2+ on TN removal and Mn2+ changes in anaerobic sludge
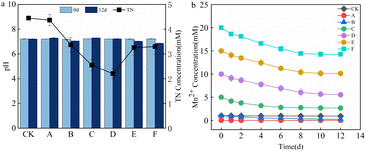
The TN concentration and pH changes in the supernatant after 12 d are shown in Fig. 2a. Owing to the low organic nitrogen content in the supernatant, NO3−–N was totally removed, and there was no accumulation of NO2−N. The supernatant TN concentration in the system was nearly the same as the NH4+–N accumulation. The supernatant TN removal rates of groups A to F were 2.95, 25.13, 43.42, 50.96, 27.66, and 26.76%, respectively. As the Mn2+ content increased, the TN removal first increased and then decreased. The pH of each treatment group measured on day 12 did not change significantly, which indicated that the sludge AD system was stable. During the AD, the degradation of nitrogenous organic matter increased the alkalinity of the system, and the production and dissolution of CO2 generated carbonic acid, which formed a buffer system. This buffer balanced the small-scale fluctuation of the acid base.20 Fig. 2b shows the variation in Mn2+ concentration. According to previous studies, Mn2+ might be involved in the following processes.21–23| 2Mn2+ + O2 + 4OH− → 2MnO2 + 2H2O | (1) |
| 5Mn2+ + 2NO3− + 4H2O → 5MnO2 + N2 + 8H+ | (2) |
| 3MnO2 + 2NH4+ + 4H+ → 3Mn2+ + N2 + 6H2O | (3) |
| 4MnO2 + NH4+ + 6H+ → 4Mn2+ + NO3− + 5H2O | (4) |
Mn2+ can act as an electron donor for denitrification and be oxidized. Ammonia-oxidizing bacteria can reduce MnO2 to Mn2+ under anoxic manganese-rich conditions.17,22 Mn2+ oxidation usually occurs in environments rich in organic compounds and microorganisms, and Mn2+ acts as a reducing agent in anaerobic oxidation reactions, supplying electrons to a variety of biochemical processes, including denitrification and anaerobic photosynthesis. The anaerobic sludge added to each treatment group contained organic matter and microorganisms. Therefore, the Mn2+ concentration decreased in all treatment groups. The gradual decrease in Mn2+ removal efficiency with increasing Mn2+ concentration might be attributed to the fact that the microorganisms have a higher activity and can better utilize Mn2+ for denitrification in an environment with low Mn2+ concentration. Alternatively, more MnO2 was reduced to Mn2+ as the activity of ammonia-oxidizing bacteria increased with increasing Mn2+ concentration. The Mn2+ concentration remained almost unchanged in the CK group, the kinetics of abiotic Mn oxidation were essentially low, and it has been shown that abiotic manganese oxidation does not occur at pH 7.2,24 so the Mn2+ concentration in the CK group remains constant.
2.3. Microbial community changes under different Mn2+ concentrations
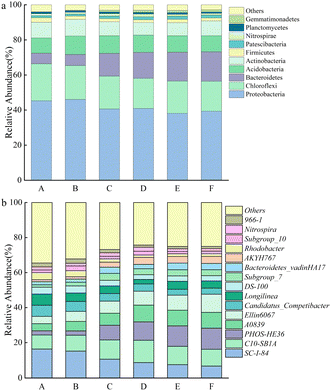 | ||
| Fig. 4 Relative abundance of bacterial communities at the (a) phylum and (b) genus level. A, B, C, D, E, and F represent the groups treated with 0, 1, 5, 10, 15, and 20 mM of Mn2+, respectively. | ||
At the genus level, the bacteria associated with denitrification in the top 15 dominant genera included SC-I-84, C10-SB1A, PHOS-HE36, Ellin6067, Candidatus_Competibacter, Subgroup_10, and Nitrospira.29–31 SC-I-84 is known as an anaerobic ammonia-oxidizing bacteria.32 As the Mn2+ concentration increased, the relative abundance of SC-I-84 gradually decreased, and anaerobic ammonia oxidation gradually weakened (Fig. 4b). C10-SB1A is considered a DNRA bacteria,31 and its relative abundance first increased and then decreased with the increase in Mn2+ concentration, and reached the maximum in the group with 10 mM Mn2+ treatment. The phenomenon revealed that the DNRA in the system was first enhanced and then weakened. Some studies have shown that PHOS-HE36 and Subgroup_10 are denitrifying bacteria,33 and the relative abundance of PHOS-HE36 gradually increased as the Mn2+ concentration increased, indicating the gradually strengthening of denitrification. Candidatus_Competibacter are glycogen-accumulating organisms (GAOs) that can store nutrients. GAOs are functional bacteria in the process of endogenous denitrification of treated municipal wastewater, which can convert NO3−–N and NO2−–N to N2.31 As the Mn2+ concentration increased, the relative abundance of Candidatus_Competibacter gradually decreased, and endogenous denitrification weakened. Ellin6067 is an ammonia-oxidizing bacteria (AOB), which oxidizes ammonia to nitrite. AOB are autotrophic bacteria that oxidize NH4+–N for energy by using CO2 as a carbon source.34 Nitrospira is a complete ammonia-oxidizing bacteria (comammox), whose genome contains a complete genetic material encoding the full process of ammonia oxidation and nitrite oxidation, and they can directly oxidize NH4+ to NO3−.35 As the Mn2+ concentration increased, the relative abundance of Ellin6067 gradually increased, which promoted the conversion of NH4+–N to NO2−–N; whereas the relative abundance of Nitrospira first increased and then decreased. The relative abundance of the group treated with 10 mM Mn2+ was the largest, and Nitrospira presented the highest utilization rate of NH4+–N. In summary, the removal of NO3−–N occurred through the combined action of denitrification, ammonia oxidation, and DNRA. As the Mn2+ concentration increased, denitrification was gradually enhanced, anaerobic ammonia oxidation was slowly weakened, and DNRA was first enhanced and then weakened, microbial communities may have evolved towards an energy-efficient association of short-cut nitrification, denitrification, and anaerobic ammonia oxidation. The concentration of NH4+–N accumulated in the supernatant decreased and then increased with increasing Mn2+ concentration under the combined action of hydrolysing bacteria, AOB, comammox, and DNRA.
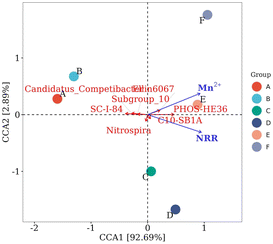 | ||
| Fig. 5 Microbial CCA related to denitrification at the genus level. A, B, C, D, E, and F represent the groups treated with 0, 1, 5, 10, 15, and 20 mM of Mn2+, respectively. | ||
The wastewater used in this study is synthetic groundwater formulated according to the actual situation, which cannot completely simulate the actual situation. In the future, pilot-scale experiments using actual wastewater would be conducted. Moreover, the effect of Mn2+ on NO3−–N removal by anaerobic sludge was investigated in this study. The results of the study are closely related to the microorganisms in the sludge, and may vary depending on the composition of the microbial community in different sludges.
3. Conclusions
Denitrification, anaerobic ammonia oxidation, and DNRA ensured the removal effect of NO3−–N in anaerobic sludge. The addition of Mn2+ promoted the removal efficiency of NO3−–N and TN. The fastest NO3−–N removal was obtained by the group treated with 5 mM Mn2+, and the best TN removal was found by the group addition with 10 mM Mn2+. The addition of Mn2+ contributed to the removal of NO3−–N mainly by promoting the growth of the genus PHOS-HE36 in the anaerobic sludge.4. Experimental
4.1. Domestication of anaerobic sludge
Sludge was obtained from the Xingchang Wastewater Treatment Plant, Zhejiang, China. The collected sludge was configured with an enrichment culture solution to domesticate anaerobic sludge and enrich it with anaerobic microorganisms. Serum vials of 500 mL were used to domesticate the sludge by adding 100 mL of sludge and 250 mL of enrichment culture solution. The vials were vented with nitrogen for 15 min, and then sealed with a lid to ensure an anaerobic environment. The enrichment solution consisted of 0.36 g per L KNO3, 0.21 g per L NaHCO3, 0.34 g per L KH2PO4, 0.086 g per L NH4Cl, 0.076 g per L MgCl2, 0.003 g per L CaCl2, and 0.25 mL per L trace element solution.36 The trace element solution consisted of 0.1 mg per L FeSO4·7H2O, 0.03 mg per L H3BO3, 0.036 mg per L Na2MoO4·2H2O, 0.12 mg per L MnCl2·2H2O, 0.07 mg per L ZnCl2; 0.12 mg per L CoCl2·6H2O, 0.024 mg per L NiCl2·6H2O, and 0.015 mg per L CuSO4·5H2O.37 The culture was transferred to a new vial and incubated every 5 days.4.2. Experimental design
Synthetic wastewater was used to simulate NO3−–N contaminated groundwater, and the synthetic wastewater consisted of 0.45 g per L KNO3, 0.14 g per L KH2PO4, 0.03 g per L MgCl2, 0.001 g per L CaCl2, 0.42 g per L NaHCO3, and 0.1 mL per L trace element.36In the batch experiments, synthetic groundwater was used to simulate groundwater conditions in the presence of both heavy metals and NO3−–N. For that, 50 mL of synthetic groundwater was added to 100 mL serum bottles. The experimental group with 1 mM Mn2+ and no sludge was added as a blank control (CK), and the experimental group with 2 g of cultured anaerobic sludge without Mn2+ was added as the control group (A). All other experimental groups, that is, B, C, D, E, and F, were added with 2 g of anaerobic sludge, and the initial Mn2+ concentrations were set to 1, 5, 10, 15, and 20 mM Mn2+, respectively, according to different levels of Mn2+ contamination. The initial pH was adjusted to 7.2. Each serum vial was rinsed with nitrogen for 15 min and then sealed with a cap to ensure an anaerobic environment. Samples were withdrawn at 150 rpm and 30 °C on days 1, 2, 4, 6, 8, 10, and 12 to determine the contents of NO3−–N, NO2−–N, NH4+–N, N2O, and Mn2+. The pH and total nitrogen (TN) content of the supernatant were measured on days 0 and 12. On day 12, the sludge was also collected for 16S rRNA high-throughput sequencing. Three replicates were set for both the treatment and control groups.36
4.3. Analysis methods for abiotic indicators
The concentrations of NH4+–N, NO2−–N, NO3−–N, and TN were determined using standard methods.38 NH4+–N was quantified using indophenol-blue spectrophotometry at 625 nm. NO2−–N was measured using N-(1-naphthalene)-diaminoethane spectrophotometry at 540 nm. NO3−–N was assessed using ultraviolet spectrophotometry at 220 and 275 nm. TN was assessed using alkaline potassium persulfate digestion-ultraviolet spectrophotometry at 220 and 275 nm. N2O content was determined using gas chromatography. Mn2+ concentration was determined using inductively coupled plasma emission spectrometry. The pH value was determined using a pH meter.4.4. High-throughput sequencing analysis
After centrifugation of different treatment groups for 12 d, the sludge was placed in 10 mL centrifuge tubes, labelled according to different treatments, and sent to Nanjing Paisenuo Gene Technology Co., Ltd for sequencing. Primers 338F (5′-ACTCCTACGGGGAGGCAGCA-3′) and 806R (5′-GGACTACHVGGGGTWTCTAAT-3′) were used to amplify the V3–V4 region of the bacterial 16S rRNA gene.394.5. Data processing and analysis
Excel 2016 and Origin 2018 were used for data processing and plotting. SPSS 22.0 was used for the analysis of significance.Author contributions
Jiang Zhaojie: experimental design, data analysis and writing – original draft. Huang Xuejiao: resources, methodology and writing – review & editing. Wang Shuangfei: project administration, funding acquisition. Xiong Jianhua: writing – review & editing. Chen Yongli: experimental design and methodology. Xie Chunmin: methodology.Conflicts of interest
There are no conflicts to declare.Acknowledgements
This project was funded by China Postdoctoral Science Foundation (2022M710850); Technological Innovation Team for Efficient Management of Mariculture Tailwater in Beibu Gulf (GuikeAD23026330); Nanning Innovation and Entrepreneur Leading Talent Project (2021001).References
- M. Arauzo, Sci. Total Environ., 2017, 575, 799–812 CrossRef CAS PubMed.
- J. Liu, J. Su, A. Ali, Z. Wang and R. Zhang, J. Hazard. Mater., 2022, 423, 126976 CrossRef CAS PubMed.
- A. Bhatnagar and M. Sillanpää, Chem. Eng. J., 2011, 168, 493–504 CrossRef CAS.
- Y. Hu, G. Wu, R. Li, L. Xiao and X. Zhan, Water Res., 2020, 179, 115914 CrossRef CAS PubMed.
- G. B. Li, X. Du, H. Yu, Q. Rong, S. Fang and H. Liang, J. Water Process. Eng., 2016, 52, 9–16 Search PubMed.
- J. Wu, Y. Yin and J. Wang, Int. J. Hydrogen Energy, 2018, 43, 1–15 CrossRef CAS.
- X. Luo, C. Peng, P. Shao, A. Tang, A. Huang, Q. Wu, L. Sun, L. Yang, H. Shi and X. Luo, Environ. Res., 2021, 194, 110744 CrossRef CAS PubMed.
- T. Li and Z. P. Li, BioChem, 2022, 8, 131–134 Search PubMed.
- D. Jiang and H. B. Yu, Water Sci. Technol., 2016, 42, 133–136 CAS.
- Y. Zong and N. Y. Ji, Environ. Technol. Innovation, 2013, 18, 20 Search PubMed.
- P. L. McCarty, Public Works, 1964, 95, 107–112 CAS.
- S. I. You, Y. P. Tsai and R. Y. Huang, Environ. Eng. Sci., 2009, 26, 1207–1215 CrossRef CAS.
- Y. H. Bai, Y. Y. Chang, J. S. Liang, C. Chen and J. H. Qu, Water Res., 2016, 106, 126–134 CrossRef CAS PubMed.
- Y. Wang, Y. H. Bai, J. F. Su, A. Ali, Z. H. Gao, T. L. Huang, M. Cao and M. Q. Ren, Chem. Eng. J., 2023, 461, 141878 CrossRef CAS.
- T. X. He, D. T. Xie, J. P. Ni, Z. Li and Z. L. Li, Water, 2020, 12, 1701–1712 CrossRef.
- Y. Liu, Y. Wang, X. Song, X. Hou, X. Cao and Y. Wang, Sci. Total Environ., 2023, 899, 165656 CrossRef CAS PubMed.
- Y. H. Bai, J. F. Su, Q. Wen, T. L. Huang, Q. Chang and A. Ali, J. Hazard. Mater., 2021, 408, 124414 CrossRef CAS PubMed.
- X. Wang, G. J. Xie, N. Tian, C. C. Dang, C. Cai, J. Ding, B. F. Liu, D. F. Xing, N. Q. Ren and Q. Wang, Sci. Total Environ., 2022, 822, 153513 CrossRef CAS PubMed.
- L. X. Ai, F. Deng, F. Hu and X. H. Zhang, Ind. Water Treat., 2019, 39, 69–73 Search PubMed.
- J. X. Zuo, J. Z. Hu, Z. Lu and X. S. Gu, China Biogas, 1998, 1, 3–7 Search PubMed.
- Y. H. Bai, J. F. Su, A. Ali, Q. Chang, Z. H. Gao, Y. Wang and Y. Liu, Sci. Total Environ., 2022, 810, 151185 CrossRef CAS PubMed.
- D. Swathi, P. C. Sabumon and S. M. Maliyekkal, Int. Biodeterior. Biodegrad., 2017, 119, 499–510 CrossRef CAS.
- H. Yu and J. R. Leadbetter, Nature, 2020, 583, 453–458 CrossRef CAS PubMed.
- I. A. Katsoyiannis and A. I. Zouboulis, Water Res., 2004, 38, 1922–1932 CrossRef CAS PubMed.
- D. Flores-Rentería, A. Rincón, F. Valladares and J. Curiel Yuste, Soil Biol. Biochem., 2016, 92, 79–90 CrossRef.
- R. Liao, K. Shen, A. M. Li, P. Shi, Y. Li, Q. Shi and Z. Wang, Bioresour. Technol., 2013, 134, 190–197 CrossRef CAS PubMed.
- X. Zhou, Z. Y. Yin, D. L. Ge, G. L. Wang and W. Zhang, J. Chem. Technol. Biotechnol., 2020, 95, 2229–2236 CrossRef.
- G. Capson-Tojo, R. Moscoviz, D. Ruiz, S. C. Gaëlle, T. Eric, R. Maxime, C. Marion, S. Jean-Philippe, G. Nicolas, D. Jean-Philippe and E. Renaud, Bioresour. Technol., 2018, 260, 157–168 CrossRef CAS PubMed.
- C. Wang, Q. N. Lin, Y. Y. Yao, R. H. Xu, X. S. Wu and F. F. Meng, Bioresour. Technol., 2022, 358, 127373 CrossRef CAS PubMed.
- S. Q. Zhang, Z. Kong, H. Wang, Q. Yan, D. V. Vayenas and G. S. Zhang, Chem. Eng. J., 2022, 433, 133535 CrossRef CAS.
- J. Y. Zhen, Y. Y. Zhao, X. F. Yu, W. S. Guo, Z. M. Qiao, S. Ismail and S. Q. Ni, ACS ES&T Water, 2022, 2, 1119–1131 Search PubMed.
- Y. P. Song, H. Gong, Q. Yuan, F. M. Chang, J. B. Wang and W. Kaijun, J. Environ. Sci., 2021, 41, 70–82 CAS.
- X. Xin, B. X. Li, X. Liu, W. Y. Yang and Q. Liu, J. Environ. Manage., 2023, 331, 117298 CrossRef CAS PubMed.
- X. K. Li, C. K. Liu, H. W. Xie, Y. J. Sun, S. W. Xu and G. G. Liu, Chemosphere, 2023, 320, 138097 CrossRef CAS PubMed.
- Y. Y. Shi, H. X. Ming, Q. R. Chen, Y. Yu and J. F. Fan, Microbiol. Bull., 2021, 48, 2895–2901 Search PubMed.
- Y. M. Pang and J. L. Wang, Bioresour. Technol., 2021, 342, 125960 CrossRef CAS PubMed.
- Y. M. Pang, J. L. Wang, S. J. Li and G. D. Ji, ACS ES&T Water, 2021, 1, 1566–1576 Search PubMed.
- State Environmental Protection Administration of China, Water and Wastewater Analysis Methods, China Environmental Science Press, Beijing, China, 2002, pp. 132–286 Search PubMed.
- Y. M. Pang and J. L. Wang, Bioresour. Technol., 2020, 318, 124105 CrossRef CAS PubMed.
| This journal is © The Royal Society of Chemistry 2024 |

