 Open Access Article
Preparation of Fe-BN-C catalysts derived from ZIF-8 and their performance in the oxygen reduction reaction†
Jialu Ma,
Wei Zhang,
Feng Yang,
Yingge Zhang,
Xiaojun Xu,
Guipeng Liu,
Huiyu Xu,
Gaochong Liu,
Zhihui Wang and
Supeng Pei *
*
School of Chemical and Environmental Engineering, Shanghai Institute of Technology, Shanghai 201418, China. E-mail: peisupeng@126.com
First published on 5th February 2024
Abstract
Enhancing the oxygen reduction reaction (ORR) activity and stability of the fuel cell cathode electrocatalysts and reducing their costs are critical. In response to this need, Fe, B, and N co-doped hollow mesoporous carbon materials were prepared by a simple chemical doping one-step pyrolysis method using ZIF-8 as a precursor. The results showed that the optimized catalyst displayed a higher limiting current density (6.154 mA cm−2) and half-wave potential (0.859 V), which showed significant enhancement compared with the Pt/C catalyst (5.487 mA cm−2 and 0.853 V). Moreover, the optimized catalyst had outstanding long-term stability with a current density retention higher than 91% after 36![[thin space (1/6-em)]](https://www.rsc.org/images/entities/char_2009.gif) 000 s of stability testing. This work provides a facile strategy for the design of outstanding ORR performance of non-precious metal oxygen reduction catalysts.
000 s of stability testing. This work provides a facile strategy for the design of outstanding ORR performance of non-precious metal oxygen reduction catalysts.
1. Introduction
To address the ongoing increase in energy consumption and increasing severity of environmental pollution, there is an urgent need to develop sustainable and clean energy sources to replace fossil fuels.1 Hydrogen energy, as a sustainable, nontoxic, and environmentally friendly energy source, differs fundamentally from fossil fuels. Fuel cells are practical types of hydrogen energy conversion systems, and their eco-friendly characteristics and high energy density have attracted considerable attention. However, the kinetic process of the cathode in the fuel cell is slow. Traditional platinum group metal (PGM) catalysts are commonly used.2,3 Unfortunately, PGM catalysts often have a limited stock and are expensive, which to some extent limits the large-scale application of fuel cells.4 Although many studies have attempted to reduce platinum usage through alloying5 and nanostructuring,6 adopting nonprecious metals as alternatives to platinum remains a more promising strategy.7 Therefore, identifying catalysts capable of replacing the precious metal platinum in the oxygen reduction reaction (ORR) has become crucial.In recent years, a variety of nonprecious metal materials such as transition metal nitrides,8 heteroatom-doped carbon materials,9 and transition metal-based carbon materials,10 metal–nitrogen–carbon (such as M–N–C, M = Fe, Co, Ni) materials in particular can considerably improve the ORR performance.11 In particular, Fe- and N-codoped carbon materials have excellent ORR performance due to the formation of highly reactive FeN4 sites,12 but further improvements are still needed to meet the requirements of practical applications. Metal–nitrogen–carbon can enhance catalytic activity by introducing a third heteroatom.13 Excitingly, the introduction of electron-deficient boron into the carbon skeleton can considerably modulate the distribution of electron density, tuning the chemistry of the material through the difference in the electronegativity between the heteroatom and carbon.14,15 For example, Yuan et al. demonstrated that a boron-containing carbon skeleton loaded with Fe–NX had higher ORR performance than Fe–N–C.16 Zhang et al. found that B-doping can weaken the strong interaction between Pd and graphene and reverse the microstructural changes on the graphene surface, thus improving the ORR activity of Pd/C.17 In addition, the difference in atomic size of these elements can lead to lattice distortions and band length changes, resulting in new catalytically active sites.18,19 B and N double doping methods are also used to construct high-performance catalysts because their atomic sizes are similar to those of carbon.20
In addition to optimizing the elemental composition of the catalysts, establishing a hierarchical porous structure in catalysts is considered a crucial pathway to enhance catalytic activity.21 In particular, carbon materials with large internal cavities and uniform mesoporous channels can effectively expose internal active sites, increasing the diffusion rate of the reactants and promoting the rapid release of products.22 Recently, zeolitic imidazolate framework-8 (ZIF-8), with its ordered porous structure, high nitrogen content, and high specific surface area, has attracted considerable attention and is considered an ideal precursor for synthesizing porous carbon materials.23
In this study, a simple and efficient chemical doping strategy was employed to enable the pyrolysis of boron atom-containing ZIF-8 precursors to form catalysts with hollow dodecahedral structures at high temperatures by introducing non-precious metal iron (Fe) atoms. Energy-dispersive X-ray spectroscopy (EDS) and X-ray photoelectron spectroscopy (XPS) results confirmed the successful doping of Fe atoms. Electrochemical tests confirmed that the successful doping of Fe atoms resulted in a significant increase in the activity and durability of the catalyst. To determine the optimal amount of metal addition to improve the catalytic activity and stability, the catalysts with different doping amounts of iron sources were characterised by measuring physical properties and analysed by electrochemical performance.
2. Experimental section
2.1 Materials
Ferric nitrate nonahydrate (Fe(NO3)3·9H2O, Adamas-beta), zinc nitrate hexahydrate (Zn(NO3)2·6H2O, Sinopharm), melamine (C3H6N6, Adamas-beta), phenylboronic acid (C6H7BO2, Adamas-beta), 2-methylimidazole (C4H6N2, Adamas-beta), ethanol (C2H5OH, Adamas-beta), hydrochloric acid (HCl, Adamas-beta), and methanol (CH3OH, Adamas-beta) were used. In this study, all reagents were used as-received without any additional purification.2.2 Synthesis of ZIF-8
To prepare the desired composite, solution A was prepared by dissolving 2.628 g of 2-methylimidazole in 30 mL of methanol at ambient temperature, followed by labelling. In parallel, solution B, comprising 1.188 g of Zn(NO3)2·6H2O dissolved in 15 mL of methanol was prepared. Subsequently, B was carefully combined with Solution A under continuous stirring for 24 h. The formed precipitate was separated through centrifugation and subsequently washed with methanol multiple times. The final precipitate was dried at 70 °C under vacuum overnight.2.3 Preparation of Fe-BN-C-X
To prepare Fe-BN-C-20, a solution of 400 mg of ZIF-8 powder, 400 mg of melamine powder, 20 mg of phenylboronic acid, and 20 mg of iron nitrate nonahydrate in 60 mL of ethanol was sonicated for 30 min and then vigorously stirred for 4 h under ambient conditions. The resulting mixture was dried under a vacuum and transferred to a tube furnace. The precursor was then heated to 900 °C at a heating rate of 3 °C min−1 and held for 3 h. Following the cooling of the tube furnace to room temperature, a black powder was obtained. To obtain the final catalyst sample, named Fe-BN-C-20, the black powder was ground and treated with 1 M HCl at 80 °C for 24 h, as shown in Scheme 1.For comparison purposes, different quantities of iron nitrate nonahydrate were added under identical conditions to produce BN-C (without Fe(NO3)3·9H2O), Fe-BN-C-10 (containing 10 mg Fe(NO3)3·9H2O), Fe-BN-C-40 (containing 40 mg Fe(NO3)3·9H2O), and Fe-BN-C-80 (containing 80 mg Fe(NO3)3·9H2O).
2.4 Physical characterization
The morphology of all the catalysts was studied using scanning electron microscopy (SEM, Nova Nano SEM 450). The internal morphology, structure, and pore sizes of all the samples were studied using transmission electron microscopy (TEM, JEOL JEM-2000FX). The specific surface area of all samples was determined using the Brunauer–Emett–Teller (BET, ASAP 2020 HD88) method, and the pore size distribution of the catalyst samples was calculated using the Barrett–Joyner–Halenda (BJH) model. The phase composition of all the samples was studied by X-ray diffraction (XRD, Bruker D8 Advance). Raman spectroscopy (Raman, Thermo Fisher H31XYZE-US) was used to analyze the degree of graphitization and the degree of defects in all the samples. The chemical properties of the catalyst surface were analyzed using X-ray photoelectron spectroscopy (XPS, AXIS Ultra DLD).2.5 Electrochemical characterization
All electrochemical measurements were performed on an Autolab PGSTAT302N (Metrohm) electrochemical workstation with a three-electrode system. The working electrode was a 3 mm diameter glassy carbon electrode tip with an effective response area of 0.07065 cm2; the Ag/AgCl (3.0 M KCl) electrode was used as the reference electrode; and the counter electrode was a platinum wire electrode. In this study, the values obtained with the Ag/AgCl reference electrode were converted to standard hydrogen electrode potentials. Catalyst ink was produced by sonicating 1 mg of the sample in the solution for 30 min using 10 μl of Nafion as the binder, 160 μl of ethanol, and 40 μl of deionized water as the dispersant. Twelve microliters of the catalyst ink were then applied to the working electrode and dried in air.Cyclic voltammetry (CV) and linear scanning voltammetry (LSV) tests were performed in 0.1 M KOH solution. LSV testing was performed at 400–2000 rpm with a scan rate of 10 mV s−1. The number of electrons transferred at different electrode potentials (n) was determined using the Koutecky–Levich equation:
 | (1) |
| B = 0.2nFDO22/3CO2bv−1/6 | (2) |
| |JK| = nFkfCO2b | (3) |
![[thin space (1/6-em)]](https://www.rsc.org/images/entities/char_2009.gif) 485 C mol−1), C0 is the volume concentration of O2 in 0.1 M KOH (1.21 × 10⁻³ mol L−1), D0 is the diffusion coefficient of O2 (1.9 × 10⁻⁵ cm2 s−1), and v is the kinematic viscosity (0.01 cm2 s−1). The i–t curve was obtained at 1600 rpm, and the methanol tolerance of the material was tested at 500 s by adding 3 mL of methanol to 0.1 M KOH and continuously running for 500 s.
485 C mol−1), C0 is the volume concentration of O2 in 0.1 M KOH (1.21 × 10⁻³ mol L−1), D0 is the diffusion coefficient of O2 (1.9 × 10⁻⁵ cm2 s−1), and v is the kinematic viscosity (0.01 cm2 s−1). The i–t curve was obtained at 1600 rpm, and the methanol tolerance of the material was tested at 500 s by adding 3 mL of methanol to 0.1 M KOH and continuously running for 500 s.
In addition, a rotating ring-disk electrode (RRDE) test was used to calculate the hydrogen peroxide yield (H2O2%) and the number of electron transfers (n) according to the following equation:
 | (4) |
 | (5) |
3. Results and discussion
3.1 Structural characterization
The morphologies of different samples were examined via SEM, and ZIF-8 demonstrated a truncated rhombic dodecahedron morphology with a size of approximately 200 nm (Fig. 1a). However, after the B or Fe atomic was doped, the regular structure was partially destroyed (Fig. 1b–f).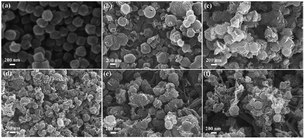 | ||
| Fig. 1 SEM images of (a) ZIF-8, (b) BN-C, (c) Fe-BN-C-10, (d) Fe-BN-C-20, (e) Fe-BN-C-40, and (f) Fe-BN-C-80. | ||
TEM images (Fig. 2a and b) revealed a hollow structure and thinner carbon layer within BN-C and Fe-BN-C-20 catalysts, which could enhance mass transfer rates. The corresponding energy-dispersive X-ray spectroscopy (EDS, Fig. 2c–g) elemental mapping of Fe-BN-C-20 confirmed the presence and uniform distribution of N, B, and Fe within the ZIF-8 structure.
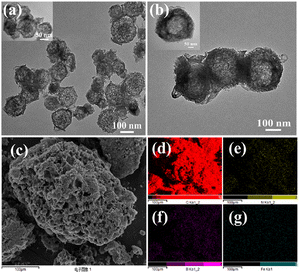 | ||
| Fig. 2 TEM images of (a) BN-C and (b) Fe-BN-C-20; (c) element mapping of (d) carbon, (e) nitrogen, (f) boron, and (g) iron in the Fe-BN-C-20 sample. | ||
Moreover, the specific surface area (SBET) and pore size distribution of different catalysts were measured (Fig. 3a and b). Compared with the control catalyst sample, the SBET values of Fe-BN-C catalysts were reduced, which may be attributed to the collapse of the unstable macropores. The SBET values of Fe-BN-C catalysts followed the order: Fe-BN-C-20 > Fe-BN-C-80 > Fe-BN-C-40 > Fe-BN-C-10 (Table S1†).
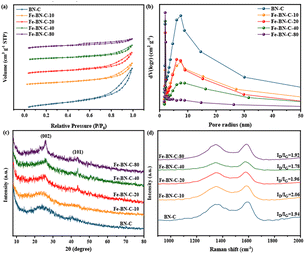 | ||
| Fig. 3 (a) N2 adsorption and desorption curves and (b) pore size distribution of different samples. (c) XRD and (d) Raman spectra of the catalyst samples. | ||
Furthermore, the pore size distribution of each catalyst sample was evaluated using the BJH model, and the findings are illustrated in Fig. 3b and Table S1.† With the increase in doping of Fe(NO3)3·9H2O, the average pore diameter showed a decreasing trend, which was attributed to the potential influence of Fe atoms on the pore structure and morphology of the catalyst.24 Among them, Fe-BN-C-20 has a high specific surface area of 435.8 m2 g−1 and an average mesoporous structure of 6.96 nm, which ensures high flux mass transfer.25,26 In addition, the hydrophilic angle test of the Fe-BN-C-20 catalyst (Fig. S1†) demonstrated that the sample had good hydrophilicity (61.5°), which is conducive to the penetration of the electrolyte.27 The catalytic active centers can then be effectively utilized to achieve high electrocatalytic performance.
The X-ray diffraction (XRD) patterns presented in Fig. 3c were used to identify the crystal structures of each catalyst sample. These spectra show a broadening of the peaks at approximately 26.2° and 42.2°, which corresponds to the (002) and (100) crystal planes, respectively, of amorphous carbon. The absence of metallic Fe or any other diffraction peaks provides additional evidence that Fe was uniformly dispersed on graphitic carbon, which is consistent with the elemental mapping analysis of the Fe-BN-C-20 sample. Thus, the XRD analysis confirmed that the catalysts possessed a highly dispersed Fe component on a graphitic carbon support. The calculated intensity ratios (ID/IG) of BN-C, Fe-BN-C-10, Fe-BN-C-20, Fe-BN-C-40, and Fe-BN-C-80 were reported to be greater than 1, with respective values of 1.94, 2.06, 1.96, 1.78, and 1.92 (Fig. 3d). Notably, the Fe-BN-C-20 sample exhibited the highest ID/IG ratio among the examined samples, indicating that it had the greatest number of defects. Such characteristics are conducive to generating more active sites for the oxygen reduction reaction (ORR) and can thereby enhance the catalytic performance of the material.28
To determine the surface chemical structure, the different catalysts were detected using X-ray photoelectron spectroscopy (XPS). As shown in the XPS results (Fig. 4a), Fe, B, N, O, and C signals appeared in the Fe-BN-C catalysts, illustrating the successful introduction of Fe and B elements in Fe-BN-C catalysts.
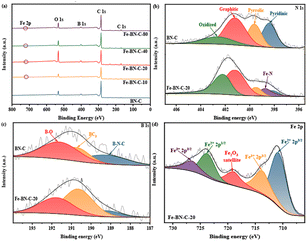 | ||
| Fig. 4 (a) Full spectra. (b) N 1s XPS spectra of BN-C and Fe-BN-C-20. (c) B 1s XPS spectra of BN-C and Fe-BN-C-20, and(d) Fe 2p XPS spectra of Fe-BN-C-20. | ||
To accurately measure the content of Fe element in the catalyst, ICP-MS analysis showed that the amount of Fe in the Fe-BN-C-20 catalyst was 2.53 wt% (Table S2†). To elucidate the elemental states of the catalysts, the N 1s XPS spectrum of the anti-fold product was examined, which exhibited peaks corresponding to the five nitrogen species, namely, pyridine-N (398.4 eV), Fe–N (398.7 eV), pyrrole-N (399.6 eV), graphite-N (401.1 eV), and oxide-N (402.5 eV), as presented in Fig. 4b and S2a.†29–31 In all the samples, graphite-N was reported to be the most abundant nitrogen species. Previous research has demonstrated the pivotal role of graphite-N in the formation of Fe–NX and the promotion of the four-electron transfer process of ORR.32,33 Compared with the BN-C catalyst, Fe–N species appeared in the Fe-doped catalyst, which provided more catalytic active sites for the catalyst.
Furthermore, the high-resolution B 1s XPS spectra depicted in Fig. 4c and S2b† verified that all the samples exhibited three valence states: B–N–C (189.2 eV), BC3 (190.7 eV), and B–O (191.6 eV).34,35 As cited by earlier investigations, the inclusion of BC3 in the catalysts can augment the efficiency of ORR owing to its robust electron donation capability. Moreover, the encapsulation of the adjacent boron and nitrogen atoms can reinforce the charge transmission from the adjacent carbon atoms, which consequently enhances the adsorption of O2 species and weakens the O![[double bond, length as m-dash]](https://www.rsc.org/images/entities/char_e001.gif) O bond. Such a synergistic effect is pivotal for the acceleration of ORR kinetics and the improvement of ORR activities.36–39
O bond. Such a synergistic effect is pivotal for the acceleration of ORR kinetics and the improvement of ORR activities.36–39
In Fig. 4d and S3,† an analysis of the high-resolution Fe 2p spectrum revealed the presence of three distinct peaks corresponding to the binding energies of Fe3+ (713.5 and 726.5 eV), Fe2+ (710.7 and 723.5 eV), and Fe2O3 satellite (718.8)40,41 indicating the coexistence of Fe3+ and Fe2+ species.42 The incorporation of both transition metal ions, Fe2+ and Fe3+, into carbon-based catalysts enhances their electrocatalytic activity, thereby promoting the efficiency of the oxygen reduction reaction. Furthermore, carbon-based catalysts doped with both Fe and heteroatoms such as B and N were synthesized and demonstrated improved ORR performance compared to that of BN-C catalysts. This enhancement was attributed to the introduction of the additional active sites in the catalysts through the incorporation of transition metal ions and heteroatoms, which facilitates the promotion of ORR catalytic performance.13,43,44
3.2 Electrochemical performance
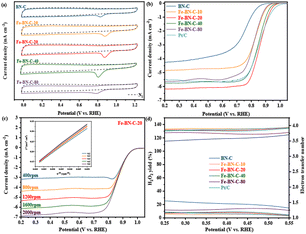
The oxygen reduction reaction (ORR) performance of all the samples was studied in a 0.1 mol L−1 KOH solution. The cyclic voltammetry (CV) curves of all the catalyst samples exhibited no obvious redox peaks in the saturated N2 electrolyte, but evident reduction peaks in the saturated O2 electrolyte, indicating the presence of catalytic activity in all the samples. The results of the ORR potential analysis are presented in Fig. 5a. Notably, among the five samples, Fe-BN-C-20 exhibited the most positive reduction peak, resulting in high catalytic capacity.The LSV polarization curves of the samples are shown in Fig. 5b, and the kinetic data of all the samples are provided in Table 1. Among all the prepared materials, Fe-NC-20 demonstrated the best catalytic performance, and its half-wave potential (E1/2 = 0.859 V) and limiting current density (JL = 6.154 mA cm−2) were much higher than that of BN-C (E1/2 = 0.735 V, JL = 4.250 mA cm−2). Note that the half-wave potential and limiting current density of Fe-BN-C-20 are better than those of 20% Pt/C catalyst (E1/2 = 0.853 V, JL = 5.487 mA cm−2). In addition, Fe-BN-C-20 outperformed other recently reported catalysts listed in Table 2.41–44
| Catalyst | Eonset (V vs. RHE) | E/1/2 (V vs. RHE) | JL (mA cm−2) |
|---|---|---|---|
| BN-C | 0.874 | 0.735 | 4.250 |
| Fe-BN-C-10 | 0.931 | 0.829 | 4.828 |
| Fe-BN-C-20 | 0.968 | 0.859 | 6.154 |
| Fe-BN-C-40 | 0.953 | 0.850 | 5.751 |
| Fe-BN-C-80 | 0.924 | 0.818 | 5.649 |
| Pt/C | 1.011 | 0.853 | 5.487 |
Moreover, based on the LSV polarization curves at different rotation speeds and by analyzing the ORR reaction pathway using the K–L equation according to the Koutecky–Levich (K–L) equation, it can be seen from Fig. 5c and 7 that, as the rotation speed increased within the range of 400 –2000 rpm, the current density increased due to the increase in oxygen diffusion to the electrode surface. By fitting the polarization curve within the potential range of 0.2–0.6 V vs. RHE, the K–L curve exhibited a linear correlation, and the electron transfer number (n) was close to 4.00, indicating that the ORR is a first-order reaction kinetic process.
However, the yield of H2O2 and the electron transfer number were accurately measured using a rotating ring-disk electrode (RRDE). A lower yield of H2O2 and an electron transfer number closer to 4.00 indicated a better catalytic effect of the catalyst sample, as shown in Fig. 5d. In the potential range of 0.25–0.55 V vs. RHE, the yield of H2O2 of the BN-C sample ranged from 14.85% to 25.52%, which was considerably higher than that of the catalyst sample doped with metal. The electron transfer number ranged from 3.49 to 3.70, which was lower than that of the catalyst sample doped with metal, proving again that adding an appropriate amount of metal improved the catalytic activity of the sample. Most importantly, the yield of H2O2 and the electron transfer number of Fe-BN-C-20 ranged from 3.56% to 7.10% and from 3.86 to 3.93, respectively, which were always lower than 8% and close to 4.00, respectively. Moreover, they were close to the yield of H2O2 (3.63–9.06%) and the electron transfer number (3.82–3.93) of commercial Pt/C. These results further confirmed that the catalytic process of the Fe-BN-C catalyst series involved a more efficient ORR 4e− pathway.
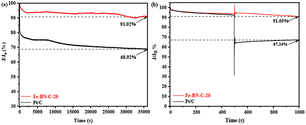
To ascertain the effectiveness of a catalyst, the cathode catalyst needs to exhibit exceptional methanol tolerance and stability. In light of this requirement, we conducted a comprehensive evaluation of the two catalysts, Fe-BN-C-20 and Pt/C, with particular emphasis on their capacity to maintain current over an extended duration. The result is shown in Fig. 6a; Fe-BN-C-20 showed only a slight loss of activity, with a retention rate of 91.02%. In contrast, Pt/C showed a larger decrease after 36![[thin space (1/6-em)]](https://www.rsc.org/images/entities/char_2009.gif) 000 s with a current retention rate of about 68.92%. This result indicated that Fe-BN-C-20 has good stability. In addition, SEM tests were conducted on the samples after stability tests, and the results are shown in Fig. S4.† Although the three-dimensional shape was damaged, the surface of the catalyst was still rough and porous, which ensured that the mass transfer rate was not affected during the oxygen reduction reaction. Fe is very important to the catalytic activity of the catalyst samples. Therefore, EDS was used to compare the samples before and after the stability test (Fig. S5 and Table S3†), and it was found that the proportion of Fe elements decreased slightly after the stability test. This may be due to the fact that in an alkaline environment, iron may form a soluble complex with hydroxide ions in the solution, and therefore migrate away from the catalyst surface. Moreover, Fig. 6b accentuates the superior resilience of the Fe-BN-C-20 catalyst against abrupt declines and oscillations in current, once exposed to methanol, in comparison to Pt/C. Drawing from these empirical findings, it becomes apparent that Fe-BN-C-20 displayed a heightened degree of stability and methanol tolerance, as opposed to Pt/C.
000 s with a current retention rate of about 68.92%. This result indicated that Fe-BN-C-20 has good stability. In addition, SEM tests were conducted on the samples after stability tests, and the results are shown in Fig. S4.† Although the three-dimensional shape was damaged, the surface of the catalyst was still rough and porous, which ensured that the mass transfer rate was not affected during the oxygen reduction reaction. Fe is very important to the catalytic activity of the catalyst samples. Therefore, EDS was used to compare the samples before and after the stability test (Fig. S5 and Table S3†), and it was found that the proportion of Fe elements decreased slightly after the stability test. This may be due to the fact that in an alkaline environment, iron may form a soluble complex with hydroxide ions in the solution, and therefore migrate away from the catalyst surface. Moreover, Fig. 6b accentuates the superior resilience of the Fe-BN-C-20 catalyst against abrupt declines and oscillations in current, once exposed to methanol, in comparison to Pt/C. Drawing from these empirical findings, it becomes apparent that Fe-BN-C-20 displayed a heightened degree of stability and methanol tolerance, as opposed to Pt/C.
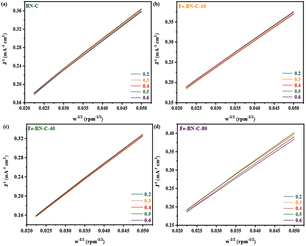 | ||
| Fig. 7 K–L plots of (a) BN-C, (b) Fe-BN-C-10, (c) Fe-BN-C-40 and (d) Fe-BN-C-80 at different potentials vs. RHE in O2 saturated 0.1 M KOH solutions (the LSV tests was repeated 3 times). | ||
4. Conclusions
In summary, in this study, Fe-BN-C hollow mesoporous carbon was successfully synthesized via a one-step pyrolysis method, and different materials were obtained by controlling the metal addition amount. It was found that Fe-BN-C-20 exhibited outstanding oxygen reduction reaction (ORR) performance, including higher initial potential (0.968 V vs. RHE), half-wave potential (0.859 V vs. RHE), limiting current density (6.154 mA cm−2), and a near four-electron transfer number (n = 3.93). Its performance was superior to that of commercial Pt/C catalysts, which was primarily attributed to the successful doping of Fe, B, and N heteroatoms and the hollow mesoporous structure. Furthermore, Fe-BN-C-20 demonstrated excellent durability and methanol tolerance. Consequently, the Fe-BN-C catalyst prepared in this study was characterized by its simplicity, high efficiency, and considerable application potential and is expected to have extensive application prospects in the field of fuel cells.Conflicts of interest
The authors declare that they have no known competing financial interests or personal relationships that could have appeared to influence the work reported in this paper.Acknowledgements
This research work was financially supported by the National Key R&D Program of China (2020YFB1505500 and 2020YFB1505503) and the Collaborative Innovation Fund of Shanghai Institute of Technology (XTCX2023-14). Meanwhile, this work also received help from the Shanghai Q-Carbon Materials Co., LtdReferences
- M. Tang, S. Zhang and S. Chen, Chem. Soc. Rev., 2022, 51, 1529–1546 RSC.
- M. Shao, Q. Chang, J.-P. Dodelet and R. Chenitz, Chem. Rev., 2016, 116, 3594–3657 CrossRef CAS PubMed.
- J. O. Abe, A. P. I. Popoola, E. Ajenifuja and O. M. Popoola, Int. J. Hydrogen Energy, 2019, 44, 15072–15086 CrossRef CAS.
- X. Qu, Y. Li, G. Li, R. Ji, S. Yin, X. Cheng, C. Wang, J. Yang, Y. Jiang and S. Sun, Electrochim. Acta, 2022, 403, 139604 CrossRef CAS.
- M. Escudero-Escribano, P. Malacrida, M. H. Hansen, U. G. Vej-Hansen, A. Velazquez-Palenzuela, V. Tripkovic, J. Schiotz, J. Rossmeisl, I. E. L. Stephens and I. Chorkendorff, Science, 2016, 352, 73–76 CrossRef CAS PubMed.
- M. Li, Z. Zhao, T. Cheng, A. Fortunelli, C.-Y. Chen, R. Yu, Q. Zhang, L. Gu, B. V. Merinov, Z. Lin, E. Zhu, T. Yu, Q. Jia, J. Guo, L. Zhang, W. A. Goddard, Y. Huang and X. Duan, Science, 2016, 354, 1414–1419 CrossRef CAS PubMed.
- A. A. Gewirth, J. A. Varnell and A. M. DiAscro, Chem. Rev., 2018, 118, 2313–2339 CrossRef CAS PubMed.
- L. Gong, H. Zhang, Y. Wang, E. Luo, K. Li, L. Gao, Y. Wang, Z. Wu, Z. Jin, J. Ge, Z. Jiang, C. Liu and W. Xing, Angew. Chem., Int. Ed., 2020, 59, 13923–13928 CrossRef CAS PubMed.
- R. Zhao, Q. Li, Z. Chen, V. Jose, X. Jiang, G. Fu, J.-M. Lee and S. Huang, Carbon, 2020, 164, 398–406 CrossRef CAS.
- L. Jiang, J. Duan, J. Zhu, S. Chen and M. Antonietti, ACS Nano, 2020, 14, 2436–2444 CrossRef CAS PubMed.
- J. Chen, H. Li, C. Fan, Q. Meng, Y. Tang, X. Qiu, G. Fu and T. Ma, Adv. Mater., 2020, 32, 2003134 CrossRef CAS PubMed.
- X. Qiu, X. Yan, H. Pang, J. Wang, D. Sun, S. Wei, L. Xu and Y. Tang, Adv. Sci., 2019, 6, 1801103 CrossRef PubMed.
- K. Yuan, D. Lützenkirchen-Hecht, L. Li, L. Shuai, Y. Li, R. Cao, M. Qiu, X. Zhuang, M. K. H. Leung, Y. Chen and U. Scherf, J. Am. Chem. Soc., 2020, 142, 2404–2412 CrossRef CAS PubMed.
- S. Dilpazir, R. Liu, M. Yuan, M. Imran, Z. Liu, Y. Xie, H. Zhao and G. Zhang, J. Mater. Chem. A, 2020, 8, 10865–10874 RSC.
- S. Chen, L. Zhao, J. Ma, Y. Wang, L. Dai and J. Zhang, Nano Energy, 2019, 60, 536–544 CrossRef CAS.
- K. Yuan, S. Sfaelou, M. Qiu, D. Lützenkirchen-Hecht, X. Zhuang, Y. Chen, C. Yuan, X. Feng and U. Scherf, ACS Energy Lett., 2018, 3, 252–260 CrossRef CAS.
- C. Zhang, S. Yu, Y. Xie, W. Zhang, K. Zheng, N. E. Drewett, S. J. Yoo, Z. Wang, L. Shao, H. Tian, J.-G. Kim and W. Zheng, Carbon, 2019, 149, 370–379 CrossRef CAS.
- X. Huang, Y. Wang, W. Li and Y. Hou, Sci. China: Chem., 2017, 60, 1494–1507 CrossRef CAS.
- Y. Zheng, H. Song, S. Chen, X. Yu, J. Zhu, J. Xu, K. A. I. Zhang, C. Zhang and T. Liu, Small, 2020, 16, 2004342 CrossRef CAS.
- Y. Zhang, H. Zhang, Y. Zhao, X. Han, H. Wang and Y. Gao, Appl. Surf. Sci., 2018, 457, 439–448 CrossRef CAS.
- Y. Guo, L. Feng, C. Wu, X. Wang and X. Zhang, ACS Appl. Mater. Interfaces, 2019, 11, 33978–33986 CrossRef CAS PubMed.
- Y. Wang, Z. Chen, R. Fang and Y. Li, ChemCatChem, 2019, 11, 772–779 CrossRef CAS.
- J. Wang, Y. Wang, Y. Liang, J. Zhou, L. Liu, S. Huang and J. Cai, Microporous Mesoporous Mater., 2021, 310, 110662 CrossRef CAS.
- Y. Wang, W. Chen, Y. Chen, B. Wei, L. Chen, L. Peng, R. Xiang, J. Li, Z. Wang and Z. Wei, J. Mater. Chem. A, 2018, 6, 8405–8412 RSC.
- W.-J. Niu, Y.-Y. Yan, R.-J. Li, W.-W. Zhao, J.-L. Chen, M.-J. Liu, B. Gu, W.-W. Liu and Y.-L. Chueh, Chem. Eng. J., 2023, 456, 140858 CrossRef CAS.
- W. Zhang, X. Guo, C. Li, J.-Y. Xue, W.-Y. Xu, Z. Niu, H. Gu, C. Redshaw and J.-P. Lang, Carbon Energy, 2023, 5, e317 CrossRef CAS.
- H.-F. Wang, C. Tang and Q. Zhang, Catal. Today, 2018, 301, 25–31 CrossRef CAS.
- L. Zhang, Z. Su, F. Jiang, L. Yang, J. Qian, Y. Zhou, W. Li and M. Hong, Nanoscale, 2014, 6, 6590–6602 RSC.
- Y. Tong, P. Chen, T. Zhou, K. Xu, W. Chu, C. Wu and Y. Xie, Angew. Chem., Int. Ed., 2017, 56, 7121–7125 CrossRef CAS PubMed.
- L. Jiao, G. Wan, R. Zhang, H. Zhou, S. Yu and H. Jiang, Angew. Chem., Int. Ed., 2018, 57, 8525–8529 CrossRef CAS PubMed.
- J. Ren, Z. Shi and Y. Huang, Int. J. Hydrogen Energy, 2023, 48, 12333–12341 CrossRef CAS.
- F. Tang, H. Lei, S. Wang, H. Wang and Z. Jin, Nanoscale, 2017, 9, 17364–17370 RSC.
- E. Antolini, ChemPlusChem, 2014, 79, 765–775 CrossRef CAS.
- R. Zhao, J. Chen, Z. Chen, X. Jiang, G. Fu, Y. Tang, W. Jin, J.-M. Lee and S. Huang, ACS Appl. Energy Mater., 2020, 3, 4539–4548 CrossRef CAS.
- L. Liao, Y. Zhao, C. Xu, X. Zhou, P. Wei and J. Liu, ChemistrySelect, 2020, 5, 3647–3654 CrossRef CAS.
- W. Chen, L. Xu, Y. Tian, H. Li and K. Wang, Carbon, 2018, 137, 458–466 CrossRef CAS.
- L. Yang, S. Jiang, Y. Zhao, L. Zhu, S. Chen, X. Wang, Q. Wu, J. Ma, Y. Ma and Z. Hu, Angew. Chem., Int. Ed., 2011, 50, 7132–7135 CrossRef CAS PubMed.
- C. Zhang, W. Zhang, S. Yu, D. Wang, W. Zhang, W. Zheng, M. Wen, H. Tian, K. Huang, S. Feng and J. J. Bentzen, ChemElectroChem, 2017, 4, 1269–1273 CrossRef CAS.
- S. Wang, E. Iyyamperumal, A. Roy, Y. Xue, D. Yu and L. Dai, Angew. Chem., Int. Ed., 2011, 50, 11756–11760 CrossRef CAS PubMed.
- E. Hu, X.-Y. Yu, F. Chen, Y. Wu, Y. Hu and X. W. D. Lou, Adv. Energy Mater., 2018, 8, 1702476 CrossRef.
- W. Yan, Y. Wu, Y. Chen, Q. Liu, K. Wang, N. Cao, F. Dai, X. Li and J. Jiang, J. Energy Chem., 2020, 44, 121–130 CrossRef.
- L. Zeng, X. Cui, L. Chen, T. Ye, W. Huang, R. Ma, X. Zhang and J. Shi, Carbon, 2017, 114, 347–355 CrossRef CAS.
- A. G. Saputro, A. K. Fajrial, A. L. Maulana, F. Fathurrahman, M. K. Agusta, F. T. Akbar and H. K. Dipojono, J. Phys. Chem. C, 2020, 124, 11383–11391 CrossRef CAS.
- J. Zhang, Y. Zhao, C. Chen, Y.-C. Huang, C.-L. Dong, C.-J. Chen, R.-S. Liu, C. Wang, K. Yan, Y. Li and G. Wang, J. Am. Chem. Soc., 2019, 141, 20118–20126 CrossRef CAS PubMed.
- Y. Liu, X. Liu, C. Zhang, Y. Chen, Z. Wang, G. Wei, J. Zhang, T. Yang, F. Zhang and S. Gao, J. Alloys Compd., 2023, 941, 168922 CrossRef CAS.
- N. H. Ahmad Junaidi, S. Y. Tan, W. Y. Wong, K. S. Loh, R. Saidur, T. F. Choo and B. Wu, Asia-Pac. J. Chem. Eng., 2023, 18, e2950 CrossRef CAS.
- J. Li, M. Lin, W. Huang, X. Liao, Y. Ma, L. Zhou, L. Mai and J. Lu, Small Methods, 2023, 7, 2201664 CrossRef CAS PubMed.
- N. Huang, W. Dong, Y. Feng, W. Liu, L. Guo, J. Xu and X. Sun, Dalton, 2023, 52, 2373–2383 RSC.
Footnote |
| † Electronic supplementary information (ESI) available. See DOI: https://doi.org/10.1039/d3ra07188j |
| This journal is © The Royal Society of Chemistry 2024 |


