 Open Access Article
Enhanced microwave absorption properties of conducting polymer@graphene composite to counteract electromagnetic radiation pollution: green EMI shielding†
Suman Kumariab,
Jasvir Dalal *c,
Anand Kumar*a,
Rishi Pald,
Ritu Chahale and
Anil Ohlan
 e
e
aDepartment of Physics, Chaudhary Ranbir Singh University, Jind, 126102, India. E-mail: anandkumar@crsu.ac.in
bDepartment of Physics, Maharani Kishori Jat Kanya Mahavidyalaya, Rohtak, 124001, India
cDepartment of Physics, Rajdhani College, University of Delhi, Delhi, 110015, India. E-mail: jasvirdalal2012@gmail.com
dDepartment of Applied Science, Kalpana Chawla Government Polytechnic, Ambala, 134003, India
eDepartment of Physics, Maharshi Dayanand University, Rohtak, 124001, India
First published on 2nd January 2024
Abstract
Conducting polymers have been thoroughly investigated and found to have extensive applications in the fields of microwave absorption and electromagnetic (EM) shielding owing to their distinctive characteristics and adaptability. In the present work, conducting polymer (PEDOT and polyaniline) and graphene composites were prepared via an in situ chemical polymerization technique. Further, these composite materials were characterized to determine their potential to address the issue of EM radiation pollution in the microwave frequency (12.4 GHz to 18 GHz). The PEDOT/graphene composites exhibited significant shielding effectiveness of up to 46.53 dB, achieving a green index (gs) of 1.17. Also, absorption was observed to be the dominant shielding mechanism in all the samples owing to significant dielectric losses (ε′′/ε′ ≈ 1.9–3.1) and microwave conductivity (σs = 19.9–73.6 S m−1) in the samples at 18 GHz. Both dielectric loss and conduction loss occurred because of the strong interactions involving polarization, charge propagation, and the creation of conductive routes through the incorporation of graphene in the polymer matrix. These properties/shielding results indicate the potential of the composites to be used as lightweight EM shielding materials. These materials are suitable shield materials for electronic devices to protect them from harmful electromagnetic radiation, making them vital in various applications.
1. Introduction
EM shielding provides protection against electromagnetic waves through the utilization of enclosures that are manufactured using electrically conductive and/or magnetic substances. In the last decade, the rapid development of electronic devices and wireless communication technologies has led to the continuous generation of electromagnetic (EM) waves in various domains, such as cellular communication, satellite transmission, navigation systems, and medical applications.1,2 These EM waves are essential for the seamless operation of electronic devices, leading to the accumulation of radiation in the surrounding space. Consequently, superfluous electromagnetic radiation can interfere with neighboring electronic devices, leading to a low performance and malfunction of electronic devices used for commercial and military purposes.3,4 Alternatively, prolonged exposure to electromagnetic radiation can have detrimental effects on living organisms, which include an elevated risk of human ailments, such as headaches, insomnia, immune deficiencies, and even psychological conditions, such as depression. This risk is particularly pronounced when individuals are subjected to high-frequency electromagnetic waves over extended periods.5,6 Thus, the topic of EMI shielding has gained considerable attention to ensure the uninterrupted operation of electronic devices and also the well-being of human health.Conventional metals have shown impressive capability to mitigate electromagnetic interference owing to their strong electronic conductivity.7,8 These metals typically reflect a significant portion of electromagnetic waves at their surface, resulting in the attenuation of incoming waves.9,10 Nevertheless, the use of metal-based shielding materials is constrained owing to their tendency to corrode, high density, limited flexibility, and expensive manufacturing processes. Moreover, they cause substantial surface reflections, contributing to secondary electromagnetic wave pollution.11
Thus, to address the limitations associated with metal-based shielding materials, conductive polymer composites (CPCs) have emerged as a promising alternative. CPCs offer several advantages, including a low density, excellent anticorrosion effects, high mechanical flexibility, and low processing cost.12–14 Moreover, CPCs with a low reflection of EM waves from their outer surface are particularly desirable for military applications, such as camouflage and stealth technology.15 These composites are formed by incorporating conductive fillers, which can be metal powder, carbon-based materials, and conductive polymer fibers, into the polymer matrix.16–20 However, the EM shielding effectiveness (SE) of CPCs is often lower than that of metals due to their comparatively lower electrical conductivity. Consequently, to improve the EMI shielding abilities of CPCs, a substantial quantity of conductive filler is required,21,22 which leads to mechanical degradation, increased costs, and processing challenges.23,24 In this case, the focus in the development of CPCs is to enhance their EMI SE, while minimizing the amount of conductive filler needed.
In recent times, the focus on shielding materials has shifted from metallic substances to intrinsic conductive polymers (ICPs) and CPCs. It has been reported that the formation of a conductive network inside the polymer matrix, selection of filler, and morphology design play a crucial role in determining the microwave attenuation capabilities of CPCs. Conductive fillers can be categorized into three groups, i.e., metallic fillers (MXene, liquid metal, Cu, Ag, Ni, etc.), carbon fillers (SWCNT, MWCNT, graphene, carbon black, carbon nanofibers, etc.), and intrinsic conductive polymers. Metallic fillers are suitable for endowing CPCs with higher EMI shielding properties to due to their exceptionally high electrical conductivity, but their practical application is limited by factors such as their cost, density, and questionable stability.25–27 Alternatively, carbon fillers have become widely accepted due to their lower density and strong electrical conductivity.28,29 In EM shielding applications, conductive fillers such as intrinsic conductive polymers including poly(3,4-ethylenedioxythiophene) (PEDOT) and polyaniline (PANI) can be utilized. Moreover, it has been reported that two-dimensional conductive fillers such as graphene exhibit a higher EM shielding performance compared to zero-, one-, and three-dimensional fillers.30–32 It has been reported that the multiple interfaces produced by fillers in the polymer matrix enhance the EM shielding capabilities of CPCs through several mechanisms, such as dielectric/conduction losses, attenuation, polarization, electronic resonance, and multiple scattering/reflections.33–35 Accordingly, to create multiple interfaces, various approaches have been utilized including core–shell/multilayered/sandwiched CPCs, porous/foamed CPCs, multiphase CPCs, segregated CPCs, and CPCs integrated with produced conductive networks.36–40
Based on the above discussion, herein, composites were synthesized using the conducting polymer PEDOT and PANI and graphene as conducting fillers. This work aimed to examine the impact of the structural, morphological, and electrical properties of the PEDOT composites on their EM shielding efficacy in the microwave frequency region. To the best of our knowledge, these composites have been not reported to date. The in situ synthesis approach enabled the controlled growth of the conducting polymer layers over graphene. The synergistic effect of the polymer materials and interfaces in the composites yielded an enhanced SE, and thus they show potential as highly suitable materials for various applications, including industrial and defense.
2. Experiential details
The composites were synthesized via an in situ chemical oxidative polymerization technique, as shown in Scheme 1. Details of the synthesis are presented in the ESI.† For convenience, the sample was coded based on the material composition, as shown in Table S1.†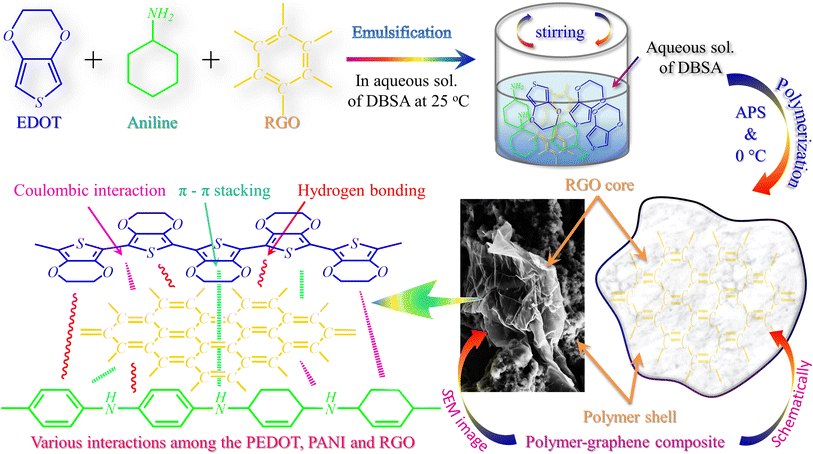 | ||
| Scheme 1 A schematic representation of the synthesis process of polymer and its composites and the different interactions among PEDOT, PANI, and RGO. | ||
3. Results and discussion
The synthesized samples were characterized to determine their structural and morphological properties, and also employed in dielectric studies and shielding measurements. The obtained results from the measurements are discussed below.3.1. X-ray diffraction (XRD) study
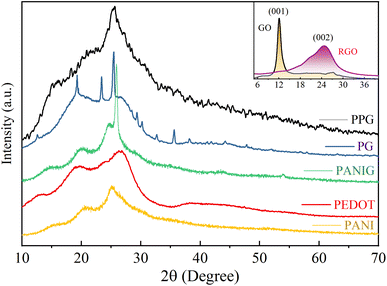
The structural details of the polymer composites were analyzed using X-ray diffraction patterns, as illustrated in Fig. 1. In the inset of this figure, the appearance of the typical diffraction peak at 2θ = 12° indicates the formation of graphene oxide (GO), representing the presence of numerous oxygen-functional groups.41 After the reduction of GO, the diffraction peak shifted at 2θ = 25.6° in pattern of RGO. This reduction reaction is associated with the elimination of functional groups containing oxygen atoms from the graphene layers, and consequently the interplanar spacing decreased from 7.37 Å to 3.48 Å, also confirming the conversion of GO to RGO (graphene). Moreover, the intensity of the diffraction peak of RGO decreased and its width increased compared to graphene oxide, indicating a lower degree of crystallinity in graphene than GO, which emphasizes the higher degree of exfoliation in RGO.The XRD patterns of PEDOT and PANI revealed that they possess a semicrystalline structure, as indicated by the two broad peaks at 2θ values of around 19° and 25°.12 These two peaks originated from the interchain planar ring stacking distance (d010) and inter-chain π–π stacking distance (d020) of PEDOT, respectively.42 The incorporation of graphene in the pristine polymers resulted in a transformation of their structural characteristics, i.e., shift from an amorphous state to a semi-crystalline structure. This transition is attributed to the various allotropes of carbon, which, upon the inclusion of graphene in PANI and PEDOT, can lead to the emergence of unique crystalline structures.43 The peaks located at 25.41°, 25.82° and 25.63° in the XRD patterns of the PG, PANIG, and PPG composites, respectively, show the presence of graphene in these samples with a minor shift compared to the inset plot of graphene, which may be caused by the solid-state charge transfer reaction among the materials, resulting in variations in their chain packing and configurations.
3.2. Microscopic study
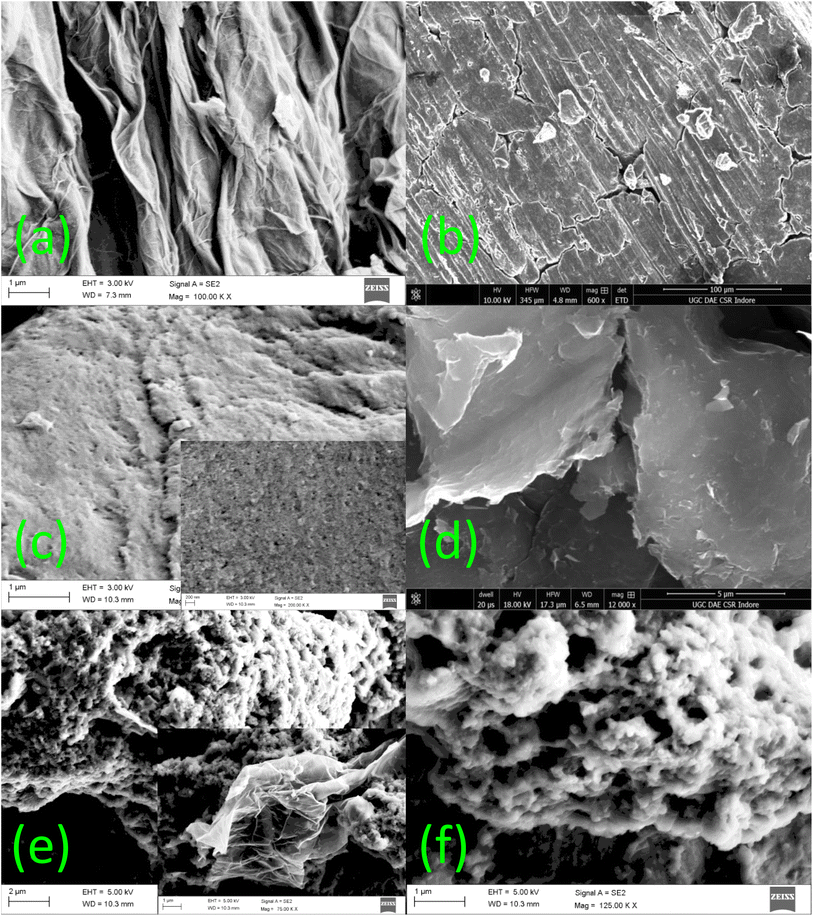
Fig. 2 shows the scanning electron microscopy (SEM) images for the morphological examination of the RGO, PANI, PEDOT, PG, and PPG samples. During the synthesis of RGO, the layers of the graphite flakes were successfully exfoliated, leading to a larger d-spacing and a structure resembling warped and crumpled RGO paper/sheets (Fig. 2(a)). The micrograph also reveals the very thin nature of the sheets, which exhibit surface crumples.As shown in Fig. 2(b and c), the SEM micrographs of PANI and PEDOT reveal a clustered and particulate structure with tiny pores. The inherent compressibility of the polymers is the origin of these pores. The SEM image of the PANIG composite indicates that the RGO sheets were entirely encapsulated by PANI, as depicted in Fig. 2(d). The SEM images of the PG composite are shown in Fig. 2(e), with the corresponding insets displaying higher-resolution views. During the polymerization process, PEDOT was polymerized on the surface of the RGO sheets. Nearly all the layers of graphene were successfully covered with the polymer due to the higher weight ratio of the monomer compared to RGO. This resulted in the formation of a core–shell morphology, in which PEDOT acted as the shell and RGO as the core, and a similar morphology was also observed in the PPG sample. The development of the core–shell morphology is widely acknowledged to play a role in augmenting microwave absorption characteristics by inducing supplementary dielectric losses. Moreover, S. Khasim et al. reported that the addition of RGO to a polymer matrix promotes multiple reflections of EM waves within the composite structure, thereby enhancing microwave absorption.44 Thus, the SEM micrographs reveal the presence of RGO in the polymer composites, which led to considerable morphological modifications in the pure polymer matrix, resulting in better electromagnetic properties.
3.3. Fourier transform infrared spectroscopy (FTIR) study
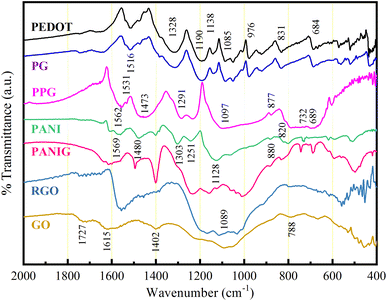
FTIR is a technique that provides information about the molecular vibrations, functional groups, and chemical bonds present in a sample by analyzing the interaction of molecules with infrared light. The FTIR spectrum of the samples are shown in Fig. 3.The FTIR spectrum of graphene oxide reveals the presence of several functional groups, including hydroxyl, carboxyl, and epoxide groups. The peaks for the oxygen-containing groups were observed at about 1402 cm−1, corresponding to the deformation vibrations of the H–O bonds, and 1089 cm−1, indicating the stretching vibrations of the C–O alkoxy group.45 Furthermore, the band at around 1727 cm−1 is attributed to the stretching vibrations of the COOH groups. The IR band at about 788 cm−1 is associated with the C![[double bond, length as m-dash]](https://www.rsc.org/images/entities/char_e001.gif) O stretching vibrations in carboxylic acid and carbonyl groups predominantly found at the edges of the graphene oxide surface.46 Furthermore, the band centered at about 1615 cm−1 signifies the presence of an unoxidized carbon backbone, corresponding to the sp2-hybridized aromatic C
O stretching vibrations in carboxylic acid and carbonyl groups predominantly found at the edges of the graphene oxide surface.46 Furthermore, the band centered at about 1615 cm−1 signifies the presence of an unoxidized carbon backbone, corresponding to the sp2-hybridized aromatic C![[double bond, length as m-dash]](https://www.rsc.org/images/entities/char_e001.gif) C bond vibrations. These findings collectively confirm the oxidation of the graphite material. Following the reduction of GO, there was a noticeable reduction in the intensity of these characteristic bands/peaks in GO, and some of them even disappeared. This observation strongly suggests the transformation of GO into RGO and the partial removal of its functional groups during the reduction process.
C bond vibrations. These findings collectively confirm the oxidation of the graphite material. Following the reduction of GO, there was a noticeable reduction in the intensity of these characteristic bands/peaks in GO, and some of them even disappeared. This observation strongly suggests the transformation of GO into RGO and the partial removal of its functional groups during the reduction process.
Table 1 provides an overview of the peak assignments for the PEDOT and PANI samples. The spectrum of PEDOT reveals distinct vibrational bands arising from specific molecular interactions. These include the vibrations associated with the stretching of the C![[double bond, length as m-dash]](https://www.rsc.org/images/entities/char_e001.gif) C bonds in the thiophene ring (about 1516 cm−1) and the stretching of the C–C bonds in the quinoid structure (1328 cm−1) of the thiophene ring.47 Moreover, other bands were observed at about 684, 831, and 976 cm−1, which are attributed to the interaction involving the carbon-sulfur (C–S) bond in the thiophene ring.43 According to the spectra of PG, it was observed that all the spectral peaks of PEDOT were also present in the composite, where PEDOT grew on the layers of RGO. This growth process established a solid-state charge transfer relationship between PEDOT and encapsulated RGO, resulting in a slight shift in the IR peaks of PEDOT due to the distinct electronic properties of these materials (RGO is a known electron acceptor, while PEDOT serves as a strong electron donor).
C bonds in the thiophene ring (about 1516 cm−1) and the stretching of the C–C bonds in the quinoid structure (1328 cm−1) of the thiophene ring.47 Moreover, other bands were observed at about 684, 831, and 976 cm−1, which are attributed to the interaction involving the carbon-sulfur (C–S) bond in the thiophene ring.43 According to the spectra of PG, it was observed that all the spectral peaks of PEDOT were also present in the composite, where PEDOT grew on the layers of RGO. This growth process established a solid-state charge transfer relationship between PEDOT and encapsulated RGO, resulting in a slight shift in the IR peaks of PEDOT due to the distinct electronic properties of these materials (RGO is a known electron acceptor, while PEDOT serves as a strong electron donor).
| Assignments of peaks | Observed bands (cm−1) | ||
|---|---|---|---|
| PANI | PEDOT | PPG | |
C![[double bond, length as m-dash]](https://www.rsc.org/images/entities/char_e001.gif) C stretching in quinoid structure C stretching in quinoid structure |
1569 | 1562 | |
C![[double bond, length as m-dash]](https://www.rsc.org/images/entities/char_e001.gif) C stretching in benzenoid structure C stretching in benzenoid structure |
1480 | 1473 | |
| N–H bending | 1251 | 1242 | |
| C–N (or C–C) stretching | 1303 | 1291 | |
| C–H stretching | 1128 | 1116 | |
| In-plane C–H bending | 880 | 877 | |
| Out-of-plane C–H bending | 820 | 817 | |
| C–C stretching in quinoidal structure | 1516 | 1531 | |
C![[double bond, length as m-dash]](https://www.rsc.org/images/entities/char_e001.gif) C stretching in quinoidal structure C stretching in quinoidal structure |
1328 | 1333 | |
| C–O–C stretching | 1190, 1138, 1085 | 1221, 1097 | |
| C–S in thiophene ring | 976, 831, 684 | 689 | |
The FTIR spectrum of PANI and its composite with graphene (labeled as PANIG) exhibited characteristic bands associated with the extensively conjugated polyaniline structure. In the characteristic region of PANI, the bands located at around 1569 and 1480 cm−1 correspond to the C![[double bond, length as m-dash]](https://www.rsc.org/images/entities/char_e001.gif) C stretching vibrations in the quinoid (N
C stretching vibrations in the quinoid (N![[double bond, length as m-dash]](https://www.rsc.org/images/entities/char_e001.gif) Q
Q![[double bond, length as m-dash]](https://www.rsc.org/images/entities/char_e001.gif) N) and benzenoid (N
N) and benzenoid (N![[double bond, length as m-dash]](https://www.rsc.org/images/entities/char_e001.gif) B
B![[double bond, length as m-dash]](https://www.rsc.org/images/entities/char_e001.gif) N) rings, respectively.42 The bands in the benzenoid and quinoid structure are related to the polaronic and bipolaronic charge species in PANI, respectively. The appearance of an absorption band at about 1303 cm−1 in the PANI and PANIG samples indicates the occurrence of π-electron delocalization in the polymer via protonation, which implies the successful doping of the samples by sulfonic acid.42 The other band at around 1251 cm−1 is related with the bending of the N–H bonds. Furthermore, a distinctive band was evident at approximately 1128 cm−1, which is associated with the stretching bond vibrations of the –NH+
N) rings, respectively.42 The bands in the benzenoid and quinoid structure are related to the polaronic and bipolaronic charge species in PANI, respectively. The appearance of an absorption band at about 1303 cm−1 in the PANI and PANIG samples indicates the occurrence of π-electron delocalization in the polymer via protonation, which implies the successful doping of the samples by sulfonic acid.42 The other band at around 1251 cm−1 is related with the bending of the N–H bonds. Furthermore, a distinctive band was evident at approximately 1128 cm−1, which is associated with the stretching bond vibrations of the –NH+![[double bond, length as m-dash]](https://www.rsc.org/images/entities/char_e001.gif) groups and the delocalization of electrons along the polymeric chain48. The presence of the band at ∼1128 cm−1 in the prepared materials indicates the successful synthesis of high-quality polyaniline, which characterized by an extended conjugation length. The band centered at ∼732 cm−1 can be attributed to the out-of-plane bending of the C–H bonds and deformation vibrations of the C–C bonds in the mono-substituted aromatic rings.
groups and the delocalization of electrons along the polymeric chain48. The presence of the band at ∼1128 cm−1 in the prepared materials indicates the successful synthesis of high-quality polyaniline, which characterized by an extended conjugation length. The band centered at ∼732 cm−1 can be attributed to the out-of-plane bending of the C–H bonds and deformation vibrations of the C–C bonds in the mono-substituted aromatic rings.
The IR spectra of the PPG composite show all the major characteristic bands associated with the conjugation structures of PEDOT, PANI, and graphene. These two polymers, i.e., PEDOT and PANI, possess analogous molecular chains, enabling the regular alignment of PEDOT on the surface of PANI due to the formation of hydrogen bonds and robust π–π interactions. The presence of C–N and C–O bonds in PANI may facilitate hydrogen bonding interactions between PANI and PEDOT. Furthermore, during the synthesis process, coulombic interactions occur between the positively charged protons on the PANI molecular chains and the negatively charged PEDOT, as observed from the shifting of the bands in the spectrum of the PPG composite, which appeared at 1251 cm−1 and 1128 cm−1 in the spectrum of PANI. This interaction plays a role in establishing a conductive network in the PPG composite. The changes in the intensity of these bands can also be correlated with the alterations in the electrical conductivity of the composites and the interaction among the materials, leading to polarization. These two parameters play a significant role in enhancing microwave absorption, which are discussed in the following section.
3.4. Dielectric properties analysis
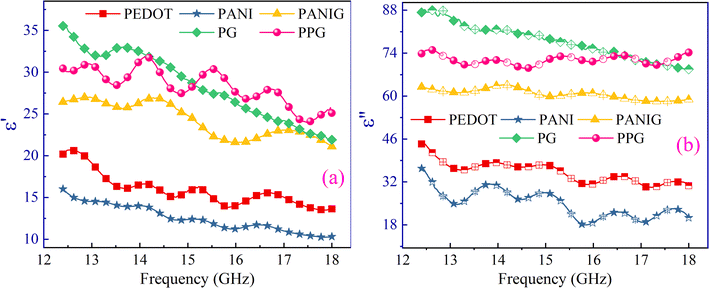
The conjugated polymers and their composites with graphene are considered non-magnetic conductive materials. Therefore, the shielding effectiveness of the samples is predominantly reliant on their dielectric properties, as represented by complex permittivity (εr = ε′ + iε′′). Both the real (ε′) and imaginary (ε′′) parts of permittivity of the composites increased via the addition of graphene to the composites. This is because of the increase in the number of hetero-interfaces (contributing in ε′) together with the number/mobility of free charge carriers (contributes in ε′′) with the incorporation of graphene in the polymer composites. Several factors may contribute to this behavior, including the disruption of parallel capacitance networks between the polymer chains owing to the inclusion of the very conductive RGO in the polymer, together with the variation in electronegativity between the nitrogen/sulfur atoms in PANI/PEDOT and the carbon atoms in RGO. Consequently, these properties facilitated the creation of numerous micro-capacitors, which lead to the generation of interfacial dipole moments.49The pronounced disparity in the values between the imaginary component of permittivity and its real counterpart highlights the attenuation behavior of the composite materials, which is attributed to the presence of a significant number of free charge carriers in the composites. Also, it is noteworthy that both parts (ε′ & ε′′) of permittivity exhibited a gradual decline with an increase in frequency. This behavior suggests a decrease in multiple forms of polarization in the materials, including electronic polarization linked to the redistribution of electronic charges, atomic/ionic polarization associated with their displacement and orientational/dipolar polarization arising from the inclusion of impurities. It is evident that the dielectric properties of the materials in this study are influenced by various polarization mechanisms, particularly in the lower-frequency domains. However, as the frequency increased, the contributions from the dipolar and lattice/ionic polarizations diminished significantly, leaving electronic polarization as the dominant factor in the dielectric properties.50 Hence, the decrease in the ε′ & ε′′ terms (shown in Fig. 4) can be attributed to the reduction in ionic/atomic and dipolar polarization in the higher-frequency domains. The incorporation of graphene in the polymer matrix and PANI in the PG composite appeared to influence the crystallinity, shape, and anisotropy character of the materials, leading to multiple scattering and interfacial polarization, which are further beneficial to improve the EM absorption capabilities and enhance the shielding properties of the materials.
Fig. 5(a) shows the frequency-dependent variation in the dielectric loss (ε′′/ε′). The inclusion of RGO in the polymer matrix resulted in an observed increase in dielectric loss, whereas the PPG sample showed lower dielectric loss than the PG composite. This observed variation in dielectric loss in the samples is reinforced by the increase in mobility/number of charge carriers, changes in space charge polarization due to the increase in heterogeneity in the composite, and improved conductivity. The overall dielectric loss values increased with the introduction of RGO in the polymer matrix, which is primarily owing to the significant contribution of electrical conductivity given that ε′′ has significantly higher values than ε′. Accordingly, the total dielectric loss in the PPG composite was lower than that of the PG composite. To gain insight into the phenomenon of dielectric loss, i.e., whether it is dominated by conduction or polarization, log(ε′′) was plotted versus log(frequency) for all the samples (Fig. 5(b)).51 If the plot between log(ε′′) and log(frequency) exhibits a sigmoidal pattern, the dielectric is primarily influenced by polarization relaxation rather than the conduction of charge carriers. However, the nearly linear trend observed for the sample suggests that conduction carriers play a dominant role in the dielectric loss, overshadowing the influence of polarization effects.51
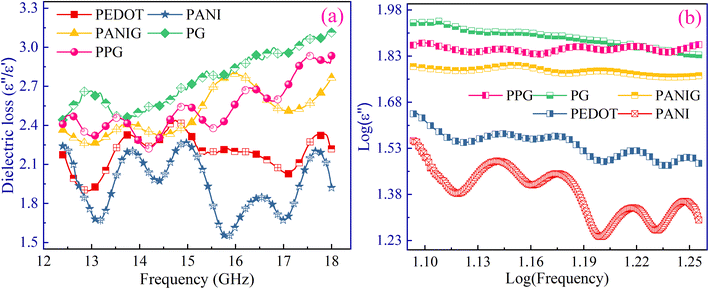 | ||
| Fig. 5 (a) Variation in dielectric loss with respect to frequency; (b) log(ε′′) versus log(frequency). | ||
The above discussion indicates that the polarization or dielectric relaxations are secondary contributors to the dielectric loss in the composites. The physical composition and chemical characteristics of a material, including its morphology or shape and chemical bonding, play crucial roles in achieving a superior polarization (P) performance according to the classical electromagnetic theory.
| P = (ε − ε0)E = NαE | (1) |
| ε = ε0 + Nα | (2) |
Insight into the dielectric properties can be gained by understanding the polarization, which encompasses dipole, electronic and ionic orientation polarization, together with relaxation phenomena in the presence of an EM field. Specifically, electronic polarization, arising from valence electrons, imparts unique electronic characteristics to RGO, potentially enhancing the electronic polarization.52 Furthermore, in the microwave frequency spectrum, the polar properties of PEDOT and PANI contribute to increased dielectric values through both dipole and ionic polarization mechanisms.13
The understanding of the dielectric properties of the samples could be understood by examining their relaxation phenomenon using the Debye theory of relaxation, which is frequently employed in the investigation of dielectric polarization in polymeric materials. The expression for complex permittivity can be formulated as follows:
 | (3) |
which gives,
 | (4) |
 | (5) |
 and
and  , respectively, using the following equations.
 | (6) |
 | (7) |
According to eqn (3)–(5), the correlation between ε′′ and ε′ can be recognized as:
 | (8) |
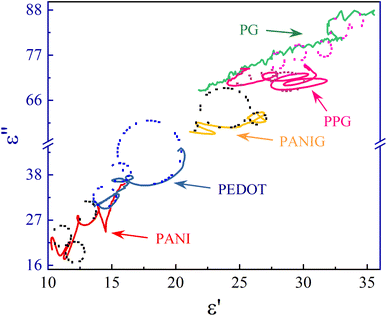
Using eqn (8), the correlation between ε′ and ε′′, which is commonly known as the Cole–Cole plot, is depicted in Fig. 6, characterizing the Debye relaxation. In the case of high-quality dielectric materials, the Cole–Cole plot typically shows a perfect semicircular shape. Alternatively, deviations from this semicircular pattern in the Cole–Cole plot suggest the existence of supplementary polarization mechanisms, which may include Maxwell–Wagner and electron polarization, in addition to dipole polarization.53 As shows in Fig. 6, the plots for all the samples in the Cole–Cole analysis show characteristic semicircular shapes with slight deviation. Each of these semicircles corresponds to a distinct Debye relaxation mechanism, and the presence of multiple semicircles is attributed to asymmetrical relaxation times (τ), suggesting the co-existence of multiple polarizations. These multiple polarizations may be responsible for the augmentation in the EM shielding ability of the materials.
Microwave absorption and EM shielding properties are influenced by two primary factors, i.e., internal attenuation and impedance disparity.54 However, the pristine conducting polymers and the composites exhibited weak impedance matching owing to their high dielectric characteristics or complex permittivity and non-magnetic/lower permeability properties. Thus, the dominant mechanism for EM wave loss through absorption primarily relies on internal attenuation.
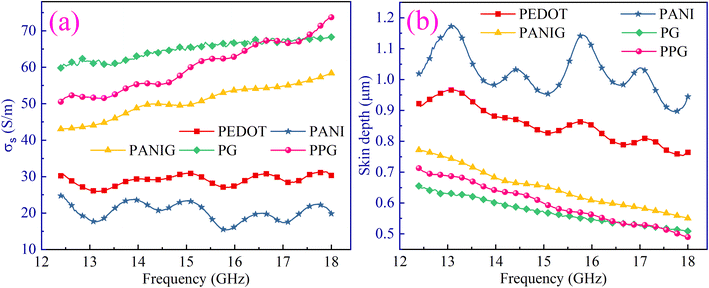
The skin depth (δ) and ac conductivity (σs) parameters were computed for the samples using eqn (10). Conducting polymers mainly possess two types of charge carrier species, i.e., polarons and bipolarons, which involve the localization of charge carriers in the polymer chains. The free charge carriers are responsible for space charge polarization, whereas the bound charge carriers/dipoles contribute orientational polarizations. The ac conductivity included the presence of both free and bound charges in these disordered polymeric materials.
| σs = εoωε′′ | (9) |
Significant changes in σs with the incorporation of graphene in the pristine polymers and PPG composite were observed, as depicted in Fig. 7(a). The addition of graphene to the polymer matrix leveraged its intrinsic properties by forming a conductive network in the material, resulting in a significant enhancement in electrical conductivity. The introduction of the PEDOT polymer in PANI improved the electrical conductivity of the PANIG sample. This can be attributed to the presence of sulfonate groups (SO3−) in PEDOT. These sulfonate moieties possess the potential to establish hydrogen bonds with polyaniline during the synthesis reaction.55,56 This increased the mobility of charge carriers, resulting in an increase in the conductivity of the PPG sample. The FTIR and morphological studies also indicated the presence of an interaction between the quinoid ring structures of PEDOT and PANI in the PPG composite.57 This phenomenon can also be attributed to the augmentation of dielectric loss stemming from the bound charges and the energy dissipation caused by free charges present in these semi-crystalline samples. The ac electrical conductivity has control over dielectric loss, while energy loss is contributed by the pure direct current conductivity of the material. Furthermore, the observed pattern of ε′′ (or dielectric loss) is in excellent agreement with the variation observed in the calculated σs.
Skin depth plays a crucial part in EM shielding given that it directly impacts the performance of a material to attenuate or block electromagnetic waves. Generally, materials with smaller skin depths and higher electrical conductivity are more effective for shielding against higher-frequency electromagnetic waves, whereas materials with larger skin depths may be more suitable for lower-frequency applications.58 This depth is inversely related to the electrical conductivity of the samples, and hence its value can be influenced by the presence of extrinsic impurities in the material. The skin depth (δ) can be defined by eqn (11), as follows:
 | (10) |
The variations in skin depth with the frequency of the samples is depicted in Fig. 7(b). A decrease in the skin depth of the composites with an increase in frequency was observed, owing to the increase in electrical conductivity with frequency. This decrease in skin depth implies a decreased penetration of EM waves across the material, i.e., a lower skin depth results in higher attenuation of EM waves. Thus, the skin depth becomes the crucial factor in defining the shielding effectiveness of materials. Accordingly, materials with a lower skin depth can be considered a good choice for resolving the issue of EM radiation pollution.
3.5. EM shielding effectiveness analysis
The EM shielding effectiveness (SE) of materials for EM waves mainly involves studying the energy dissipation of the EM waves. In detail, how materials interact with EM waves, the assessment of the energy transformation, energy dissipation of the waves, and the influence of variables such as the utilized frequency, operational temperature, and material composition.59 It has been reported that electromagnetic shielding properties are directly influenced by the electrical and magnetic properties, whereas the frequency of EM waves and system temperatures also influence the energy dissipation of the EM waves and energy conversion ability of various carbonaceous composites.60 Therefore, a systematic examination of the EM shielding performance of the polymer nanocomposites was conducted, considering the effect of frequency, electrical characteristics, and composition of the samples.Mathematically, the SE is commonly defined as the ratio of power of incident waves to the power of the transmitted waves. The total SE (SET) encompasses the shielding effectiveness resulting from reflection (SER), absorption (SEA), and multiple internal reflection (SEM) phenomena of EM waves, which can be expressed by the following equation:
SET(dB) = 10![[thin space (1/6-em)]](https://www.rsc.org/images/entities/char_2009.gif) log10 log10![[thin space (1/6-em)]](https://www.rsc.org/images/entities/char_2009.gif) Pi/Pt = SER + SEA + SEM Pi/Pt = SER + SEA + SEM
| (11) |
Shielding effectiveness is the capacity of a material to dissipate or lessen the penetration of EM waves, primarily by converting EM energy to heat energy, which is dependent on the bulk conductivity of the shield. When the conductivity of the EM shield is higher, the dielectric loss becomes significant, leading to an increase in shielding effectiveness through absorption. Alternatively, the impedance mismatching at the boundary between the air and shielding material is responsible for the SER phenomena. At this boundary, the unbound electric charge carriers engage with the incoming EM waves, resulting in their reflection, thus enhancing the SE via the process of reflection. The overall influence of all the responsible phenomena on the attenuation of EM waves can be simply understood through a schematic representation, as depicted in Scheme 2.
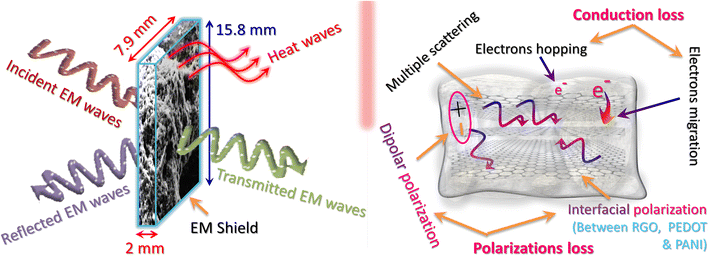 | ||
| Scheme 2 The possible mechanism of EM wave attenuation in the samples via reflection, absorption, and multiple internal reflections, and other responsible losses for the attenuation of EM waves. | ||
The SE resulting from absorption (SEA), reflection (SER), and total shielding effectiveness (SET) phenomena is depicted in Fig. 8(a–c), respectively. As depicted, the shielding effectiveness is influenced by both the composition of the material and frequency. It was observed that the SE via absorption increased with the incorporation of graphene in the polymer matrix and PEDOT in PANIG composite, as shown in Fig. 3(a). In comparison, the pure PANI sample reveals the lowest absorption of approximately 20.9 dB, and the values of SEA for the PEDOT, PANIG, PG, and PPG composites reached 26.33, 27.56, 39.19, and 36.17 dB, respectively, at 18 GHz frequency. This enhancement in shielding effectiveness with a change in the composition of the samples can be attributed to several factors, including their substantial surface-to-volume ratio, enhanced electrical conductivity, skin depth effect phenomena, and numerous internal reflections occurring from the graphene sheets.
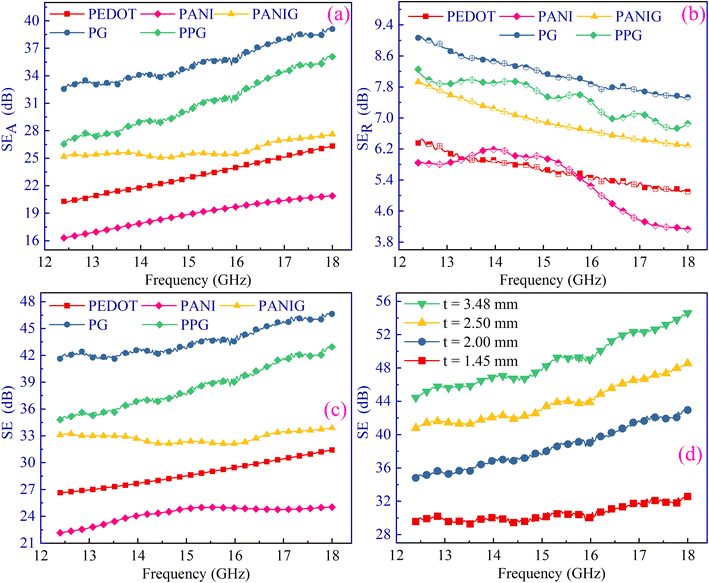 | ||
| Fig. 8 Plots of (a) SEA, (b) SER, and (c) SET as a function of frequency for all the samples. (d) Plot of SET versus thickness (t) for PPG sample. | ||
According to eqn (S7),† the SE due to absorption is mainly influenced by several key parameters, including electrical conductivity (σs), skin depth (δ), permittivity (ε), permeability (μ), and barrier thickness (t) of the shield. When EM waves passed through the graphene-encapsulated composite samples, higher scatter occurred, which enhanced the shielding effectiveness. The PG composite sample exhibited the highest shielding effectiveness due to absorption (e.g., SEA = 39.19 dB) among the samples, which surpasses the total SE required for commercial purposes (∼30 dB). In the Ku frequency band, the SEA of all the samples constantly increased with an increase in frequency. This shielding effectiveness behavior is influenced by various types of dielectric polarizations and increases with an increase in conductivity with frequency. The presence of graphene in the composites resulted in the formation of an electrical network, which facilitated the higher EM shielding performance by dissipating the EM wave energy into conduction losses.61 Moreover, these absorption losses occurred due to the large accumulation of valence electrons across the two-dimensional structure of RGO facilitated by intertwining of the PANI/PEDOT polymer chains and RGO sheets, i.e., formation of core–shell structure. This intertwining among the materials led to electronic polarization, which may be due to the tunneling of charges between the conducting polymer and RGO.
The SE due to reflection (SER) phenomena of the composites is shown in Fig. 8(b). The SER is attributed to the impedance mismatch at the boundary of air-material. According to eqn (S8),† it is directly proportional to the ratio ofσs/μr. It was found that SER steadily decreased with the frequency in the Ku-frequency band for all the samples. Among the samples, PANIG exhibited the lowest SER value at approximately 4.1 dB, while the PG sample possessed the highest SER value at around 7.5 dB, specifically at a frequency of 18 GHz. The influence of both absorption and reflection on the shielding effectiveness was apparent when examining eqn (S7) and (S8),† with both factors showing an increase in strength with an increase in conductivity. This phenomenon was also observed in the shielding results.
The variation in SET with frequency for the composites is depicted in Fig. 8(c). The results indicate that the SET values for all the samples surpass 15 dB, which fulfills the minimum SE criteria necessary to neglect the presence of multiple internal reflections in the material. The SET of the samples revealed an increasing trend with an increase in frequency and conductivity/incorporation of fillers. At 18 GHz, the SET values for the PANI, PEDOT, PANIG, PG, and PPG samples were 25.08, 31.36, 33.95, 46.62, and 42.93 dB, respectively. Both the SEA (Fig. 8(a)) and SET (Fig. 8(c)) exhibited a similar variation versus frequency. Thus, was been established that absorption plays the predominant role in the overall SE.
Furthermore, to investigate how the thickness affects the ability of the materials to provide shielding, additional measurements were performed with different thicknesses of the PPG samples to assess their shielding performance, as depicted in Fig. 8(d). The thickness of the samples varied from 1.45 mm to 3.48 mm. The SE revealed consistent behavior with the sample thickness, corresponding to eqn (S7).† In the case of the PPG sample, the total SE increased from 32.61 dB to 54.60 dB, while the thickness of the shield changed from 1.45 mm to 3.48 mm. The results are analogous to the relation between the thickness and intensity (as I = I0e−αt) of the waves, which implies the exponential decrease in the intensity of incoming EM waves in the shield.
According to eqn (S7) and (S8),† it is evident that a direct relationship exists between SEA and SER with electrical conductivity. Consequently, SEA and SER were plotted with the conductivity, as shown in Fig. 9(a), revealing the direct correlation between the two. The SEA showed a remarkable increase with an increase in conductivity, whereas the SER decreased with an increase in conductivity. Given that SER depends on the ratio ofσs/ω, in which frequency acts as the more significant term. Given that the shielding phenomenon was driven by the absorption mechanism rather than the reflection mechanism, the total shielding increased with an increase in conductivity. To explore the effect of skin depth, the SET was plotted against ‘δ’, as depicted in Fig. 9(b), confirming that the total shielding effectiveness decreased with an increase in the skin depth.
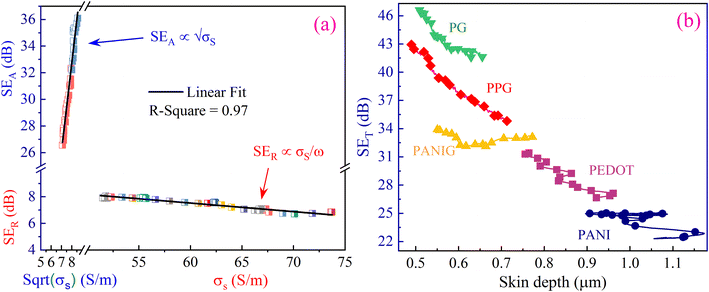 | ||
| Fig. 9 Variation in SEA as a function of (a) conductivity of PPG sample and (b) skin depth for all the samples. | ||
The signal exclusion threshold of all the composite samples exceeded 30 dB, surpassing the industrial requirement for their commercial use. Thus, the samples are useful for commercial shielding applications. Considering this, the shielding properties of the samples are discussed in detail as a function of frequency and other parameters. To further elaborate the discussion and correlate the shielding effectiveness and other parameters with the composition of samples, Fig. 10 was plotted. It validates the noteworthy dependence of the shielding effectiveness on the dielectric loss and conductivity on the composition of the samples. It was found that a change in the composition of the sample led to a change in dielectric loss and electrical conductivity, which led to proportional deviations in the total shielding effectiveness.
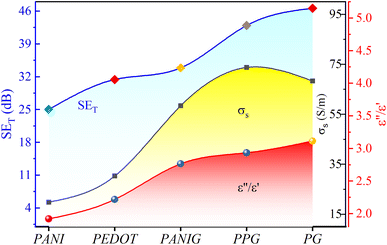 | ||
| Fig. 10 Variation in shielding effectiveness, electrical conductivity, and dielectric loss with the composition of the samples. | ||
EM shielding can be achieved through reflection or absorption of EM radiation. However, reflection poses a problem because the shield can act as a secondary source of EM radiation, potentially causing interference. This can be harmful to electronic devices and living organisms. Therefore, shielding through absorption is preferred. Thus, to assess the eco-friendliness of the prepared samples, the “green index” (gs) (=1/|S112| − |S212|/|S112| − 1, where S11 and S12 are scattering parameters) was examined, as suggested by Cao et al., which assesses the eco-friendliness of shielding materials.61 A higher value of gs (>1) indicates strong absorption, whereas a lower reflection contributes to effective EM shielding. The composite samples containing graphene had a gs of greater than 1 and their SE surpassed 30 dB, which signifies the higher-performance and environment-friendly EM shielding nature of the prepared materials.
Furthermore, to measure the validity compared to the reported work, the shielding performance of the present study was compared with other published reports.44,62–71 This comparative analysis is shown in Fig. 11 and additional data can be found in Table S2 in the ESI.† The achieved SE results of the conducting polymer composite samples can be attributed to several key factors. Firstly, the synergistic interaction among the two-dimensional sheets of RGO and the polymer matrix plays a vital role. Also, the interactions between the sulfonate groups (SO3−) of PEDOT and PANI in the PPG composite contributed to the improved shielding results via an enhanced polarization effect. Further, the incorporation of graphene and copolymerization generated more localized states in the composite. This improved the conductivity of the specimens and led to a long-range hopping conduction mechanism, resulting in the generation of dielectric and ohmic losses. This also increased the mobility of charge species in the samples. The higher conductivity of the composite materials is another crucial factor in their improved shielding performance. Moreover, the heterogeneity of the composites and different electric natures of the materials may lead to space charge polarization and dipolar polarization, and consequently higher dielectric loss and shielding results.
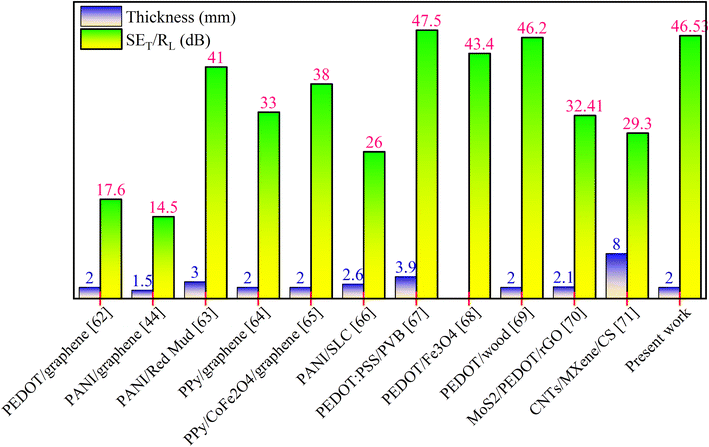 | ||
| Fig. 11 A comparison of the electromagnetic shielding outcomes with that of similar composites published in the literature.44,62–71 | ||
4. Conclusion
A conducting polymer and its composites with graphene were prepared via an in situ chemical oxidative polymerization approach for the attenuation of electromagnetic waves. The changes in the intensity of the IR bands and presence/shifting of these bands revealed the occurrence of various interactions in the composites and variations in the ‘σs’ with the incorporation of fillers. The presence of two-dimensional graphene in the composites was revealed by SEM micrographs of the composite specimens. The pure and polymer@graphene composite samples exhibited an outstanding shielding effectiveness in the Ku-band of frequency. At 18 GHz, the SET of the PG composite was measured to be 46.62 dB with a 2 mm thick sample, which was significantly higher than the SE value needed for industrial applications. At higher frequencies, the composite specimen effectively addressed the issue of EM pollution by blocking more than 99% of incident EM waves. The SE results of the composites were attributed to the improved synergistic dielectric losses and higher conductivity of the specimens. The analysis utilizing the Cole–Cole plot validated the existence of Maxwell–Wagner and dielectric polarization, in addition to electronic polarizations, in the specimens. Furthermore, the overall SE increased with an increase in ‘σs’ and a reduction in skin depth. A detailed investigation of the EM shielding characteristics of the samples was performed in relation to various parameters and the results revealed that they are excellent shielding materials suitable for commercial applications in the electronic, telecom, and defense industries.Author contributions
Suman Kumari: conceptualization, data curation, writing – original draft. Jasvir Dalal: data curation, validation, investigation, writing – review and editing. Rishi Pal: data curation. Anand Kumar: resources, writing – review and editing, supervision. Ritu Chahal: data curation. Anil Ohlan: validation, resources, writing – review and editing.Conflicts of interest
There are no conflicts to declare.Acknowledgements
The authors are thankful to the Microwave Circuit Laboratory, Department of Electrical Engineering, IIT Kanpur for Dielectric and EM shielding measurements.References
- H. Abbasi, M. Antunes and J. I. Velasco, Recent advances in carbon-based polymer nanocomposites for electromagnetic interference shielding, Prog. Mater. Sci., 2019, 103, 319–373 CrossRef CAS.
- P. Song, C. Liang, L. Wang, H. Qiu, H. Gu, J. Kong and J. Gu, Obviously improved electromagnetic interference shielding performances for epoxy composites via constructing honeycomb structural reduced graphene oxide, Compos. Sci. Technol., 2019, 181, 107698 CrossRef CAS.
- L. Vazhayal, P. Wilson and K. Prabhakaran, Waste to wealth: Lightweight, mechanically strong and conductive carbon aerogels from waste tissue paper for electromagnetic shielding and CO2 adsorption, Chem. Eng. J., 2020, 381, 122628 CrossRef CAS.
- T. Yun, H. Kim, A. Iqbal, Y. S. Cho, G. S. Lee, M.-K. Kim, S. J. Kim, D. Kim, Y. Gogotsi and S. O. Kim, others, Electromagnetic shielding of monolayer MXene assemblies, Adv. Mater., 2020, 32, 1906769 CrossRef CAS PubMed.
- D.-K. Li, H. Chen, J. R. Ferber, R. Odouli and C. Quesenberry, Exposure to Magnetic Field Non-Ionizing Radiation and the Risk of Miscarriage: A Prospective Cohort Study, Sci. Rep., 2017, 7, 17541 CrossRef PubMed.
- O. Erogul, E. Oztas, I. Yildirim, T. Kir, E. Aydur, G. Komesli, H. C. Irkilata, M. K. Irmak and A. F. Peker, Effects of Electromagnetic Radiation from a Cellular Phone on Human Sperm Motility: An In Vitro Study, Arch. Med. Res., 2006, 37, 840–843 CrossRef PubMed.
- F. Shahzad, M. Alhabeb, C. B. Hatter, B. Anasori, S. M. Hong, C. M. Koo and Y. Gogotsi, Electromagnetic interference shielding with 2D transition metal carbides (MXenes), Science, 2016, 353, 1137–1140 CrossRef CAS PubMed.
- Z. Wang, Z. Cheng, C. Fang, X. Hou and L. Xie, Recent advances in MXenes composites for electromagnetic interference shielding and microwave absorption, Composites, Part A, 2020, 136, 105956 CrossRef CAS.
- Z. Ma, S. Kang, J. Ma, L. Shao, Y. Zhang, C. Liu, A. Wei, X. Xiang, L. Wei and J. Gu, Ultraflexible and Mechanically Strong Double-Layered Aramid Nanofiber–Ti3C2Tx MXene/Silver Nanowire Nanocomposite Papers for High-Performance Electromagnetic Interference Shielding, ACS Nano, 2020, 14, 8368–8382 CrossRef CAS PubMed.
- F. M. Oliveira and R. Gusmão, Recent Advances in the Electromagnetic Interference Shielding of 2D Materials beyond Graphene, ACS Appl. Electron. Mater., 2020, 2, 3048–3071 CrossRef CAS.
- S. Kumari, J. Dalal, V. Kumar, A. Kumar and A. Ohlan, Emerging Two-Dimensional Materials for Electromagnetic Interference Shielding Application, Int. J. Mol. Sci., 2023, 24, 12267 CrossRef CAS PubMed.
- S. Kumari, J. Dalal, A. Kumar and A. Ohlan, Microwave Absorption Performance of Core–Shell rGO/Ni0.5Co0.5Fe2O4@PEDOT Composite: An Effective Approach to Reduce Electromagnetic Wave Pollution, Adv. Eng. Mater., 2022, 2200635 CrossRef CAS.
- J. Dalal, S. Lather, A. Gupta, S. Dahiya, A. S. Maan, K. Singh, S. K. Dhawan and A. Ohlan, EMI shielding properties of laminated graphene and PbTiO3 reinforced poly (3, 4-ethylenedioxythiophene) nanocomposites, Compos. Sci. Technol., 2018, 165, 222–230 CrossRef CAS.
- S. Liu, V. S. Chevali, Z. Xu, D. Hui and H. Wang, A review of extending performance of epoxy resins using carbon nanomaterials, Composites, Part B, 2018, 136, 197–214 CrossRef CAS.
- M. F. Jasvir Dalal, A. Ohlan and S. K. Dhawan, Synthesis of Poly (3, 4-ethylene dioxythiophene) Conducting Polymer Composites for EMI Shielding Applications, in Smart Mater. Des. Electromagn. Interf. Shield. Appl., Bentham Science, 2022, pp. 213–270 Search PubMed.
- P. Song, X. Liao, F. Zou, X. Wang, F. Liu, S. Liu and G. Li, Frequency-adjustable electromagnetic interference shielding performance of sandwich-structured conductive polymer composites by selective foaming and tunable filler dispersion, Compos. Commun., 2022, 34, 101264 CrossRef.
- J. Hong, J. Kwon, D. Im, J. Ko, C. Y. Nam, H. G. Yang, S. H. Shin, S. M. Hong, S. S. Hwang, H. G. Yoon and A. S. Lee, Best practices for correlating electrical conductivity with broadband EMI shielding in binary filler-based conducting polymer composites, Chem. Eng. J., 2023, 455, 140528 CrossRef CAS.
- J. Liu, L. Mckeon, J. Garcia, S. Pinilla, S. Barwich, M. Möbius, P. Stamenov, J. N. Coleman and V. Nicolosi, Additive Manufacturing of Ti3C2-MXene-Functionalized Conductive Polymer Hydrogels for Electromagnetic-Interference Shielding, Adv. Mater., 2022, 34, 2106253 CrossRef CAS PubMed.
- J. Chen, Y. Shi, K. Pan, J. Du and J. Qiu, Plasma Oscillation Behavior and Electromagnetic Interference Shielding of Carbon Nanofibers/Conductive Polymer Metacomposites at Radarwave Frequency, Macromol. Rapid Commun., 2022, 43, 2100826 CrossRef CAS PubMed.
- V. S. Siavashani, N. C. Gursoy, M. Montazer and P. Altay, Stretchable Electromagnetic Interference Shielding Textile Using Conductive Polymers and Metal Nanoparticles, Fibers Polym., 2022, 23, 2748–2759 CrossRef CAS.
- A. A. Khodiri, M. Y. Al-Ashry and A. G. El-Shamy, Novel hybrid nanocomposites based on polyvinyl alcohol/graphene/magnetite nanoparticles for high electromagnetic shielding performance, J. Alloys Compd., 2020, 847, 156430 CrossRef CAS.
- X. Lei, X. Zhang, A. Song, S. Gong, Y. Wang, L. Luo, T. Li, Z. Zhu and Z. Li, Investigation of electrical conductivity and electromagnetic interference shielding performance of Au@CNT/sodium alginate/polydimethylsiloxane flexible composite, Composites, Part A, 2020, 130, 105762 CrossRef CAS.
- H. Zhang, Z. Heng, J. Zhou, Y. Shi, Y. Chen, H. Zou and M. Liang, In-situ co-continuous conductive network induced by carbon nanotubes in epoxy composites with enhanced electromagnetic interference shielding performance, Chem. Eng. J., 2020, 398, 125559 CrossRef CAS.
- H. Lecocq, N. Garois, O. Lhost, P.-F. Girard, P. Cassagnau and A. Serghei, Polypropylene/carbon nanotubes composite materials with enhanced electromagnetic interference shielding performance: Properties and modeling, Composites, Part B, 2020, 189, 107866 CrossRef CAS.
- M. Zhang, P. Zhang, C. Zhang, Y. Wang, H. Chang and W. Rao, Porous and anisotropic liquid metal composites with tunable reflection ratio for low-temperature electromagnetic interference shielding, Appl. Mater. Today, 2020, 19, 100612 CrossRef.
- S. H. Lee, S. Yu, F. Shahzad, J. Hong, S. J. Noh, W. N. Kim, S. M. Hong and C. M. Koo, Low percolation 3D Cu and Ag shell network composites for EMI shielding and thermal conduction, Compos. Sci. Technol., 2019, 182, 107778 CrossRef CAS.
- B. O. Lee, W. J. Woo, H. S. Park, H. S. Hahm, J. P. Wu and M. S. Kim, Influence of aspect ratio and skin effect on EMI shielding of coating materials fabricated with carbon nanofiber/PVDF, J. Mater. Sci., 2002, 37, 1839–1843 CrossRef CAS.
- T. Kuang, L. Chang, F. Chen, Y. Sheng, D. Fu and X. Peng, Facile preparation of lightweight high-strength biodegradable polymer/multi-walled carbon nanotubes nanocomposite foams for electromagnetic interference shielding, Carbon, 2016, 105, 305–313 CrossRef CAS.
- J. Dalal, S. Malik, S. Dahiya, R. Punia, K. Singh, A. S. Maan, S. K. Dhawan and A. Ohlan, One pot synthesis and electromagnetic interference shielding behavior of reduced graphene oxide nanocomposites decorated with Ni0.5Co0.5Fe2O4 nanoparticles, J. Alloys Compd., 2021, 887, 161472 CrossRef CAS.
- J. Dalal, A. Gupta, S. Lather, K. Singh, S. K. Dhawan and A. Ohlan, Poly (3, 4-ethylene dioxythiophene) laminated reduced graphene oxide composites for effective electromagnetic interference shielding, J. Alloys Compd., 2016, 682, 52–60 CrossRef CAS.
- M. Wang, X. H. Tang, J. H. Cai, H. Wu, J. Bin Shen and S. Y. Guo, Construction, mechanism and prospective of conductive polymer composites with multiple interfaces for electromagnetic interference shielding: A review, Carbon, 2021, 177, 377–402 CrossRef CAS.
- H. Xu, X. Yin, X. Li, M. Li, S. Liang, L. Zhang and L. Cheng, Lightweight Ti2CTx MXene/Poly(vinyl alcohol) Composite Foams for Electromagnetic Wave Shielding with Absorption-Dominated Feature, ACS Appl. Mater. Interfaces, 2019, 11, 10198–10207 CrossRef CAS PubMed.
- J. Dalal, S. Lather, A. Gupta, R. Tripathi and A. S. Maan, Reduced Graphene Oxide Functionalized Strontium Ferrite in Poly(3 , 4-ethylenedioxythiophene) Conducting Network : A High-Performance EMI Shielding Material, Adv. Mater. Technol., 2019, 1900023 CrossRef CAS.
- W. Gao, N. Zhao, T. Yu, J. Xi, A. Mao, M. Yuan, H. Bai and C. Gao, High-efficiency electromagnetic interference shielding realized in nacre-mimetic graphene/polymer composite with extremely low graphene loading, Carbon, 2020, 157, 570–577 CrossRef CAS.
- Y. Zhang, Z. Yang, T. Pan, H. Gao, H. Guan, J. Xu and Z. Zhang, Construction of natural fiber/polyaniline core-shell heterostructures with tunable and excellent electromagnetic shielding capability via a facile secondary doping strategy, Composites, Part A, 2020, 137, 105994 CrossRef CAS.
- R. Rohini and S. Bose, Electrodeposited carbon fiber and epoxy based sandwich architectures suppress electromagnetic radiation by absorption, Composites, Part B, 2019, 161, 578–585 CrossRef CAS.
- H. J. Im, J. Y. Oh, S. Ryu and S. H. Hong, The design and fabrication of a multilayered graded GNP/Ni/PMMA nanocomposite for enhanced EMI shielding behavior, RSC Adv., 2019, 9, 11289–11295 RSC.
- T. Sun, W. Luo, Y. Luo, Y. Wang, S. Zhou, M. Liang, Y. Chen and H. Zou, Self-Reinforced Polypropylene/Graphene Composite with Segregated Structures To Achieve Balanced Electrical and Mechanical Properties, Ind. Eng. Chem. Res., 2020, 59, 11206–11218 CrossRef CAS.
- V. T. Nguyen, B. K. Min, Y. Yi, S. J. Kim and C. G. Choi, MXene(Ti3C2TX)/graphene/PDMS composites for multifunctional broadband electromagnetic interference shielding skins, Chem. Eng. J., 2020, 393, 124608 CrossRef CAS.
- A. Iqbal, P. Sambyal and C. M. Koo, 2D MXenes for Electromagnetic Shielding: A Review, Adv. Funct. Mater., 2020, 30, 1–25 Search PubMed.
- B. Wen, X. X. Wang, W. Q. Cao, H. L. Shi, M. M. Lu, G. Wang, H. B. Jin, W. Z. Wang, J. Yuan and M. S. Cao, Reduced graphene oxides: The thinnest and most lightweight materials with highly efficient microwave attenuation performances of the carbon world, Nanoscale, 2014, 6, 5754–5761 RSC.
- Y. Wang, S. Wu, Q. Yin, B. Jiang and S. Mo, Tuning thermoelectric performance of Poly(3,4-ethylenedioxythiophene): Poly (styrene sulfonate)/Polyaniline composite films by nanostructure evolution of polyaniline, Polym. Test., 2021, 94, 107017 CrossRef CAS.
- J. Dalal, A. Gupta, S. Lather, K. Singh, S. K. Dhawan and A. Ohlan, Poly (3, 4-ethylene dioxythiophene) laminated reduced graphene oxide composites for effective electromagnetic interference shielding, J. Alloys Compd., 2016, 682, 52–60 CrossRef CAS.
- S. Khasim, Polyaniline-Graphene nanoplatelet composite films with improved conductivity for high performance X-band microwave shielding applications, Results Phys., 2019, 12, 1073–1081 CrossRef.
- F. Sultanov, C. Daulbayev, B. Bakbolat and O. Daulbayev, Advances of 3D graphene and its composites in the field of microwave absorption, Adv. Colloid Interface Sci., 2020, 285, 102281 CrossRef CAS PubMed.
- D. Zhi, T. Li, J. Li, H. Ren and F. Meng, A review of three-dimensional graphene-based aerogels: Synthesis, structure and application for microwave absorption, Composites, Part B, 2021, 211, 108642 CrossRef CAS.
- E. G. Langford, K. D. Shaughnessy, T. C. Devore, D. Lawrence and C. Constantin, Analysis of PEDOT:PSS Films After Sulfuric Acid Treatment on Silicon and Fused Silica using FT-IR and UV-VIS, MRS Adv., 2016, 1, 465–469 CrossRef CAS.
- R. Pal, S. Lata Goyal and I. Rawal, Asha, Lightweight graphene encapsulated with polyaniline for excellent electromagnetic shielding performance in X-band (8.2–12.4 GHz), Mater. Sci. Eng. B: Solid-State Mater. Adv. Technol., 2021, 270, 115227 CrossRef CAS.
- F. Shahzad, S. Yu, P. Kumar, J.-W. Lee, Y.-H. Kim, S. M. Hong and C. M. Koo, Sulfur doped graphene/polystyrene nanocomposites for electromagnetic interference shielding, Compos. Struct., 2015, 133, 1267–1275 CrossRef.
- G. Datt, C. Kotabage and A. C. Abhyankar, Ferromagnetic resonance of NiCoFe2O4 nanoparticles and microwave absorption properties of flexible NiCoFe2O4–carbon black/poly(vinyl alcohol) composites, Phys. Chem. Chem. Phys., 2017, 19, 20699–20712 RSC.
- Y. Feng, W. L. Li, Y. F. Hou, Y. Yu, W. P. Cao, T. D. Zhang and W. D. Fei, Enhanced dielectric properties of PVDF-HFP/BaTiO3-nanowire composites induced by interfacial polarization and wire-shape, J. Mater. Chem. C, 2015, 3, 1250–1260 RSC.
- M. Zong, Y. Huang, Y. Zhao, X. Sun, C. Qu, D. Luo and J. Zheng, Facile preparation, high microwave absorption and microwave absorbing mechanism of RGO–Fe3O4 composites, RSC Adv., 2013, 3, 23638 RSC.
- J. Liu, W.-Q. Cao, H.-B. Jin, J. Yuan, D.-Q. Zhang and M.-S. Cao, Enhanced permittivity and multi-region microwave absorption of nanoneedle-like ZnO in the X-band at elevated temperature, J. Mater. Chem. C, 2015, 3, 4670–4677 RSC.
- J. Zhang, J. Li, G. Tan, R. Hu, J. Wang, C. Chang and X. Wang, Thin and flexible Fe--Si--B/Ni--Cu--P metallic glass multilayer composites for efficient electromagnetic interference shielding, ACS Appl. Mater. Interfaces, 2017, 9, 42192–42199 CrossRef CAS PubMed.
- C. Basavaraja, N. R. Kim, E. A. Jo and D. S. Huh, Biological templating of polyaniline and polypyrrole using E. coli, Macromol. Res., 2010, 18, 222–226 CrossRef CAS.
- T. Y. Kim, C. M. Park, J. E. Kim and K. S. Suh, Electronic, chemical and structural change induced by organic solvents in tosylate-doped poly (3, 4-ethylenedioxythiophene)(PEDOT-OTs), Synth. Met., 2005, 149, 169–174 CrossRef CAS.
- N. M. Barkoula, B. Alcock, N. O. Cabrera and T. Peijs, Flame-Retardancy Properties of Intumescent Ammonium Poly(Phosphate) and Mineral Filler Magnesium Hydroxide in Combination with Graphene, Polym. Polym. Compos., 2008, 16, 101–113 CrossRef CAS.
- J. P. Pouget, C.-H. Hsu, A. G. Mac Diarmid and A. J. Epstein, Structural investigation of metallic PAN-CSA and some of its derivatives, Synth. Met., 1995, 69, 119–120 CrossRef CAS.
- M.-S. Cao, X.-X. Wang, M. Zhang, J.-C. Shu, W.-Q. Cao, H.-J. Yang, X.-Y. Fang and J. Yuan, Electromagnetic response and energy conversion for functions and devices in low-dimensional materials, Adv. Funct. Mater., 2019, 29, 1807398 CrossRef.
- B. Wen, M. Cao, M. Lu, W. Cao, H. Shi, J. Liu, X. Wang, H. Jin, X. Fang and W. Wang, others, Reduced graphene oxides: light-weight and high-efficiency electromagnetic interference shielding at elevated temperatures, Adv. Mater., 2014, 26, 3484–3489 CrossRef CAS PubMed.
- X. Wang, J. Shu, W. Cao, M. Zhang, J. Yuan and M. Cao, Eco-mimetic nanoarchitecture for green EMI shielding, Chem. Eng. J., 2019, 369, 1068–1077 CrossRef CAS.
- M. Taj, S. R. Manohara, B. Siddlingeshwar, N. Raghavendra, M. Faisal and U. V. Khadke, Anticorrosion and electromagnetic interference shielding performance of bifunctional PEDOT-graphene nanocomposites, Diamond Relat. Mater., 2023, 132, 109690 CrossRef CAS.
- A. Pande, P. Gairola, P. Sambyal, S. P. Gairola, V. Kumar, K. Singh and S. K. Dhawan, Electromagnetic shielding behavior of polyaniline using Red Mud (industrial waste) as filler in the X – band (8.2–12.4 GHz) frequency range, Mater. Chem. Phys., 2017, 189, 22–27 CrossRef CAS.
- N. Gill, V. Gupta, M. Tomar, A. L. Sharma, O. P. Pandey and D. P. Singh, Improved electromagnetic shielding behaviour of graphene encapsulated polypyrrole-graphene nanocomposite in X-band, Compos. Sci. Technol., 2020, 192, 108113 CrossRef CAS.
- N. Gill, A. L. Sharma, V. Gupta, M. Tomar, O. P. Pandey and D. P. Singh, Enhanced microwave absorption and suppressed reflection of polypyrrole-cobalt ferrite-graphene nanocomposite in X-band, J. Alloys Compd., 2019, 797, 1190–1197 CrossRef CAS.
- T. Pan, Y. Zhang, C. Wang, H. Gao, B. Wen and B. Yao, Mulberry-like polyaniline-based flexible composite fabrics with effective electromagnetic shielding capability, Compos. Sci. Technol., 2020, 188, 107991 CrossRef CAS.
- M. P. Kumar, S. Raga, S. Chetana and D. Rangappa, Realization of Anomalous Microwave Absorption Characteristics of PVB-PEDOT:PSS With Electromagnetic Data-Driven Discovery, IEEE Trans. Dielectr. Electr. Insul., 2022, 29, 178–184 CAS.
- M. Qiao, Y. Tian, J. Wang, X. Li, X. He, X. Lei, Q. Zhang, M. Ma and X. Meng, Magnetic-Field-Induced Vapor-Phase Polymerization to Achieve PEDOT-Decorated Porous Fe3O4 Particles as Excellent Microwave Absorbers, Ind. Eng. Chem. Res., 2022, 61, 13072–13082 CrossRef CAS.
- C. Chen, W. Feng, W. Wu, Y. Yu, G. Qian, L. Fu and D. Min, A highly strong PEDOT modified wood towards efficient electromagnetic interference shielding, Ind. Crops Prod., 2023, 202, 117109 CrossRef CAS.
- S. Zhang, Y. Pei, Z. Zhao, C. Guan and G. Wu, Simultaneous manipulation of polarization relaxation and conductivity toward self-repairing reduced graphene oxide based ternary hybrids for efficient electromagnetic wave absorption, J. Colloid Interface Sci., 2023, 630, 453–464 CrossRef CAS PubMed.
- Z. Wang, X. Han, Z. Zhou, W. Meng, X. Han, S. Wang and J. Pu, Lightweight and elastic wood-derived composites for pressure sensing and electromagnetic interference shielding, Compos. Sci. Technol., 2021, 213, 108931 CrossRef CAS.
Footnote |
| † Electronic supplementary information (ESI) available. See DOI: https://doi.org/10.1039/d3ra07245b |
| This journal is © The Royal Society of Chemistry 2024 |

