 Open Access Article
Characteristics and catalytic behavior of Ru–Sn bimetallic catalysts for TMCB hydrogenation to CBDO
Hao Zhen a,
Xin Zhoua,
Jinsheng Yangb,
Yanqing Liub,
Haibo Jin*ac,
Suohe Yangac,
Guangxiang Heac and
Lei Maac
aCollege of New Material and Chemical Engineering, Beijing Institute of Petrochemical Technology, Beijing 102617, China. E-mail: jinhaibo@bipt.edu.cn
bZhenghe Group Co., Ltd, Dongying 257342, Shandong, China. E-mail: chine_2005@163.com
cBeijing Key Laboratory of Fuels Cleaning and Advanced Catalytic Emission Reduction Technology, Beijing 102627, China
First published on 17th January 2024
Abstract
A series of Ru–Sn/γ-Al2O3 catalysts were prepared by the immersion method for tetramethylcyclobutane-1,3-dione (TMCB) hydrogenation to prepare 2,2,4,4-tetramethyl-1,3-cyclobutanediol (CBDO). The effect of the preparation method and reaction technology on TMCB hydrogenation activity was discussed. The catalysts were analyzed by means of XRD, BET, H2-TPR, XPS, scanning electron microscopy (SEM), and transmission electron microscopy (TEM), and it was found that the synthesized Ru was distributed on the surface of the carrier in the form of nanoparticles, showing a good catalytic effect. The results showed that when Ru loading was fixed at 5%, Sn was used as an auxiliary agent, and Ru/Sn = 1![[thin space (1/6-em)]](https://www.rsc.org/images/entities/char_2009.gif) :
:![[thin space (1/6-em)]](https://www.rsc.org/images/entities/char_2009.gif) 1 as the catalyst, the reaction conditions were 120 °C, 4 MPa, and 1 h, and the catalytic hydrogenation effect of TMCB on CBDO was the best. The selectivity was as high as 73.5%, and the cis–trans ratio was 1.11. It may be the strong interaction between Ru and Sn under this ratio condition, which leads to the largest number of nano-active centers of elemental Ru. Finally, the reaction mechanism of TMCB hydrogenation to CBDO is discussed.
1 as the catalyst, the reaction conditions were 120 °C, 4 MPa, and 1 h, and the catalytic hydrogenation effect of TMCB on CBDO was the best. The selectivity was as high as 73.5%, and the cis–trans ratio was 1.11. It may be the strong interaction between Ru and Sn under this ratio condition, which leads to the largest number of nano-active centers of elemental Ru. Finally, the reaction mechanism of TMCB hydrogenation to CBDO is discussed.
1. Introduction
2,2,4,4-Tetramethyl-1,3-cyclobutanediol (CBDO) is a polymer material monomer mainly used in the synthesis of high-performance polyesters that can replace polycarbonate (PC),1,2 which can promote the widespread development of healthy and environmentally friendly polyesters with similar thermal and mechanical properties.3 The addition of CBDO can significantly improve the glass transition temperature,4,5 chemical resistance, hydrolysis stability, as well as material transparency and ductility of polyesters.6 The polyester synthesized using CBDO has excellent physical properties similar to bisphenol A polyester, such as high impact strength, excellent dimensional stability, and a high glass transition temperature. And the polyester synthesized with CBDO has no carcinogens or other toxic substances, and its safety is much higher than other polyesters. Therefore, the synthesis and development of CBDO monomer raw materials are very important to enhance the competitiveness of polyester products.Nowadays, the more mature synthesis route of CBDO is from isobutyric acid or isobutyric anhydride by thermal cracking to generate dimethyl vinyl ketone, then dimethyl vinyl ketone dimerization to generate TMCB, and finally catalytic hydrogenation of TMCB to generate the product CBDO. The synthetic route for the preparation of CBDO by catalytic hydrogenation with TMCB is the most efficient method to obtain high-purity CBDO, as shown in Fig. 1. The structure of CBDO is divided into two cis–trans structures, the C4 ring of cis-CBDO is non-planar, and the crystal has a dihedral angle of 17.5°, while the trans-CBDO has a dihedral angle of 0°.7 The cis–trans isomer ratio of CBDO has an important impact on the glass transition temperature, impact strength, crystallization rate, and other properties of polyester. Polyesters with different properties can be prepared by adjusting the cis–trans isomer ratio of CBDO.8 According to references,9 copolyesters were synthesized using CBDO and 1,4-cyclohexanedimethanol as raw materials. When the logarithmic viscosity of specific concentration remains constant, the glass transition temperature increased almost linearly with the increase in the amount of CBDO. The improvement effect of cis-CBDO on the glass transition temperature of copolyesters was about twice that of trans-CBDO. Therefore, the development trend of TMCB hydrogenation catalysts is to increase the proportion of cis–trans isomers. Using Cu and Zn as active components, Lou et al.10 used Cu and Zn as active components to prepare the Cu-based catalyst CuO–ZnO/Al2O3 for TMCB hydrogenation by the co-precipitation method. It was found that a good TMCB conversion rate (>98%) could be achieved only when the reaction temperature reached 180 °C. Huang11 reduced Ru oxide supported on modified activated carbon to nanoscale Ru catalyst by biological reduction method and used it for liquid phase hydrogenation of TMCB. The results showed that when the Ru load increased from 1% to 2%, the yield of CBDO increased from 16.2% to 73.4%. Si et al.12 found that the single-metal Ru-based catalyst prepared by the impregnation method with Al2O3 as the carrier had high activity for the hydrogenation of TMCB. At the reaction temperature of 130 °C, the conversion rate of the raw material was 99.7%, and the selectivity of the product CBDO was only 62.6%.
 | ||
| Fig. 1 Hydrogenation of tetramethylcyclobutane-1,3-dione.5 | ||
At present, a large number of studies have shown that the catalysts for TMCB hydrogenation to CBDO are mainly divided into two categories. The first type includes supported transition metal catalysts with Ni,13,14 Cu,15 Co,16 Fe,17,18 and other active components. Although these catalysts have high catalytic activity for hydrogenation reactions, they are usually not highly selective.19 The second type is a precious metal-supported catalyst, especially a Ru-based precious metal catalyst, which has higher catalytic activity and selectivity in the ketone hydrogenation reaction, but the cost is higher. Therefore, this study carried out a hydrogenation process to prepare CBDO using TMCB as a raw material, investigated the catalytic hydrogenation effect of the Ru catalyst in the reaction, optimized the catalyst preparation process and hydrogenation reaction process, and analyzed the hydrogenation mechanism of the catalyst. The conversion and selectivity of the bimetallic Ru-based catalysts prepared in the present study at a lower temperature (i.e., 120 °C) were comparable to the reported results as compared to the currently reported catalysts.
2. Experimental
2.1. Materials
The following materials were used in the experiment:Activated alumina (Al2O3) and sodium borohydride (NaBH4, AR) were purchased from Sinopharm. Tetrahydrofuran (THF, AR) and stannous chloride dihydrate (SnCl2·2H2O, AR) were purchased from MREDA. Hydrochloric acid (HCl, 36–38%), copper nitrate (Cu(NO3)2, 99.5%), zinc nitrate (Zn(NO3)2, 99.0%), n-octane (AR) were purchased from Fuchen (Tianjin) Chemical Reagent Co., Ltd. Nickel nitrate (Ni(NO3)2, 98.0%) was purchased from Tianjin Fengchuan Chemical Reagent Co., Ltd. Sodium hydroxide (NaOH, AR) was purchased from Beijing Chemical Plant. Ruthenium trichloride trihydrate (RuCl3·3H2O, 98%) was purchased from Energy Chemical. Tetramethylcyclobutane-1,3-dione (TMCB, 99.0%) was purchased from Beijing HWRK Chem Co., Ltd. 2,2,4,4-Tetramethyl-1,3-cyclobutanediol (CBDO, 99.0%) was purchased from J&K Scientific. All chemicals used were of analytical grade.
2.2. Preparation of catalysts
The Ru catalyst was prepared by constant volume impregnation and chemical reduction methods, and activated alumina with a high specific surface area was selected as the catalyst carrier. After roasting at 500 °C for 4 hours and grinding, 40–60 mesh were selected as the carriers to dry and reserve. Firstly, a kind of auxiliary metal salt (Ni(NO3)2, Cu(NO3)2, Zn(NO3)2, and SnCl2·2H2O) was quantitatively weighed according to a certain load and dissolved in a certain amount of deionized water. After fully stirring, the above 40–60 mesh dried γ-Al2O3 was added to the salt solution according to the proportion, and ultrasonic shock was carried out for a certain time. It was soaked at room temperature for 24 hours, then dried in a constant-temperature drying oven at 120 °C for 3 hours, and then roasted in a muffle furnace at 560 °C for 2 hours. After roasting, the catalyst was removed and impregnated in a RuCl3·3H2O aqueous solution with a certain concentration. After ultrasonic shock for a certain time, the impregnation was carried out at 60 °C for 6 hours and then dried. Reduction with a 0.20 M NaBH4 solution containing 0.020 M NaOH (the molar ratio of NaBH4/Ru3+ is 4/1). After the reduction was complete, the washing solution was filtered and washed, and the washing solution was tested with a certain concentration of silver nitrate solution until no Cl ion exists, then the catalyst was rinsed with anhydrous ethanol for two to three times, and finally dried in a 120 °C drying box for 5 to 6 hours, then sealed and stored in a dryer for use.2.3. Characterization of catalysts
The X-ray diffraction (XRD) patterns of the catalysts were taken by the X-ray powder diffractometer (Ultima IV) with Cu Kα radiation (γ = 0.15405 nm), and the data were recorded in a 2θ range between 10 and 80° with a step size of 0.02°. The specific surface area, pore volume, and average aperture of the catalysts were tested using the ASAP 2020 Plus physical adsorption apparatus. Temperature-programmed reduction (TPR) was performed on a Micromeritics AutoChem II 2920 Automated Catalyst Characterization System equipped with a thermal conductivity detector (TCD). Approximately 0.1 g of catalyst was loaded into a U-shaped quartz reactor and purged with argon at 500 °C for 30 min to remove adsorbed water. After cooling to room temperature, the flow gas was switched to 10 vol% H2/Ar, and the catalyst was heated to 800 °C at a ramp rate of 10 °C min−1. X-ray photoelectron spectroscopy (XPS) measurements were carried out on a Thermo Scientific Escalab 250Xi photoelectron spectrometer. In this case, the vacuum of the analysis chamber was 4 × 10⁻⁹ mbar, the excitation source was Al Kα X-ray (photon energy hν = 1486.6 eV), the operating voltage was 14.6 kV, the filament current was 13.5 mA, and the signal accumulation was performed for 20 cycles. The test pass energy was 20 eV, the step size was 0.1 eV, and the charge correction adopted C 1s of 284.8 eV binding energy as the energy standard. Since the Ru 3d3/2 peak partially overlaps with the C 1s peak, the 3p orbital signal of Ru was used throughout this experiment to study the chemical state of Ru in the catalyst.20 Scanning electron microscopy (SEM) (Czech TESCAN MIRA LMS) was used to observe the particle surface morphology and distribution of Ru and Sn. The high-resolution transmission electron microscopy (HR-TEM) images were obtained on a JEOL JEM-F200 electron microscope with an acceleration voltage of 200 kV. Before the test, part of the sample was dispersed into an ethanol solution for ultrasound, and then a few drops of the dispersed liquid were added to the copper net one by one, dried, and photographed. This step was to evenly disperse the sample and facilitate the electron beam to penetrate the sample. The energy spectra model was JED-2300T. Agilent ICP-OES 725 ES was used to detect the active metal loading in the catalyst.2.4. Evaluation of catalyst activity
The reactions were carried out in a batch-type Parr reactor and were controlled by the same company's reaction controller (model 4848). During the reaction, 40 mL of tetrahydrofuran solution containing TMCB (the mass fraction of TMCB is 3%) and 0.5 g of catalyst were added to the reactor, and then the reactor was sealed. After sealing, the air in the reactor was replaced with nitrogen for 2–3 times and then with hydrogen for 2–3 times. After the replacement, hydrogen was filled with a certain pressure, and the heating was turned on. And open to stir reaction. At the end of the reaction, the heating was turned off, the reactor was cooled to room temperature, the gas in the kettle was discharged, and the reaction liquid was removed and centrifuged to separate the catalyst from the reaction liquid. The separated reaction solution was qualitatively analyzed by gas chromatography-mass spectrometry (Agilent 6890/5973N) for the composition of reaction products. The reaction solution was detected by a Shimadzu GC-2014C gas chromatograph, and the reactants and target products were quantitatively analyzed by the internal standard method, in which the internal standard was n-octane. The chromatographic conditions are shown in Table 1.| Chromatographic conditions | Parameters |
|---|---|
| Detector | FID |
| Chromatographic column model | HP-5 |
| Type of carrier gas | High purity nitrogen (99.999%) |
| Sample size | 0.25 μL |
| Detector temperature | 250 °C |
| Injector temperature | 250 °C |
| Initial column temperature | 100 °C, 8 min |
| Heating rate | 30 °C min−1 |
| Final temperature | 250 °C, 8 min |
The TMCB conversion, CBDO selectivity, and CBDO yield were calculated as follows:
 | (1) |
 | (2) |
 | (3) |
3. Results and discussion
3.1. Analysis of catalysts characterization
Fig. 2 shows the XRD pattern of catalyst samples with different Ru–Sn ratios. It can be seen from the XRD pattern that the four catalysts all have obvious characteristic diffraction peaks at 37.28°, 42.61°, 46.28°, and 67.03°, corresponding to the four crystal faces of γ-Al2O3 (200), (202), (104), and (214), respectively. The diffraction peaks corresponding to elemental Ru can hardly be distinguished from the spectra of the four catalysts, indicating that the elemental Ru particles are highly dispersed on the surface of the carrier.21,22 Similarly, the characteristic diffraction peak of SnO2 is obvious only on the catalyst spectrum when Ru/Sn = 1![[thin space (1/6-em)]](https://www.rsc.org/images/entities/char_2009.gif) :
:![[thin space (1/6-em)]](https://www.rsc.org/images/entities/char_2009.gif) 3, indicating that Sn species are also very evenly dispersed in the Ru–Sn/Al2O3 catalyst when the Sn content is low.23 The results above indicate that the synthesized catalyst has high dispersion.
3, indicating that Sn species are also very evenly dispersed in the Ru–Sn/Al2O3 catalyst when the Sn content is low.23 The results above indicate that the synthesized catalyst has high dispersion.
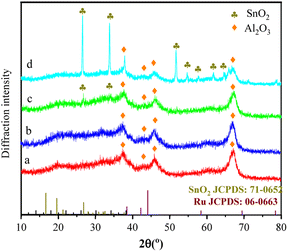 | ||
Fig. 2 XRD profiles of the Ru–Sn/Al2O3 catalysts with different ratios: (a) Ru/Sn = 2![[thin space (1/6-em)]](https://www.rsc.org/images/entities/char_2009.gif) : :![[thin space (1/6-em)]](https://www.rsc.org/images/entities/char_2009.gif) 1; (b) Ru/Sn = 1 1; (b) Ru/Sn = 1![[thin space (1/6-em)]](https://www.rsc.org/images/entities/char_2009.gif) : :![[thin space (1/6-em)]](https://www.rsc.org/images/entities/char_2009.gif) 1; (c) Ru/Sn = 1 1; (c) Ru/Sn = 1![[thin space (1/6-em)]](https://www.rsc.org/images/entities/char_2009.gif) : :![[thin space (1/6-em)]](https://www.rsc.org/images/entities/char_2009.gif) 2; (d) Ru/Sn = 1 2; (d) Ru/Sn = 1![[thin space (1/6-em)]](https://www.rsc.org/images/entities/char_2009.gif) : :![[thin space (1/6-em)]](https://www.rsc.org/images/entities/char_2009.gif) 3. 3. | ||
Table 2 shows the specific surface area, pore volume, and average aperture of four different Ru–Sn ratio catalysts and the catalyst carrier γ-Al2O3. It can be seen from the data in the table that the specific surface area, pore volume, and average aperture of the catalyst began to decrease with the introduction of Ru and Sn, indicating that Ru and Sn elements entered the pores of the carrier alumina, and when the proportion of Sn elements increased, the specific surface area, pore volume, and average aperture of the catalyst decreased slightly.
| Sample | Specific surface area/(m2 g−1) | Pore volume/(cm3 g−1) | Average aperture/nm |
|---|---|---|---|
| γ-Al2O3 | 206 | 0.47 | 9.1 |
Ru/Sn = 2![[thin space (1/6-em)]](https://www.rsc.org/images/entities/char_2009.gif) : :![[thin space (1/6-em)]](https://www.rsc.org/images/entities/char_2009.gif) 1 1 |
200 | 0.43 | 8.2 |
Ru/Sn = 1![[thin space (1/6-em)]](https://www.rsc.org/images/entities/char_2009.gif) : :![[thin space (1/6-em)]](https://www.rsc.org/images/entities/char_2009.gif) 1 1 |
191 | 0.41 | 8.1 |
Ru/Sn = 1![[thin space (1/6-em)]](https://www.rsc.org/images/entities/char_2009.gif) : :![[thin space (1/6-em)]](https://www.rsc.org/images/entities/char_2009.gif) 2 2 |
186 | 0.40 | 8.2 |
Ru/Sn = 1![[thin space (1/6-em)]](https://www.rsc.org/images/entities/char_2009.gif) : :![[thin space (1/6-em)]](https://www.rsc.org/images/entities/char_2009.gif) 3 3 |
191 | 0.38 | 7.6 |
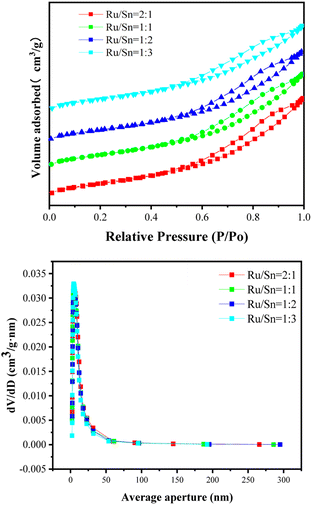
Fig. 3 shows the isothermal adsorption and desorption curves and pore size distribution curves of bimetallic catalysts with different Ru–Sn ratios. According to the nitrogen isothermal adsorption and desorption curves, the adsorption and desorption curves of the four catalysts are typical type IV isotherms, and there is an H1 adsorption hysteresis loop.24 The inflection point under relative pressure is within the range of 0.5–0.6, which corresponds to a porous adsorption capillary condensation system, indicating that the pores in the catalyst carrier are relatively uniform. It can be seen from the pore size distribution curve that the pore size distribution of the catalyst has little difference when the ratio of Ru–Sn is different, which mainly focuses on 2–50 nm, indicating that the change in Ru–Sn ratio does not affect the mesoporous structure of the catalyst carrier.
In order to more conveniently observe the surface morphology of the catalyst, Fig. 4 shows the SEM diagram of the bimetallic catalyst with a constant Ru load of 5% and a Ru–Sn ratio of 2![[thin space (1/6-em)]](https://www.rsc.org/images/entities/char_2009.gif) :
:![[thin space (1/6-em)]](https://www.rsc.org/images/entities/char_2009.gif) 1, 1
1, 1![[thin space (1/6-em)]](https://www.rsc.org/images/entities/char_2009.gif) :
:![[thin space (1/6-em)]](https://www.rsc.org/images/entities/char_2009.gif) 1, 1
1, 1![[thin space (1/6-em)]](https://www.rsc.org/images/entities/char_2009.gif) :
:![[thin space (1/6-em)]](https://www.rsc.org/images/entities/char_2009.gif) 2, and 1
2, and 1![[thin space (1/6-em)]](https://www.rsc.org/images/entities/char_2009.gif) :
:![[thin space (1/6-em)]](https://www.rsc.org/images/entities/char_2009.gif) 3, respectively. As can be seen from the figure, with the increase in the proportion of Sn, the distribution of particles on the catalyst surface is significantly more and more dispersed, indicating that the pores inside the catalyst carrier are occupied, causing excess metal elements to disperse on the surface of the carrier, increasing the specific surface area of the carrier, which is consistent with the BET result of the catalyst. As can be seen from Fig. 4c and d, on the surface of the bimetallic catalyst with a Ru–Sn ratio of 1
3, respectively. As can be seen from the figure, with the increase in the proportion of Sn, the distribution of particles on the catalyst surface is significantly more and more dispersed, indicating that the pores inside the catalyst carrier are occupied, causing excess metal elements to disperse on the surface of the carrier, increasing the specific surface area of the carrier, which is consistent with the BET result of the catalyst. As can be seen from Fig. 4c and d, on the surface of the bimetallic catalyst with a Ru–Sn ratio of 1![[thin space (1/6-em)]](https://www.rsc.org/images/entities/char_2009.gif) :
:![[thin space (1/6-em)]](https://www.rsc.org/images/entities/char_2009.gif) 1, the particles were dispersed more uniformly, and the particles were hardly agglomerated,25 which enhanced the diffusion and hydrogenation of the reactants and was favorable for improving the catalytic activity of the catalysts, which was in agreement with the later result that the catalysts showed the best results for the catalytic hydrogenation reaction of TMCB when the Ru–Sn ratio was 1
1, the particles were dispersed more uniformly, and the particles were hardly agglomerated,25 which enhanced the diffusion and hydrogenation of the reactants and was favorable for improving the catalytic activity of the catalysts, which was in agreement with the later result that the catalysts showed the best results for the catalytic hydrogenation reaction of TMCB when the Ru–Sn ratio was 1![[thin space (1/6-em)]](https://www.rsc.org/images/entities/char_2009.gif) :
:![[thin space (1/6-em)]](https://www.rsc.org/images/entities/char_2009.gif) 1.
1.
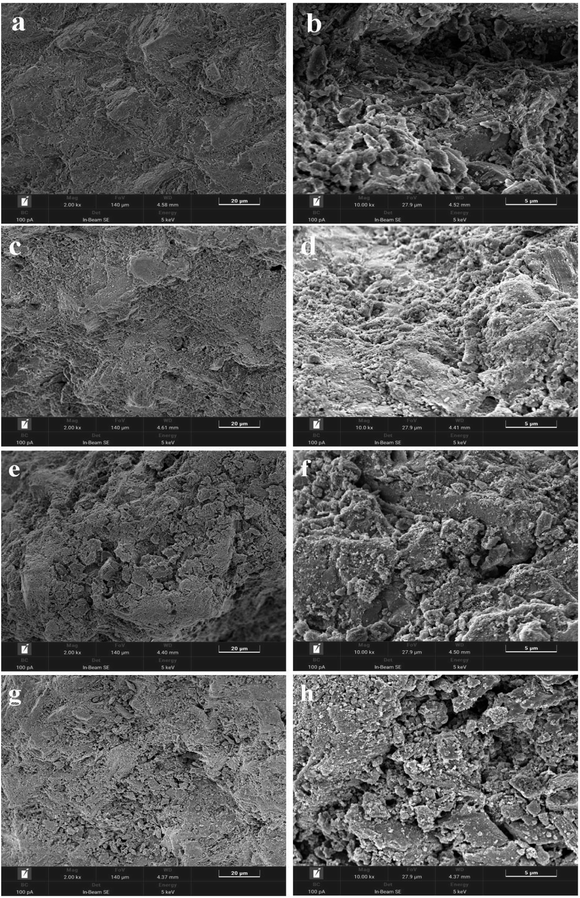 | ||
Fig. 4 Scanning electron microscopy map of the Ru–Sn/Al2O3 catalyst: (a and b) Ru![[thin space (1/6-em)]](https://www.rsc.org/images/entities/char_2009.gif) : :![[thin space (1/6-em)]](https://www.rsc.org/images/entities/char_2009.gif) Sn = 2 Sn = 2![[thin space (1/6-em)]](https://www.rsc.org/images/entities/char_2009.gif) : :![[thin space (1/6-em)]](https://www.rsc.org/images/entities/char_2009.gif) 1; (c and d) Ru 1; (c and d) Ru![[thin space (1/6-em)]](https://www.rsc.org/images/entities/char_2009.gif) : :![[thin space (1/6-em)]](https://www.rsc.org/images/entities/char_2009.gif) Sn = 1 Sn = 1![[thin space (1/6-em)]](https://www.rsc.org/images/entities/char_2009.gif) : :![[thin space (1/6-em)]](https://www.rsc.org/images/entities/char_2009.gif) 1; (e and f) Ru 1; (e and f) Ru![[thin space (1/6-em)]](https://www.rsc.org/images/entities/char_2009.gif) : :![[thin space (1/6-em)]](https://www.rsc.org/images/entities/char_2009.gif) Sn = 1 Sn = 1![[thin space (1/6-em)]](https://www.rsc.org/images/entities/char_2009.gif) : :![[thin space (1/6-em)]](https://www.rsc.org/images/entities/char_2009.gif) 2; (g and h) Ru 2; (g and h) Ru![[thin space (1/6-em)]](https://www.rsc.org/images/entities/char_2009.gif) : :![[thin space (1/6-em)]](https://www.rsc.org/images/entities/char_2009.gif) Sn = 1 Sn = 1![[thin space (1/6-em)]](https://www.rsc.org/images/entities/char_2009.gif) : :![[thin space (1/6-em)]](https://www.rsc.org/images/entities/char_2009.gif) 3. 3. | ||
Fig. 5 shows the H2 temperature-programmed reduction of Ru–Sn/Al2O3 catalysts with different Ru–Sn ratios. Catalysts with Ru![[thin space (1/6-em)]](https://www.rsc.org/images/entities/char_2009.gif) :
:![[thin space (1/6-em)]](https://www.rsc.org/images/entities/char_2009.gif) Sn = 2
Sn = 2![[thin space (1/6-em)]](https://www.rsc.org/images/entities/char_2009.gif) :
:![[thin space (1/6-em)]](https://www.rsc.org/images/entities/char_2009.gif) 1, 1
1, 1![[thin space (1/6-em)]](https://www.rsc.org/images/entities/char_2009.gif) :
:![[thin space (1/6-em)]](https://www.rsc.org/images/entities/char_2009.gif) 1, 1
1, 1![[thin space (1/6-em)]](https://www.rsc.org/images/entities/char_2009.gif) :
:![[thin space (1/6-em)]](https://www.rsc.org/images/entities/char_2009.gif) 2, and 1
2, and 1![[thin space (1/6-em)]](https://www.rsc.org/images/entities/char_2009.gif) :
:![[thin space (1/6-em)]](https://www.rsc.org/images/entities/char_2009.gif) 3 were tested, respectively. The figure shows the influence of Sn content on the TPR curve of Ru–Sn/Al2O3. First, it can be seen that the four catalysts all have a strong reduction peak, indicating that there is a strong interaction between Ru and Sn in the catalyst. The peak value around 105 °C is the decomposition of oxygen-containing functional groups on the surface of the carrier. When the Ru–Sn ratio in the catalyst is 2
3 were tested, respectively. The figure shows the influence of Sn content on the TPR curve of Ru–Sn/Al2O3. First, it can be seen that the four catalysts all have a strong reduction peak, indicating that there is a strong interaction between Ru and Sn in the catalyst. The peak value around 105 °C is the decomposition of oxygen-containing functional groups on the surface of the carrier. When the Ru–Sn ratio in the catalyst is 2![[thin space (1/6-em)]](https://www.rsc.org/images/entities/char_2009.gif) :
:![[thin space (1/6-em)]](https://www.rsc.org/images/entities/char_2009.gif) 1, the Sn content is the least, and the reduction peak of the catalyst is at 150 °C, corresponding to the reduction peak of Ru3+. After the gradual increase of Sn, the maximum reduction temperature of the catalyst increases with the increase in Sn content. The variation ranges from 150 °C to 210 °C.26,27 The increase in reduction peak temperature may be related to the strong interaction between the oxides of Ru and Sn.23
1, the Sn content is the least, and the reduction peak of the catalyst is at 150 °C, corresponding to the reduction peak of Ru3+. After the gradual increase of Sn, the maximum reduction temperature of the catalyst increases with the increase in Sn content. The variation ranges from 150 °C to 210 °C.26,27 The increase in reduction peak temperature may be related to the strong interaction between the oxides of Ru and Sn.23
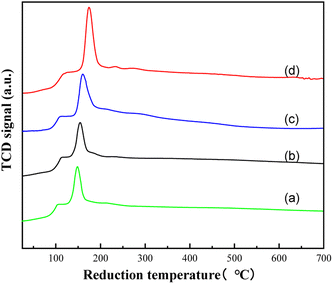 | ||
Fig. 5 H2-TPR plots of the Ru–Sn/Al2O3 catalyst with different ratios: (a) Ru![[thin space (1/6-em)]](https://www.rsc.org/images/entities/char_2009.gif) : :![[thin space (1/6-em)]](https://www.rsc.org/images/entities/char_2009.gif) Sn = 2 Sn = 2![[thin space (1/6-em)]](https://www.rsc.org/images/entities/char_2009.gif) : :![[thin space (1/6-em)]](https://www.rsc.org/images/entities/char_2009.gif) 1; (b) Ru 1; (b) Ru![[thin space (1/6-em)]](https://www.rsc.org/images/entities/char_2009.gif) : :![[thin space (1/6-em)]](https://www.rsc.org/images/entities/char_2009.gif) Sn = 1 Sn = 1![[thin space (1/6-em)]](https://www.rsc.org/images/entities/char_2009.gif) : :![[thin space (1/6-em)]](https://www.rsc.org/images/entities/char_2009.gif) 1; (c) Ru 1; (c) Ru![[thin space (1/6-em)]](https://www.rsc.org/images/entities/char_2009.gif) : :![[thin space (1/6-em)]](https://www.rsc.org/images/entities/char_2009.gif) Sn = 1 Sn = 1![[thin space (1/6-em)]](https://www.rsc.org/images/entities/char_2009.gif) : :![[thin space (1/6-em)]](https://www.rsc.org/images/entities/char_2009.gif) 2; (d) Ru 2; (d) Ru![[thin space (1/6-em)]](https://www.rsc.org/images/entities/char_2009.gif) : :![[thin space (1/6-em)]](https://www.rsc.org/images/entities/char_2009.gif) Sn = 1 Sn = 1![[thin space (1/6-em)]](https://www.rsc.org/images/entities/char_2009.gif) : :![[thin space (1/6-em)]](https://www.rsc.org/images/entities/char_2009.gif) 3. 3. | ||
Fig. 6 shows the X-ray photoelectron spectroscopy (XPS) of the bimetallic catalyst with a 5% Ru load and a 1![[thin space (1/6-em)]](https://www.rsc.org/images/entities/char_2009.gif) :
:![[thin space (1/6-em)]](https://www.rsc.org/images/entities/char_2009.gif) 1 Ru/Sn. From Fig. 5b and c, it can be seen that the orbital spin of Ru 3p splits into Ru 3p1/2 and Ru 3p3/2, and the orbital spin of Sn 3d splits into Sn 3d3/2 and Sn 3d5/2, respectively. Because Ru 3p1/2 and Sn 3d5/2 overlap in the binding energy of 485.0 eV, the two peaks strengthen each other. It can be seen from the XPS diagram of Ru 3p that the intensity ratio of the electron orbitals of Ru 3p1/2 and Ru 3p3/2 is greater than 2
1 Ru/Sn. From Fig. 5b and c, it can be seen that the orbital spin of Ru 3p splits into Ru 3p1/2 and Ru 3p3/2, and the orbital spin of Sn 3d splits into Sn 3d3/2 and Sn 3d5/2, respectively. Because Ru 3p1/2 and Sn 3d5/2 overlap in the binding energy of 485.0 eV, the two peaks strengthen each other. It can be seen from the XPS diagram of Ru 3p that the intensity ratio of the electron orbitals of Ru 3p1/2 and Ru 3p3/2 is greater than 2![[thin space (1/6-em)]](https://www.rsc.org/images/entities/char_2009.gif) :
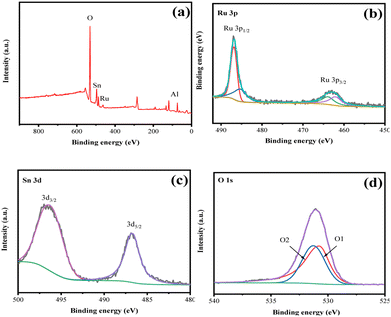
:![[thin space (1/6-em)]](https://www.rsc.org/images/entities/char_2009.gif) 1 due to the influence of Sn 3d5/2.28 The peaks of Ru 3p1/2 and Ru 3p3/2 were divided into two peaks, and it was found that the area of the peaks belonging to Ru0 at 485.0 eV and 462.6 eV accounted for 73%. Binding energy peaks of 489.3 eV and 466.5 eV are attributed to Ruδ+ in RuOx, with an area proportion of 27%, indicating that the presence of Sn increases the amount of Ru0 on the carrier surface,29 thus promoting the reaction. It is also not difficult to find from the XPS diagram of Sn 3d that the characteristic diffraction peak at 486.8 eV is attributed to Sn 3d5/2, while the diffraction peak at 495.4 eV is attributed to Sn 3d3/2. The two characteristic peaks indicate that the Sn element exists as Sn4+,30 which is consistent with the results measured by XRD. The peaks of 530.6 eV and 531.9 eV in the O 1s map are attributed to lattice oxygen and oxygen defects on the catalyst surface, respectively.31,32
1 due to the influence of Sn 3d5/2.28 The peaks of Ru 3p1/2 and Ru 3p3/2 were divided into two peaks, and it was found that the area of the peaks belonging to Ru0 at 485.0 eV and 462.6 eV accounted for 73%. Binding energy peaks of 489.3 eV and 466.5 eV are attributed to Ruδ+ in RuOx, with an area proportion of 27%, indicating that the presence of Sn increases the amount of Ru0 on the carrier surface,29 thus promoting the reaction. It is also not difficult to find from the XPS diagram of Sn 3d that the characteristic diffraction peak at 486.8 eV is attributed to Sn 3d5/2, while the diffraction peak at 495.4 eV is attributed to Sn 3d3/2. The two characteristic peaks indicate that the Sn element exists as Sn4+,30 which is consistent with the results measured by XRD. The peaks of 530.6 eV and 531.9 eV in the O 1s map are attributed to lattice oxygen and oxygen defects on the catalyst surface, respectively.31,32
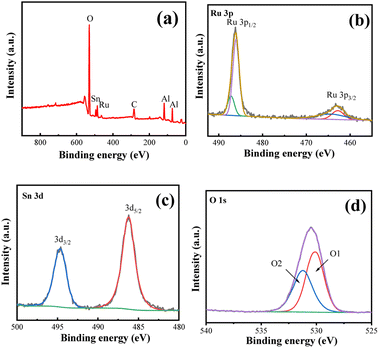 | ||
Fig. 6 1![[thin space (1/6-em)]](https://www.rsc.org/images/entities/char_2009.gif) : :![[thin space (1/6-em)]](https://www.rsc.org/images/entities/char_2009.gif) 1 the XPS spectra of the Ru–Sn/Al2O3 catalyst: (a) XPS survey; (b) Ru 3p; (c) Sn 3d; (d) O 1s. 1 the XPS spectra of the Ru–Sn/Al2O3 catalyst: (a) XPS survey; (b) Ru 3p; (c) Sn 3d; (d) O 1s. | ||
In order to further understand the distribution of Ru nanoparticles and SnO2 in the catalyst, TEM tests were conducted on the catalyst (Fig. 7). It can be seen from Fig. 6a and b that the catalytic active substances Ru and SnO2 nanoparticles are relatively evenly distributed on the Al2O3 carrier. Among them, the size of active nanoparticles is mainly distributed in the range of 0.4–1.4 nm, with an average size of 0.87 nm (Fig. 6c). In addition, clear lattice fringes with spacings of 0.209 nm and 0.26 nm were observed in HRTEM, corresponding to the (101) crystal face of Ru and the (101) crystal face of SnO2, respectively, demonstrating the existence of Ru as the active center in the catalyst.
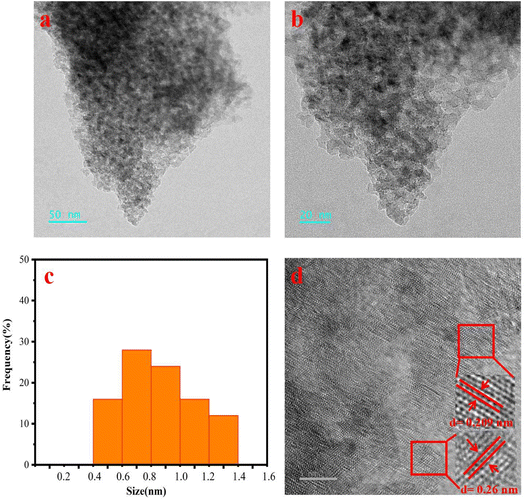 | ||
Fig. 7 (a and b) 1![[thin space (1/6-em)]](https://www.rsc.org/images/entities/char_2009.gif) : :![[thin space (1/6-em)]](https://www.rsc.org/images/entities/char_2009.gif) 1 the TEM of the Ru–Sn/Al2O3 catalyst (c) particle size distribution and (d) HRTEM. 1 the TEM of the Ru–Sn/Al2O3 catalyst (c) particle size distribution and (d) HRTEM. | ||
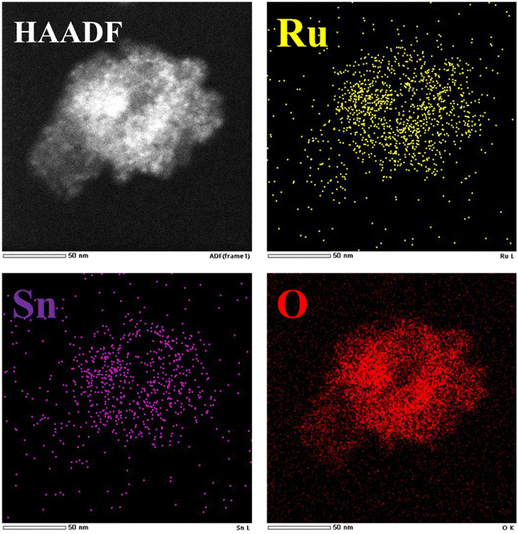
On this basis, in order to further observe the dispersion of Ru, we carried out further high-angle ring dark field scanning transmission electron microscopy (HAADF-STEM) and EDS element mapping analysis on the catalyst, as shown in Fig. 8. The EDS image showed that Ru, Sn, and O elements were evenly distributed on the Al2O3 carrier. TEM and EDS analysis results further indicated that the catalytic active Ru and SnO2 nanoparticles were successfully loaded on the Al2O3 support, which also proved that the Ru in the 1![[thin space (1/6-em)]](https://www.rsc.org/images/entities/char_2009.gif) :
:![[thin space (1/6-em)]](https://www.rsc.org/images/entities/char_2009.gif) 1 Ru–Sn/Al2O3 catalyst has a high dispersion and thus has a high activity in the TMCB catalytic hydrogenation reaction.
1 Ru–Sn/Al2O3 catalyst has a high dispersion and thus has a high activity in the TMCB catalytic hydrogenation reaction.
3.2. Reaction performance of catalyst hydrogenation
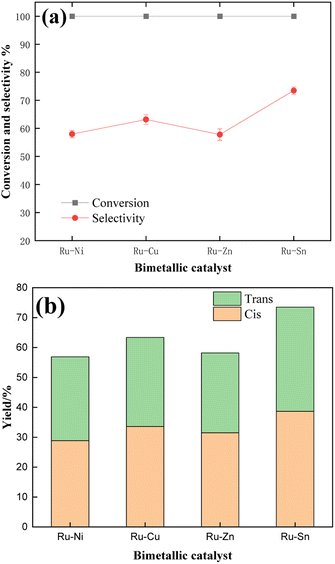
Firstly, in order to find an auxiliary metal with the best selectivity for CBDO, four different bimetallic catalysts, Ru–Ni/Al2O3, Ru–Cu/Al2O3, Ru–Zn/Al2O3, and Ru–Sn/Al2O3, were prepared, and the Ru loading capacity was 5% and the ratio of Ru to auxiliary metal was 1![[thin space (1/6-em)]](https://www.rsc.org/images/entities/char_2009.gif) :
:![[thin space (1/6-em)]](https://www.rsc.org/images/entities/char_2009.gif) 1. It can be seen from the data in Fig. 9 that under the catalytic conditions of four bimetallic catalysts, the conversion rate of TMCB is 100%, while the cis–trans ratio of selectivity to product isomers is different. Among them, Ru–Ni/Al2O3 and Ru–Zn/Al2O3 catalysts have similar selectivity for CBDO, but the presence of Zn and Ni has different effects on isomers, and Zn is more conducive to the formation of cis-products. The selectivity of the Ru–Cu/Al2O3 catalyst is higher than the first two, but the effect of Sn is ultimately better.
1. It can be seen from the data in Fig. 9 that under the catalytic conditions of four bimetallic catalysts, the conversion rate of TMCB is 100%, while the cis–trans ratio of selectivity to product isomers is different. Among them, Ru–Ni/Al2O3 and Ru–Zn/Al2O3 catalysts have similar selectivity for CBDO, but the presence of Zn and Ni has different effects on isomers, and Zn is more conducive to the formation of cis-products. The selectivity of the Ru–Cu/Al2O3 catalyst is higher than the first two, but the effect of Sn is ultimately better.
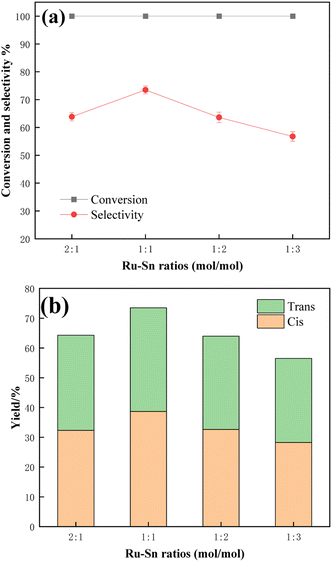
Fig. 10 shows the effect of different Ru–Sn ratios in the catalyst on the catalytic hydrogenation of TMCB. Under the condition of 5% fixed Ru loading, the catalytic effects of catalysts with a Ru–Sn molar ratio of 2![[thin space (1/6-em)]](https://www.rsc.org/images/entities/char_2009.gif) :
:![[thin space (1/6-em)]](https://www.rsc.org/images/entities/char_2009.gif) 1, 1
1, 1![[thin space (1/6-em)]](https://www.rsc.org/images/entities/char_2009.gif) :
:![[thin space (1/6-em)]](https://www.rsc.org/images/entities/char_2009.gif) 1, 1
1, 1![[thin space (1/6-em)]](https://www.rsc.org/images/entities/char_2009.gif) :
:![[thin space (1/6-em)]](https://www.rsc.org/images/entities/char_2009.gif) 2, and 1
2, and 1![[thin space (1/6-em)]](https://www.rsc.org/images/entities/char_2009.gif) :
:![[thin space (1/6-em)]](https://www.rsc.org/images/entities/char_2009.gif) 3 were investigated, respectively. Dispersion of the active metal is very important for an effective catalytic reaction,33 and a catalyst with a Ru–Sn molar ratio of 1
3 were investigated, respectively. Dispersion of the active metal is very important for an effective catalytic reaction,33 and a catalyst with a Ru–Sn molar ratio of 1![[thin space (1/6-em)]](https://www.rsc.org/images/entities/char_2009.gif) :
:![[thin space (1/6-em)]](https://www.rsc.org/images/entities/char_2009.gif) 1 dispersed the Ru nanoparticles better compared to other Ru–Sn molar ratios. This makes catalysts with this molar ratio more effective in TMCB hydrogenation reactions. However, the decreased performance of catalysts with high Sn content, such as 1
1 dispersed the Ru nanoparticles better compared to other Ru–Sn molar ratios. This makes catalysts with this molar ratio more effective in TMCB hydrogenation reactions. However, the decreased performance of catalysts with high Sn content, such as 1![[thin space (1/6-em)]](https://www.rsc.org/images/entities/char_2009.gif) :
:![[thin space (1/6-em)]](https://www.rsc.org/images/entities/char_2009.gif) 2 and 1
2 and 1![[thin space (1/6-em)]](https://www.rsc.org/images/entities/char_2009.gif) :
:![[thin space (1/6-em)]](https://www.rsc.org/images/entities/char_2009.gif) 3, could be attributed to the excess Sn blocking the active sites of the catalysts. From the results in the figure, it could be seen that the selectivity of the target product CBDO reached a maximum value of 73.5% in the Ru–Sn bimetallic catalyst with a molar ratio of Ru element to Sn element of 1
3, could be attributed to the excess Sn blocking the active sites of the catalysts. From the results in the figure, it could be seen that the selectivity of the target product CBDO reached a maximum value of 73.5% in the Ru–Sn bimetallic catalyst with a molar ratio of Ru element to Sn element of 1![[thin space (1/6-em)]](https://www.rsc.org/images/entities/char_2009.gif) :
:![[thin space (1/6-em)]](https://www.rsc.org/images/entities/char_2009.gif) 1, and the cis-product was also highly selective.
1, and the cis-product was also highly selective.
Fig. 11 shows the reaction results of TMCB hydrogenation catalyzed by a 1![[thin space (1/6-em)]](https://www.rsc.org/images/entities/char_2009.gif) :
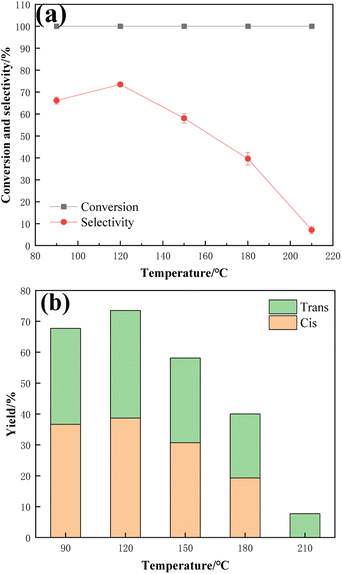
:![[thin space (1/6-em)]](https://www.rsc.org/images/entities/char_2009.gif) 1 Ru–Sn bimetallic catalyst at different temperatures. Five temperatures, including 90 °C, 120 °C, 150 °C, 180 °C, and 210 °C, were selected as the investigation points, respectively. According to the data in the figure, the conversion rate of TMCB is 100% at five different temperatures, but the product selectivity shows a trend of increasing first and then decreasing. When the reaction temperature is 120 °C, the selectivity reaches its maximum value of 73.5%, and the selectivity of cis-products is also high at this time. Therefore, by considering the selectivity of the CBDO, 120 °C was selected for further optimization studies.
1 Ru–Sn bimetallic catalyst at different temperatures. Five temperatures, including 90 °C, 120 °C, 150 °C, 180 °C, and 210 °C, were selected as the investigation points, respectively. According to the data in the figure, the conversion rate of TMCB is 100% at five different temperatures, but the product selectivity shows a trend of increasing first and then decreasing. When the reaction temperature is 120 °C, the selectivity reaches its maximum value of 73.5%, and the selectivity of cis-products is also high at this time. Therefore, by considering the selectivity of the CBDO, 120 °C was selected for further optimization studies.
Fig. 12 shows the results of hydrogenation of TMCB catalyzed by a 1![[thin space (1/6-em)]](https://www.rsc.org/images/entities/char_2009.gif) :
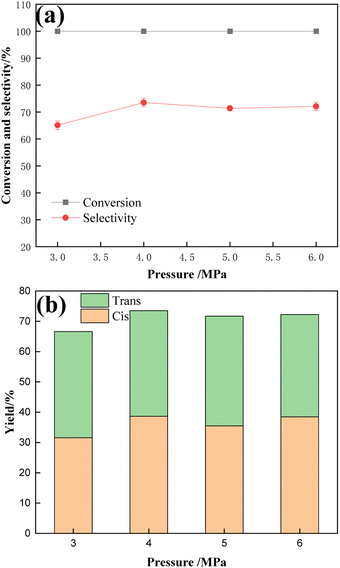
:![[thin space (1/6-em)]](https://www.rsc.org/images/entities/char_2009.gif) 1 Ru–Sn bimetallic catalyst under different reaction pressures. The effects of reaction pressures of 3 MPa, 4 MPa, 5 MPa, and 6 MPa on the hydrogenation results were investigated. According to the results shown in the figure, with the increase in reaction pressure, the conversion rate of TMCB remains 100% unchanged, while the selectivity of the target product CBDO increases first and then decreases slightly. Considering the selectivity of the product and cis-product, 4 MPa is the most appropriate reaction pressure.
1 Ru–Sn bimetallic catalyst under different reaction pressures. The effects of reaction pressures of 3 MPa, 4 MPa, 5 MPa, and 6 MPa on the hydrogenation results were investigated. According to the results shown in the figure, with the increase in reaction pressure, the conversion rate of TMCB remains 100% unchanged, while the selectivity of the target product CBDO increases first and then decreases slightly. Considering the selectivity of the product and cis-product, 4 MPa is the most appropriate reaction pressure.
Fig. 13 shows the effect of different reaction times on the hydrogenation of TMCB catalyzed by a 1![[thin space (1/6-em)]](https://www.rsc.org/images/entities/char_2009.gif) :
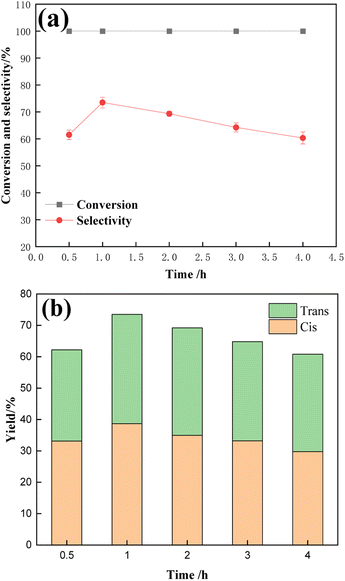
:![[thin space (1/6-em)]](https://www.rsc.org/images/entities/char_2009.gif) 1 Ru–Sn bimetal catalyst. The reaction time was 0.5 h, 1 h, 2 h, 3 h, and 4 h. According to the data in the figure, with the extension of the reaction time, the conversion rate of TMCB remained 100% unchanged, while the selectivity of the target product CBDO increased first and then gradually decreased. When the reaction time was 1 h, the selectivity reached the maximum of 73.5%, and the selectivity of the cis-product was also high at this time, indicating that 1 h was the best reaction time for the hydrogenation reaction.
1 Ru–Sn bimetal catalyst. The reaction time was 0.5 h, 1 h, 2 h, 3 h, and 4 h. According to the data in the figure, with the extension of the reaction time, the conversion rate of TMCB remained 100% unchanged, while the selectivity of the target product CBDO increased first and then gradually decreased. When the reaction time was 1 h, the selectivity reached the maximum of 73.5%, and the selectivity of the cis-product was also high at this time, indicating that 1 h was the best reaction time for the hydrogenation reaction.
3.3. Investigation of catalyst life
According to the results of ICP-OES, it was found that the actual loading of Ru was lower than the theoretical value of 5% for both fresh and recovered catalysts, which might be due to the structure of the catalyst carrier itself. In addition, compared with the fresh catalyst, the actual loading capacity of the recovered catalyst Ru is reduced to a certain extent, and the results are shown in Table 3. This indicates that the number of active sites of Ru is reduced in the recovered catalyst after the hydrogenation reaction, probably due to the oxidation of Ru.| Sample | Theoretical value (wt%) | Actual loading (wt%) |
|---|---|---|
| Fresh catalyst | 5.00 | 4.02 |
| Recovered catalyst | 5.00 | 3.71 |
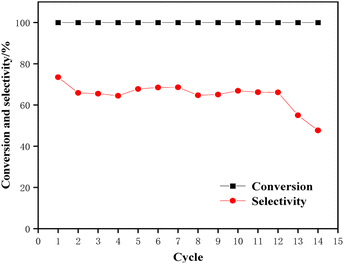
A lifetime test of the Ru–Sn bimetallic catalyst was carried out as follows: 40 mL of tetrahydrofuran solution containing 3% TMCB and 0.5 g of Ru–Sn/Al2O3 catalyst. After the reaction was completed at a reaction temperature of 120 °C, a reaction time of 1 hour, and a hydrogen pressure of 4 MPa, the reaction liquid was centrifuged to separate the solution from the catalyst, and the separated catalyst was washed with solvent several times. The washing solution was detected by gas chromatography until the last washing solution was detected without impurities, then washed with anhydrous ethanol once and dried in a drying oven at 80 °C for more than 5 hours. The recovered catalyst was then repeated in the above steps. Fig. 14 shows the results after 14 repetitions. As can be seen from the figure, the activity of the catalyst began to decline after 12 cycles of reaction, indicating that the catalyst had a long service life and stable catalytic performance.
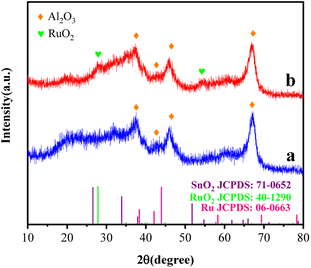
In order to investigate the cause of the deactivation of the bimetallic catalyst, the recovered catalyst was analyzed by XRD and compared with the fresh catalyst. Fig. 15 shows the XRD comparison between the recovered catalyst and the fresh catalyst. It can be seen from the XRD pattern that the two catalysts have obvious characteristic diffraction peaks at 37.28°, 42.61°, 46.28°, and 67.03°. The four characteristic diffraction peaks correspond to the (200), (202), (104), and (214) crystal faces of γ-Al2O3, respectively. It can be clearly seen from the figure that the used catalyst has a diffraction peak of Ru oxide, which is located at 28.0° and 54.3°, respectively,34 indicating that the catalyst is oxidized during the hydrogenation reaction, and the peak strength of the recovered catalyst is lower than that of the fresh catalyst, indicating that the crystallinity of the carrier is reduced to a certain extent.35,36
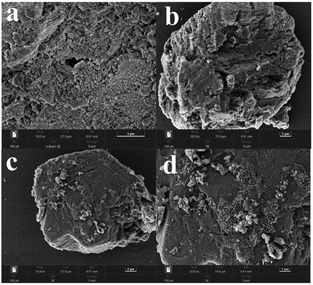
Scanning electron microscopy was used to investigate the surface morphology of the deactivated catalyst, as shown in Fig. 16a, which is a fresh catalyst, and Fig. 16b–d, which is a deactivated catalyst. It can be seen that the number of particles dispersed on the surface of the deactivated catalyst is significantly less than that of the fresh catalyst. In addition, it can be seen from Fig. 16d that a small amount of non-existent flake substances are attached to the surface of the catalyst, which may be Ru oxide produced during the recycling of the catalyst.37
In order to further investigate the cause of catalyst deactivation, the recovered catalyst was analyzed by X-ray photoelectron spectroscopy. Fig. 17 shows the X-ray photoelectron spectra of the recovered catalyst. Referring to the peak value of C 1s (284.8 eV) as the correction peak, correction analysis was carried out on the Ru 3p orbit and Sn 3d orbit, respectively. From Fig. 17b and c, it can be seen that Ru 3p orbital spin splits into Ru 3p1/2 and Ru 3p3/2, and Sn 3d orbital splits into Sn 3d3/2 and Sn 3d5/2, respectively. Since Ru 3p1/2 and Sn 3d5/2 overlap in the binding energy of 485.0 eV, this causes the two peaks to reinforce each other. As can be seen from the XPS diagram of Ru 3p, the peak at 485.0 eV attributed to Ru0 is much lower than that at the binding energy of 489.3 eV, and the ratio of the total area of Ru0 peaks to Ruδ+ changes to 30% and 70%, indicating that the Ru element on the catalyst is oxidized during use. This may also be the direct cause of catalyst deactivation.38 The form of Sn has not changed and still exists as SnO2. The proportion of oxygen defects in catalysts is higher than that of fresh catalysts. In order to verify whether Ru oxidation caused the catalyst deactivation, the recovered catalyst was calcined to remove carbon deposition and then reduced again. The activity of the catalyst after reduction can be restored to 80–90% of the original, indicating that the hydrogenation reaction occurs under the catalysis of reduced Ru, and the catalyst activity can be restored by re-reduction.
3.4. Mechanism analysis of the hydrogenation of TMCB on the Ru–Sn bimetallic catalyst
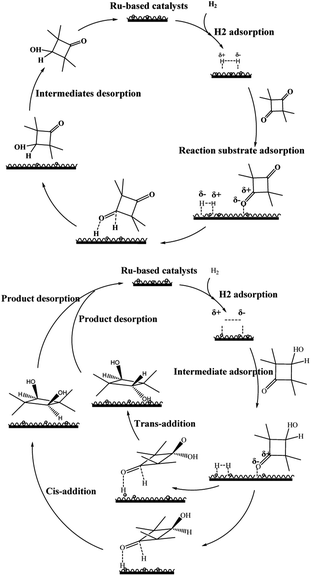
When hydrogen is used as the hydrogen source, hydrogen molecules are adsorbed on the surface of the catalyst, and under the activation of the active metal, the hydrogen molecular bond is heteroferred into Hδ+–Hδ−.39 The metal atoms at the metal–oxide interface are usually positively charged40 and maintain the high dispersion and stability of the metal particles by forming strong Mδ+–O2− bonds with the oxide carrier. Most carbonyl hydrogenation undergoes the enol structure,41 but because the tetramethyl cyclobutene dione structure does not contain α-H, the hydrogenation process does not go through the enol form. Only in the presence of the carrier gamma-alumina does the hydrogenation process almost never occur, indicating that the carrier itself has no catalytic activity; that is, H2 is not activated on the surface of the carrier but on the surface of the metal. The hydrogenation process of TMCB is mainly divided into two steps. The first step is the hydrogenation of a carbonyl group. For this hydrogenation process, the hydrogen molecule is activated at the active metal site on the catalyst surface and isomerized into Hδ+–Hδ−, while the reaction substrate is adsorbed on the catalyst surface, the carbonyl group of the substrate is activated, and the carbon–oxygen double bond is polarized. The polarized Oδ− and Cδ+ can easily combine with the heterocleaved hydrogen to form the intermediate 3-hydroxy-2,2,4,4-tetramethylcyclobutanone as the product of the first step of the hydrogenation process. The second step is the carbonyl hydrogenation of the intermediate, which is adsorbed on the catalyst surface again. The second ketocarbonyl group is activated and combined with the heterobased hydrogen species to complete the two-step hydrogenation and desorption from the catalyst surface. Form the final product, CBDO. The possible reaction mechanisms are shown in Fig. 18.4. Conclusions
In this paper, different Ru bimetallic catalysts, Ru–Me/Al2O3 (Me = Ni, Cu, Sn, and Zn), were synthesized. The crystal type, specific surface area, pore structure, elemental valence, morphology, and other related properties of the catalysts were characterized and analyzed. The effects of different reaction conditions on the hydrogenation performance of the catalysts were investigated.(1) The characterization results of XRD, XPS, SEM, and TEM show that Ru exists in the form of Ru0 and Sn exists in the form of an oxidized state, and Ru0 is uniformly distributed on the bimetallic catalysts in a small size with high dispersion.
(2) The best catalytic performance for the hydrogenation of TMCB was found when Sn was used as the auxiliary metal and the Ru–Sn ratio was 1![[thin space (1/6-em)]](https://www.rsc.org/images/entities/char_2009.gif) :
:![[thin space (1/6-em)]](https://www.rsc.org/images/entities/char_2009.gif) 1. The suitable reaction conditions for this experiment were as follows: at a lower temperature (i.e., 120 °C), the conversion of TMCB was 100%, the selectivity of CBDO was 73.5%, and the cis–trans ratio was 1.11.
1. The suitable reaction conditions for this experiment were as follows: at a lower temperature (i.e., 120 °C), the conversion of TMCB was 100%, the selectivity of CBDO was 73.5%, and the cis–trans ratio was 1.11.
Author contributions
The manuscript was written through the contributions of all authors. All authors have given their approval to the final version of the manuscript.Conflicts of interest
There are no conflicts to declare.Acknowledgements
This research was supported by the National Natural Science Foundation of China under agreement number 22378026 and the Project of Construction of Innovative Teams and Teacher Career Development for Universities and Colleges under Beijing Municipality (IDHT20180508).Notes and references
- N. C. Hoppens, T. W. Hudnall, A. L. Foster and C. J. Booth, Polym. Prepr., 2004, 45, 1016–1017 CAS.
- A. M. Nelson and T. E. Long, Polym. Int., 2012, 61, 1485–1491 CrossRef CAS.
- R. K. Shahni, M. Mabin, Z. Wang, M. Shaik, A. Ugrinov and Q. R. Chu, Polym. Chem., 2020, 11, 6081–6090 RSC.
- E. Moskala, A history of copolyester development at Eastman Chemical Company, Annual Technical Conference of the Society of Plastics Engineers, 2009, pp. 1534–1538 Search PubMed.
- J. Sumner, E. Charles, B. L. Gustafson and J. R. Knight, Process for the manufacture of 2,2,4,4-tetramethylcyclobutane-1,3-diol, EP, EP0681564A1, 1994 Search PubMed.
- M. Zhang, R. B. Moore and T. E. Long, J. Polym. Sci., Part A: Polym. Chem., 2012, 50, 3710–3718 CrossRef CAS.
- C. D. Shirrell and D. E. Williams, Acta Crystallogr., Sect. B: Struct. Sci., 1976, 32, 1867–1870 CrossRef.
- G. J. Cheng and Y. Lou, Petrochem. Technol. Appl., 2013, 31, 342–346 CAS.
- E. D. Crawford, D. S. Mcwilliams, D. S. Porter and G. W. Connell, Film(s) and/or sheet(s) made using polyester compositions containing low amounts of cyclobutanediol, US Pat., US2006287478A1, 2006 Search PubMed.
- Y. Lou, Y. L. Zhang, M. Y. Shi, X. Li, Y. M. Wang, X. L. Zhang and Z. T. Cao, Petrochem. Technol. Appl., 2015, 33, 405–407 CAS.
- Y. Q. Huang, Preparation and liquid-phase hydrogenation of carbon-supported noble metal catalyst, PhD thesis, Zhejiang University, 2016.
- Y. X. Si, L. Yang, C. X. Wang, Y. W. Cheng, S. Y. Yao, L. J. Wang and X. Li, Catal. Commun., 2022, 166, 106453 CrossRef CAS.
- J. E. Mccusker-Orth, J. L. Stavinoha, A. D. Messina, S. T. Perri, Z. Liu, P. C. Heidt and B. A. Tennant, Process for the preparation of tetraalkylcyclobutane-1,3-diol in the presence of a cobalt-based catalyst, US Pat., US7521583B2, 2009 Search PubMed.
- Z. Zhu, G. C. Tustin, P. C. Heidt and Z. Liu, Process for the preparation of 2,2,4,4-tetraalkylcyclobutane-1,3-diols, US Pat., 8420869, 2013 Search PubMed.
- E. Charles, J. Sumner, L. Bruce and J. R. Knight, Process for the manufacture of 2,2,4,4-tetramethylcyclobutanediol, US Pat., 5258556, 1993 Search PubMed.
- J. E. Mccusker-Orth, J. L. Stavinoha, A. D. Messina, S. T. Perri, Z. Liu and P. C. Heidt, Process for the preparation of a tetraalkylcyclobutane-1,3-diol using an iridium-promoted cobalt-based catalyst, US Pat., US7524994B2, 2009 Search PubMed.
- J. E. Mccusker-Orth and J. Ellen, Process for the preparation of a tetraalkylcyclobutane-1,3-diol using an iridium-promoted cobalt-based catalyst, US Pat., US7838707B2, 2010 Search PubMed.
- J. E. Mccusker-Orth, J. Ellen and M. W. Salyer, Process for the preparation of a tetraalkylcyclobutane-1,3-diol using a promoted nickel-based catalyst, US Pat., 7560600, 2009 Search PubMed.
- Y. Wang, X. Yang, Y. Chen, S. Nie and M. Xie, React. Kinet., Mech. Catal., 2017, 122, 915–930 CrossRef CAS.
- R. B. Carolina, I. Mark, W. Karen, G. R. Antonio and I. Rodríguez-Ramos, Appl. Catal., A, 2018, 563, 177–184 CrossRef.
- L. Zhang, J. Kim, J. Zhang, F. Nan, N. Gauquelin, G. A. Botton and S. Knights, Appl. Energy, 2013, 103, 507–513 CrossRef CAS.
- P. Manoj, Y. Zahira, Q. M. Jia and S. T. Mohd, New J. Chem., 2018, 42, 14843–14856 RSC.
- J. Pang, M. Zheng, X. Li, Y. Jiang, Y. Zhao, A. Wang and T. Zhang, Appl. Catal., B, 2018, 239, 300–308 CrossRef CAS.
- Q. H. Geng, Z. W. Xu, J. L. Wang, C. Song, Y. Wu and Y. Wang, Chem. Eng. J., 2023, 469, 143941 CrossRef CAS.
- P. Manoj, Y. Zahira, Z. M. Mohd, S. T. Mohd and S. J. Seri, Appl. Catal., B, 2017, 218, 298–316 CrossRef.
- M. A. Sánchez, V. A. Mazzieri, S. Pronier, M. A. Vicerich, C. Especel, F. Epron and C. L. Pieck, J. Chem. Technol. Biotechnol., 2019, 94, 982–991 CrossRef.
- Y. Pouilloux, F. Autin, C. Guimon and J. Barrault, J. Catal., 1998, 176, 215–224 CrossRef CAS.
- X. Wang, G. Lan, H. Liu, Y. Zhu and Y. Li, Catal. Sci. Technol., 2018, 8, 6143–6149 RSC.
- C. Onwudinanti, I. Tranca, T. Morgan and S. Tao, Nanomaterials, 2019, 9, 129–147 CrossRef PubMed.
- V. O. Rodina, D. Y. Ermakov, A. A. Saraev, S. I. Reshetnikov and V. A. Yakovlev, Appl. Catal., B, 2017, 209, 611–620 CrossRef CAS.
- G. Ou, Y. Xu, B. Wen, R. Lin, B. Ge, Y. Tang and Y. Li, Nat. Commun., 2018, 9, 1302 CrossRef.
- J. J. Musci, A. B. Merlo and M. L. Casella, Catal. Today, 2017, 296, 43–50 CrossRef CAS.
- P. Manoj, Q. M. Jia, Y. N. Dong, Z. X. Yue and S. Y. Shan, RSC Adv., 2019, 9, 32517–32534 RSC.
- C. Wang, C. Tian, Y. Guo, Z. Zhang, W. Hua, W. Zhan, Y. Guo, L. Wang and G. Lu, J. Hazard. Mater., 2018, 342, 290–296 CrossRef CAS PubMed.
- B. Zhang, Q. Wu, C. Zhang, X. Su, R. Shi, W. Lin, Y. Li and F. Zhao, ChemCatChem, 2017, 19, 3646–3654 CrossRef.
- P. R. K. Vishnu, R. Arunachalam, R. R. Pavul, S. Mohan and L. Peter, Curr. Appl. Phys., 2018, 10, 1143–1148 Search PubMed.
- W. Wang, Z. Ouyang, R. Xu, X. Li, X. Huang and Z. Xue, Ironmaking Steelmaking, 2016, 45, 309–316 CrossRef.
- T. Y. Gao, Study on selective oxidation of 5-hydroxymethylfurfural to 2,5-furan dicarboxylic acid on supported ruthenium nanocrystalline catalyst, MPhil thesis, Yunnan University, 2019.
- B. Mattson, W. Foster, J. Greimann, T. Hoette, N. Le, A. Mirich and E. Schwanke, J. Chem. Educ., 2013, 90, 613–619 CrossRef CAS.
- C. G. Santana and M. J. Krische, ACS Catal., 2021, 11, 5572–5585 CrossRef CAS PubMed.
- N. Carrara, J. M. Badano, S. Vailard, C. Vera and M. Quiroga, Catal. Lett., 2020, 150, 461–470 CrossRef CAS.
| This journal is © The Royal Society of Chemistry 2024 |

