 Open Access Article
An investigation of structural, thermal, and electrical conductivity properties for understanding transport mechanisms of CuWO4 and α-CuMoO4 compounds
N. Chakchouk a,
K. Karoui
 *ac,
N. Drissib,
F. Jomnid and
A. Ben Rhaiem
 a
a
aUniversity of Sfax, Laboratory of Spectroscopic Characterization and Optics of Materials, Faculty of Sciences, BP 1171, 3000, Sfax, Tunisia. E-mail: karouikarim36@yahoo.com; Tel: +0021625648756
bDepartment of Physics, Faculty of Science, King Khalid University, PO Box 9004, Abha 61413, Saudi Arabia
cGREMAN UMR 7347-CNRS, CEA, INSACVL, University of Tours, Blois, France
dUniversité de Tunis El Manar, Laboratoire LMOP, LR99ES17, El Manar, 2092 Tunis, Tunisia
First published on 2nd January 2024
Abstract
Recently, inorganic oxide components with high ionic conductivity have been widely explored due to their high stability, safety, and energy density properties. In this context, the present work focuses on the inorganic oxides CuMO4 (M = W, Mo), which have been successfully synthesized using the traditional solid-state method. They were characterized by X-ray powder diffraction, thermal analysis, and complex impedance spectroscopy. X-ray diffraction data refined via the Rietveld method indicated that these compounds are well crystallized in the triclinic system with the P![[1 with combining macron]](https://www.rsc.org/images/entities/char_0031_0304.gif) space group. Besides, the electrical conductivity behavior of these materials was analyzed using the impedance spectroscopy technique in the frequency range of 100 to 106 Hz and in the temperature range of 443 K to 563 K. The absence of a phase transition observed in the calorimetric study was confirmed by the σg and ωh variations as a function of temperature. The AC conductivity was analyzed by Jonscher's power law. The outcomes of the study on charge transportation in CuMO4 (where M = W, Mo) suggest that the overlapping large polaron tunneling (OLPT) mechanism was present in CuMoO4, while the correlated barrier hopping (CBH) and the non-overlapping small polaron tunneling (NSPT) were present in CuWO4. A correlation between the crystal structure and the ionic conductivity was established and discussed. For the two title compounds, modulus analysis revealed that the charge carriers were mobile over short and long distances at low and high frequencies, respectively. The temperature variation of the M′′ peak showed a thermally activated relaxation process.
space group. Besides, the electrical conductivity behavior of these materials was analyzed using the impedance spectroscopy technique in the frequency range of 100 to 106 Hz and in the temperature range of 443 K to 563 K. The absence of a phase transition observed in the calorimetric study was confirmed by the σg and ωh variations as a function of temperature. The AC conductivity was analyzed by Jonscher's power law. The outcomes of the study on charge transportation in CuMO4 (where M = W, Mo) suggest that the overlapping large polaron tunneling (OLPT) mechanism was present in CuMoO4, while the correlated barrier hopping (CBH) and the non-overlapping small polaron tunneling (NSPT) were present in CuWO4. A correlation between the crystal structure and the ionic conductivity was established and discussed. For the two title compounds, modulus analysis revealed that the charge carriers were mobile over short and long distances at low and high frequencies, respectively. The temperature variation of the M′′ peak showed a thermally activated relaxation process.
1. Introduction
During the past decade, interest in the relationship between crystal structures and physical properties has experienced a resurgence due to the discovery of high-temperature superconductivity and its dependence on details of the crystal structure. There are various typical structure types for binary oxides with the general formula AMO4, in which A and M cations can be multivalently and compositely replaced.Many AMO4 oxides, such as arsenates, chromates, silicates, vanadates, and phosphates, are isostructural with zircon (I41/a m d, No. 141, Z = 4); a few AMO4 oxides, such as periodates, germinates, tungstates, and molybdates, crystallize in the scheelite structure (I41/a, No. 88, Z = 4); a large number of tantalates, molybdates, and tungstates crystallize with the wolframite structure (P2/c, No. 13, Z = 2); relatively few AMO4 oxides exist as M′-fergusonite structures (P21/c, No. 14, Z = 2) or M′-fergusonite under normal conditions, but lots of AMO4 oxides transform from zircon or scheelite structures to M′-fergusonite and M′-fergusonite under pressure.
Among these, the wolframite structure AMO4 (where A denotes transition metal ions and M denotes divalent cations) is particularly notable. Copper oxides (CuMO4, with M = W, Mo) are important inorganic materials that have gained enormous scientific importance due to their wide range of applications, including optical fibers, scintillator materials, industrial catalysts, microwave applications, humidity sensors, and photoluminescent materials, as well as their magnetic, electric, and electrochemical properties.1–7 Among the molybdates, the CuMoO4 compound exhibits highly complex polymorphism.8–11 To date, six different polymorphs of CuMoO4 have been identified in the literature: namely ambient condition α-CuMoO4 (green phase),8 high-temperature β-CuMoO4,9 low-temperature γ-CuMoO4 (brownish red phase),10 high pressure (HP) CuMoO4-II,11 distorted wolframite CuMoO4-III,12 and monoclinic ε-CuMoO4.13 Both the compounds CoMoO4-II and CuMoO-III are isostructural to the tungstates CoWO4 and CuWO4, respectively.14
Additionally, copper tungstate (CuWO4) is regarded as a superior material for creating the positive electrodes of rechargeable Li batteries15 and for synthesizing W–Cu pseudo alloys with a copper content of 10–35 mol%, which are almost free of pores.15
However, there are still a lot of unanswered questions regarding the physical properties of CuMO4 (M = W, Mo).
A comprehensive examination of the literature revealed that there have been no reports on the electrical properties of α-CuMoO4 and CuWO4. In order to correlate these characteristics to the structural aspects of these materials, we consequently decided to record the electrical and dielectric properties as a function of frequency and temperature. Additionally, this study could provide important information about the conduction process and the electrical conductivity of the material.
2. Experimental methods
2.1. Synthesis procedure
In a standard process, polycrystalline CuMO4 (M = W, Mo) powder samples were synthesized via the conventional solid-state reaction by mixing high-purity precursors of CuO (Sigma-Aldrich, ≥99%), MoO3 (Sigma-Aldrich, ≥99%), and WO3 (Sigma-Aldrich, ≥99%).In the first step, the starting precursors were mixed in stoichiometric quantities and meticulously ground in an agate mortar initially, sealed in platinum crucibles, and then heated at 773 K for 16 h. After heat treatment, the samples were ground up and then reheated again between 923 K and 1023 K to ensure homogeneity, as summarized in Table 1. Afterward, the reaction products were cooled at a rate of 393 K h−1 to room temperature.
| Sample | Precursors | Synthesis | Color |
|---|---|---|---|
| CuWO4 | CuO, WO3 | 773 K/16 h, 1023 K/10 h | Light yellow |
| α-CuMoO4 | CuO, MoO3 | 773 K/16 h, 923 K/14 h | Green |
Finally, the colors of these synthetic samples, which varied depending on the metal used, were in accordance with those revealed in the literature, as shown in Table 1.
Note that the following stages are sequentially reached with increasing sintering temperature: the formation of isthmuses between the grains, a compaction of grains, and finally, their growth.
The crystallization and purity of these phases were determined by X-ray diffraction (XRD) of the powder. Then, based on the Rietveld method, the data collected at room temperature were analyzed by the Fullprof software. Differential scanning calorimetric analysis was carried out using a DSC (Q-100) TA instrument with a scanning rate of 10 °C min−1 between 283 K and 483 K in temperature. To carry out the electrical measurements, the powder resulting from the grinding process was shaped into a pellet (8 mm in diameter and 1.1 mm in thickness) in a uniaxial hydraulic press at a pressure of 3 tons per cm2. The measurements were performed using a 1260 Solartron Impedance Analyzer under vacuum, operating in the temperature range of 443 K to 563 K.
3. Results and discussion
3.1. Crystalline parameters
The purity of the synthesized compounds and their crystalline characteristics were determined through XRD patterns recorded at room temperature. Fig. 1(a) and (b) illustrates the experimental and calculated XRD profiles of the compounds α-CuMoO4 and CuWO4, respectively, as well as the corresponding discrepancies. The full pattern refinement was analyzed by the Rietveld method using the Fullprof program. The lattice parameters and the P![[1 with combining macron]](https://www.rsc.org/images/entities/char_0031_0304.gif) space group reported in the bibliographic data were used as the starting point.8,16 All the Bragg peaks were successfully indexed and satisfactorily modeled. The quality factors that show good agreement between the experimental (red dots) and calculated (black solid line) profiles are χ = 4.02 and χ = 3.1 of the compounds α-CuMoO4 and CuWO4, respectively. Indeed, we could notice the presence of a small extra peak identified by an asterisk in the X-ray powder pattern (Fig. 1a) of α-CuMoO4, indicating the presence of a secondary phase of MoO3 in the vicinity of 2%, which crystallizes in the orthorhombic system.17 The unit cell parameters of MoO3 are reported by Nora Wooster (2015).
space group reported in the bibliographic data were used as the starting point.8,16 All the Bragg peaks were successfully indexed and satisfactorily modeled. The quality factors that show good agreement between the experimental (red dots) and calculated (black solid line) profiles are χ = 4.02 and χ = 3.1 of the compounds α-CuMoO4 and CuWO4, respectively. Indeed, we could notice the presence of a small extra peak identified by an asterisk in the X-ray powder pattern (Fig. 1a) of α-CuMoO4, indicating the presence of a secondary phase of MoO3 in the vicinity of 2%, which crystallizes in the orthorhombic system.17 The unit cell parameters of MoO3 are reported by Nora Wooster (2015).
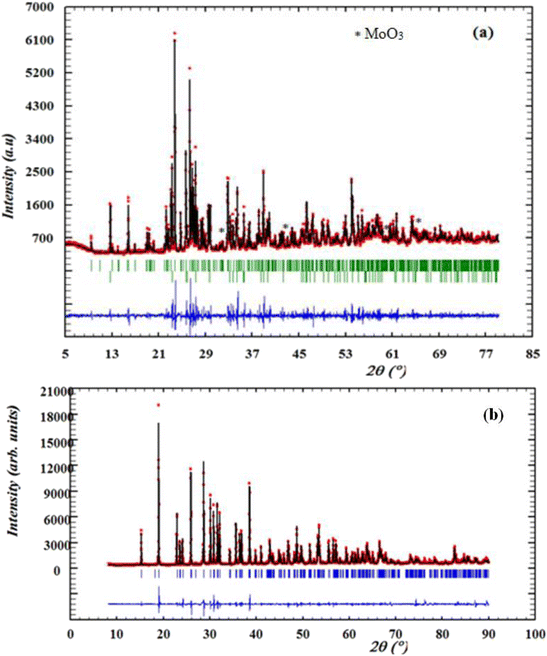 | ||
| Fig. 1 X-ray diffraction patterns and Rietveld refinement of α-CuMoO4 (a) and CuWO4 (b) samples recorded at room temperature. | ||
The estimation results of the structural parameters are illustrated in Table 2. These results are in good agreement with the literature.8,16 This study demonstrated that the system and crystal structure could be changed by switching the divalent cation (from W+ to Mo+).
| Formula | α-CuMoO4 | CuWO4 |
|---|---|---|
| Unit lattice parameters (Å) | a = 6.789229 (5) | a = 4.7060 (4) |
| b = 8.37269 (3) | b = 5.8415 (5) | |
| c = 9.906073 (4) | c = 4.8817 (4) | |
| α = 96.892°, β = 107.009°, γ = 101.132° | α = 91.881°, β = 92.497°, γ = 82.785° | |
| Unit cell volume (Å3) | V = 568.70 (2) | V = 136.89 (3) |
| Crystal system | Triclinic | Triclinic |
| Space group | P![[1 with combining macron]](https://www.rsc.org/images/entities/char_0031_0304.gif) |
P![[1 with combining macron]](https://www.rsc.org/images/entities/char_0031_0304.gif) |
| Rexp (%) | 10.66 | 06.2 |
| Rp (%) | 22.00 | 1.77 |
| Rwp (%) | 23.08 | 1.53 |
| χ2 | 4.02 | 3.1 |
3.2. Structural description
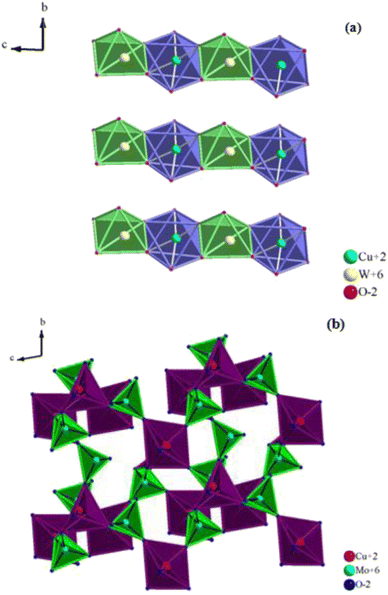
The structure of CuWO4 is implied in Fig. 2a. In this structure, the copper atom is surrounded by six oxygen atoms, four of which have an approximately square planar configuration and the remaining two have a longer bond distance, providing an elongated octahedron. The tungsten atom is located within a slightly distorted octahedron but is considerably displaced from its center.The WO6 and CuO6 octahedra are connected by their corners, and the CuO6 octahedra exhibit an elongated pseudo-tetragonal geometry due to the Jahn–Teller effect of the Cu2+ cation.16,18 It is clear from the figure that although CuWO4 is triclinic, its structure is topologically related to that of monoclinic wolframite (P2/c). The W–O distances of the WO6 octahedra are slightly distorted, similar to those of wolframite, and range from 1.79 Å to 2.20 Å.
Nevertheless, the monoclinic P2/c symmetry is lowered to the triclinic P![[1 with combining macron]](https://www.rsc.org/images/entities/char_0031_0304.gif) symmetry due to the Cu2+ Jahn–Teller effect, which decreases the degeneracy of the 3D orbitals.18
symmetry due to the Cu2+ Jahn–Teller effect, which decreases the degeneracy of the 3D orbitals.18
As a result, the CuO6 octahedra adopt an elongated pseudo-tetragonal geometry with two axial Cu–O distances near 2.50 Å and four planar Cu–O distances at 1.93 Å.
Additionally, the alternating CuO6 and WO6 octahedra form endless zigzag chains by sharing the edges of copper and tungsten atoms in the CuWO4 sequence of layers that are located between the oxygen sheets. In contrast, as illustrated in Fig. 2b, the α-CuMoO4 structure can be characterized by MoO4 tetrahedra, CuO5 square pyramidal polyhedra, and CuO6 distorted octahedra, which are joined by common corners and edges to create layers. For octahedrally coordinated CuO6, the average Cu–O distances in the α-CuMoO4 range from 1.94 Å to 2.53 Å. However, for pyramidal CuO5 (C4v) they vary from 1.90 Å to 2.53 Å, while the Mo–O bond distances range from 1.74 Å to 2.38 Å.
It is important to note that the symmetry elements and the relative positions of the atoms distinguish the difference between the structures of CuWO4 and α-CuMoO4. This appears to be caused, most probably, by the potent Jahn–Teller effect present in CuO6 octahedra, which causes a significant elongation. Also, the geometry of the MO6 (M = W, Mo) and CuO6 octahedra and their connection have a significant impact on the band gap as well as the associated optical, electrical, and magnetic properties.
3.3. Thermal analysis
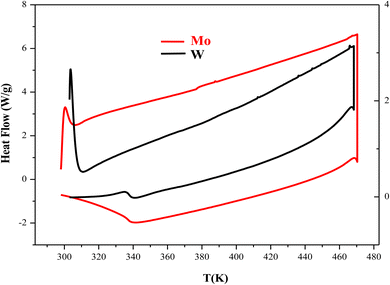
Differential scanning calorimetry is typically used to examine the thermal transformation of a material, such as crystallization, transition to glass, melting, etc. To prevent the material from reacting with the atmosphere, this analysis was carried out under a supply of an inert gas (nitrogen). The results of the thermal analysis (DSC) for the CuMO4 (M = W, Mo) samples in the heating temperature range of 283 K to 483 K and with a ramp rate of 10 °C min−1 are displayed in Fig. 3. We notice that this study shows that no exothermic or endothermic peaks are displayed in the temperature range studied, which can be attributed to the absence of structural transitions in the two compounds.3.4. Electrical properties
Indeed, the complex impedance Z* is divided into its real part Z′ and its imaginary part Z′′:
| Z* = Z′(w) − jZ′′(w) | (1) |
Fig. 4(a), (b) and 5(a), (b) depict the Cole–Cole plot of the typical complex impedance plane for CuMO4 (M = W, Mo) samples at a temperature interval ranging from 443 K to 563 K. It is worth noting that the centers of the depressed semicircles are located below the real axis, indicating that both materials exhibit non-Debye behavior.19
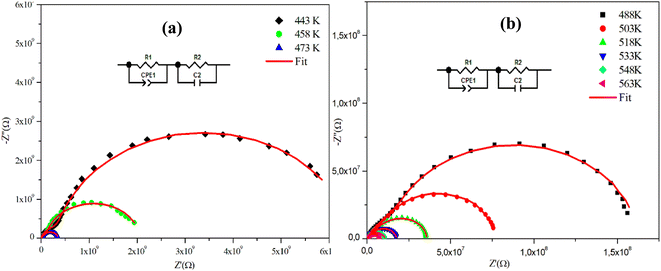 | ||
| Fig. 4 (a) and (b) Complex impedance spectra in the Nyquist plane with an electrical equivalent circuit (inset), accompanied by theoretical data (solid line) for α-CuMoO4. | ||
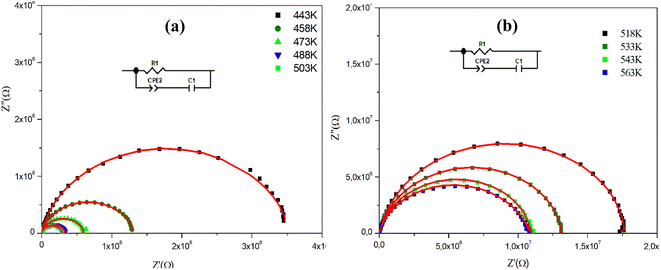 | ||
| Fig. 5 (a) and (b) Nyquist diagram spectra as a function of temperature and the electrical equivalent circuit (inset) of the CuWO4 compound. | ||
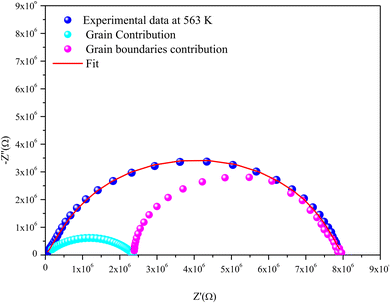
For the Mo-based compound, the experimental data showed the existence of two semi-circles, each placed within a different frequency domain, indicating the presence of two contributions. The high-frequencies semicircle is attributed to the grain effect and the other at low frequencies is attributed to the effect of the grain boundary.20 On the other hand, to visualize these two contributions (grains and grain boundary elements), we performed a deconvolution of the Nyquist curve recorded at T = 563 K (Fig. 6).
Actually, we can distinguish between the two contributions by looking at the resistance value provided by the adjustment; the arc with the lowest resistance value is attributed to the effect of the grain, whereas the other is attributed to the grain boundary effect. The higher resistivity of the grain boundary is reflected in the increased arc dispersion at low frequencies.
Based on the ZView software,21 the −Z′′ = f(Z′) plots were adjusted by an equivalent electrical circuit formed by a resistance (Rg) parallel to the fractal capacitance (CPEg) describing the response of the grains in series with a resistance (Rgb) parallel to the capacitance (Cgb) describing the grain boundary (inset of Fig. 4).
Whereas, for the W-based compound, these spectra are composed of a single semi-circular arc at each temperature suggesting the dominance of the grain contribution.
The spectra were adequately modeled by a single-cell circuit model, formed by a resistance (Rg) in parallel with the series combination (Cg and CPEg) as depicted in the inset of Fig. 5.
In this model, Rg introduces the resistance, Cg represents the capacitance, and CPEg is the non-ideal capacitor usually known as the constant phase element.
Furthermore, we observe that according to Fig. 4 and 5, the radii of the semicircles decrease with increasing temperature in the Cole–Cole plot, suggesting that the conduction mechanism is thermally activated. The latter is known as the negative temperature coefficient of resistance (NTCR), which is a characteristic of semiconductor compounds.22
Indeed, it is important to note that the non-ideal Debye behavior and the observed depression of the semicircles are both explained by the presence of a constant phase element (CPE) in these equivalent circuit models.23
The impedance of the CPE contribution is an empirical function of the following type:
 | (2) |
The frequency behavior of the complex impedance parts (−Z′′) of the α-CuMoO4 and CuWO4 samples, for distinct temperatures, is displayed in Fig. 7(a), (b) and 8(a), (b), respectively.
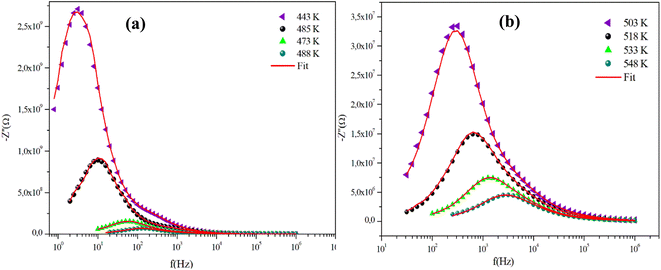 | ||
| Fig. 7 (a) and (b) Variations of the experimental and calculated imaginary parts of impedance (−Z′′) as a function of frequency at some representative temperatures for α-CuMoO4. | ||
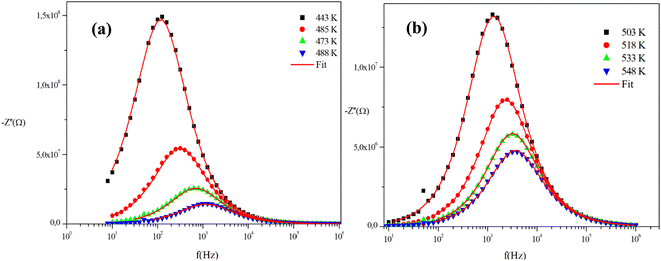 | ||
| Fig. 8 (a) and (b) Variations of the experimental and calculated imaginary parts of impedance (−Z′′) as a function of frequency at several temperatures for the CuWO4 compound. | ||
The spectra explicitly describe the strength and the position of the relaxation peak which is found to be different for several sintering temperatures. We can observe that the impedance plots are characterized by the presence of maximum peaks ( ) at a specific frequency known as the relaxation frequency, fmax. The relaxation peak shifts to very high frequencies as the temperature rises. These findings demonstrate the presence of the electrical relaxation phenomenon, characterize its nature, and highlight its strength in our material.24,25 As temperatures increase, a significant broadening of the asymmetric peaks is observed, indicating a temperature-dependent relaxation process in the system that lengthens the relaxation period (as depicted by the increased width of the peaks). This may be explained by the fact that the relaxation process is caused by defects or vacancies at high temperatures, while immobile species or electrons are accountable at low temperatures.26,27
Additionally, the height of the relaxation peaks is also impacted in addition to peak broadening. As the temperature rises, the height of the relaxation peaks declines, suggesting a loss of resistive characteristics. It also suggests the existence of a relaxing process that is initiated by heat and implies that the relaxation mechanism is thermally stimulated.
Finally, for all temperatures and for higher frequencies, the imaginary part of −Z′′ is merged, which probably indicates an accumulation of space charges in the system. There was also a perfect superposition between the experimental scatter data and the theoretical line for these curves.
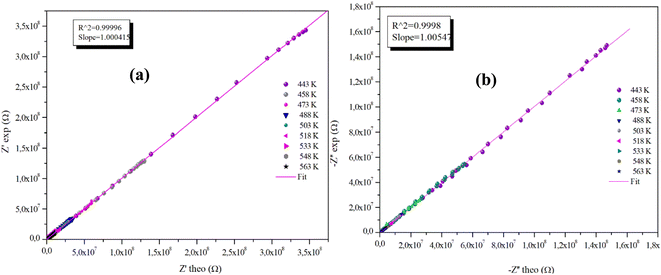
The advantageous justification for the choice of the equivalent circuit retained is verified by the variations of the experimental values of (Z′) and (−Z′′) according to those calculated using the parameters of the equivalent circuit model at different temperatures (Fig. 9(a), (b) and 10(a), (b)). It is clear from these graphs that the slope produced by a linear fitting of the data points at all temperatures is almost equal to the unit. This behavior leads us to the conclusion that the chosen equivalent circuit accurately describes the electric characteristics of the samples and that there is a good correlation between the theoretical (calculated line) and experimental data (scatter) of the real and imaginary impedance parts.
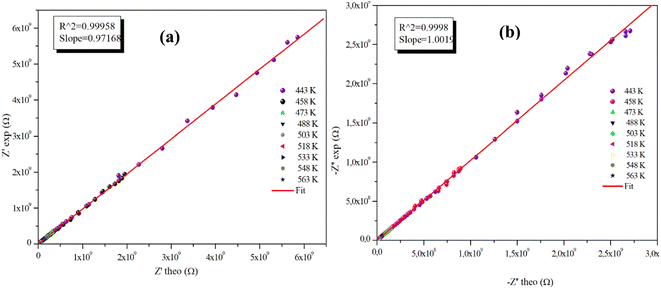 | ||
| Fig. 9 (a) and (b) Plots of measured values versus simulated values of the real and imaginary parts of the impedance for the α-CuMoO4 compound. | ||
3.5. Conductivity studies
 | (3) |
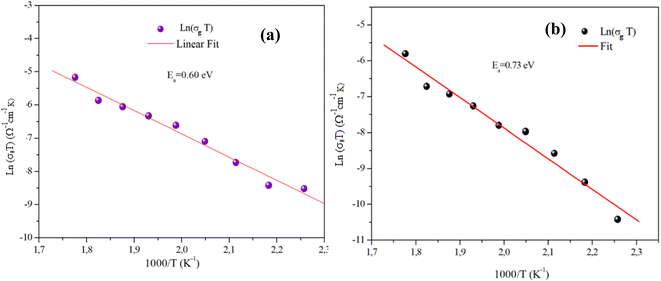
Fig. 11(a) and (b) displays the conductivity (σg) of the α-CuMoO4 and CuWO4 samples in a temperature range of 443 K to 563 K, at a constant voltage of 1.5 V. These curves clearly demonstrate that the response of Ln (σg T) versus 1000/T represents a straight line or a continuity of the curve slope, indicating the absence of a phase transition in these samples over the temperature range studied, which was verified by the DSC diagram (Fig. 3).
Indeed, as can be seen from the graph, the Dc conductivity rises linearly over the entire temperature range as a result of an increase in the number of charge carriers that are made available by the increase in thermal energy. This is due to the thermally assisted tunneling of charge carriers in the band tail of the localized,29 which leads to the Arrhenius equation:
 | (4) |
Table 3 presents a comparison between the electrical properties of CuWO4 and α-CuMoO4. The table shows that α-CuMoO4 has a higher conductivity due to its lower activation energy Ea,g. The influence of structural features on the conductivity and activation energy of each phase can be deduced from these data. For the α-CuMoO4 compound, the highest conductivities and the lowest Ea,g are correlated with the better mobility of the Mo cation in the corresponding frameworks. In fact, the greater Mo–O bond distances (1.74 Å–2.38 Å) compared to those of W–O (1.79 Å–2.20 Å) result in a weakening of the attraction between Mo+ and O2 and a release of the ion attachment to the crystal, which lowers the potential barrier and requires a lower activation energy, thereby increasing conductivity. In addition, it is also associated with the dimension of the tunnels in α-CuMoO4.
| Formula | α-CuMoO4 | CuWO4 |
|---|---|---|
| Ea,g (eV) | 0.60 | 0.73 |
| W–O (Å) | — | 1.79–2.20 |
| Mo–O (Å) | 1.74–2.38 | — |
| σ503 K (Ω−1 cm−1) | 2.6474310−6 | 8.10010−7 |
| A (Ω−1 cm−1 K) | 2627.474 | 2262.84 |
On the other hand, it appears that the conductivity of α-CuMoO4 is slightly higher than that of the CuWO4 compound, which is due to the smaller mass and ionic radius of molybdenum (mMo = 1.59310−22 g, rMo+ = 0.59 Å) compared to tungsten (mW = 3.052 10−22 g, rW+ = 0.60 Å) and consequently it is more mobile than W+.
Additionally, the large value of the pre-exponential factor, which is proportional to the density of the charge carriers and the disorder within the material, can also be used to explain the increase in conductivity of the compound of α-CuMoO4.
Indeed, the pre-exponential factor obtained thanks to the Arrhenius parameterization law is given by:30
 | (5) |
 | (6) |
The variation of the AC conductivity of CuMO4 (M = Mo, W) samples at different temperatures is shown in Fig. 12(a) and (b). These spectra are described by two regions and are theoretically analyzed using Jonscher's universal power law:31,32
| σac(ω) = σdc + Aωs | (7) |
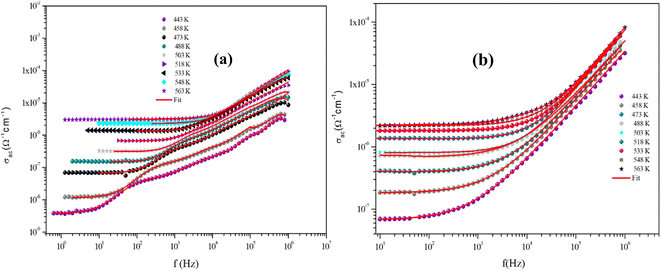 | ||
| Fig. 12 Dependence of AC conductivity on the frequency at specific temperatures for α-CuMoO4 (a) and CuWO4 (b). | ||
As is evident from the conductivity plots, two distinct regions can be observed at low and high frequencies. In the low-frequency range, the conductivity spectra exhibit nearly constant values, indicating that the charge transport can be described by a hopping model, as defined by the first term of the Jonscher equation. Ions successfully hop from one site to an adjacent vacancy in this area, causing long-range transitional motion of the ions, which contributes to the direct conductivity.
In contrast, the second part of the equation can be used to determine the asymptotic form of the conductivity, often referred to as the dispersive regime, at high frequencies.
This dispersion could be connected to the anticipated behavior of space charges, given that their influence diminishes with increasing temperatures and frequencies.33 The proposed spectra demonstrate that this is not always the case, since there are curves for which the increase is not observed, indicating the presence of space charges even at high frequencies.
In addition, we observed that the AC conductivity rises in tandem with temperature. Given that electrical conduction in the ceramic system is a thermally stimulated process, this indicates that a greater number of free charge carriers are generated at high temperatures, which promotes enhanced conductivity and suggests the properties of the semiconductor.34
In fact, eqn (6) can be mentioned by the Almond–West relation:35
 | (8) |
 | (9) |
Fig. 13(a) and (b) reveals the plot of Ln (ωh) as a function of (1000/T) relative to the conduction of grains for α-CuMoO4 and CuWO4 compounds, respectively. It represents the continuity of the curve slope, referring to the absence of a phase transition within these samples at the studied temperature range. This was confirmed by the DSC (Differential Scanning Calorimetric) diagram.
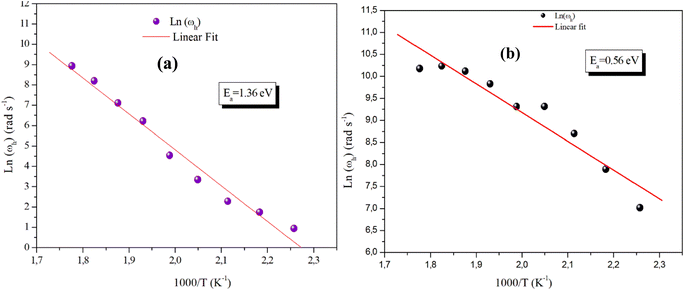 | ||
| Fig. 13 Plot of hopping frequency ωh against 1000/T for the compound α-CuMoO4 (a) and for CuWO4 (b). | ||
These evolving processes exhibit an Arrhenius-like behavior with activation energies determined from a straight-line adjustment of the data points, roughly equal to Ea,g = 1.36 eV for the Mo-based compound and Ea,g = 0.56 eV for the W-based compound. In fact, these results differ from those found recently on the DC conductivity of grains (σg), demonstrating that the mobility of charge carriers in the studied compounds is not ensured by a straightforward hopping mechanism.36
A suggested approach to understand the charge transfer mechanism in CuMO4 (M = W, Mo) can be constructed by considering several theoretical models based on the behavior of s (T) with temperature.
According to the literature, various models have been proposed, such as the non-overlapping small polaron tunneling (NSPT) model put forth by Long,37 the overlapping large polaron tunneling (OLPT) model proposed by Long,38 the quantum mechanical tunneling (QMT) model put forth by Austin–Mott,39 and the correlated barrier hopping (CBH) model, as introduced by Elliot.40,41 These diverse conduction models are based on two distinct processes: the quantum mechanical tunneling effect and the classical hopping of charge carriers across a barrier, or a combination of the two. Additionally, various hypotheses have been made about the atoms or electrons (or polarons) accountable for serving as carriers.
In this context, the variations of the exponent (s) with temperature in our systems are illustrated in Fig. 14(a) and (b).
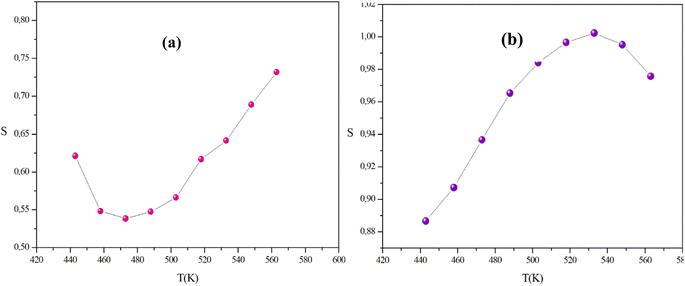 | ||
| Fig. 14 The variation of the universal exponent s with the temperature of the α-CuMoO4 (a) and CuWO4 (b) samples. | ||
In the temperature range of 443 K to 533 K, the parameter (s) for CuWO4 shows an increase with temperature, indicating the presence of a correlated barrier hopping (CBH) mechanism. However, within the temperature range of 548 K to 563 K, the exponent (s) displays a tendency to decrease with rising temperatures. Therefore, this result suggests that the non-overlapping small polaron tunneling (NSPT) model is a suitable mechanism to characterize electrical conduction. For α-CuMoO4, the asymptotic patterns of ‘s’ decrease with increasing temperature, establishing a minimum at 473 K, then they start to increase with rising temperatures. Therefore, the OLPT model appears to be the most suitable model for characterizing the electrical conduction mechanism in the studied compound.
3.6. Complex modulus analysis
The electrical relaxation characteristics occurring in materials are frequently justified using the electrical modulus formalism.42 The electrode polarization and the relaxation frequency of conductivity are displayed by electrical modulus analyses. This formalization provides a more comprehensive understanding of charge transport processes, including conductivity relaxation, ion dynamics as a function of temperature and frequency, and the electrical transport mechanism. This formalism is complementary to the conductivity study.In fact, the dielectric modulus (M*) is defined as:
 | (10) |
Fig. 15(a) and (b) shows the variation of the imaginary part of the modulus (M′′), as a function of frequency for the two title compounds in the measured temperature range (443 K–563 K).
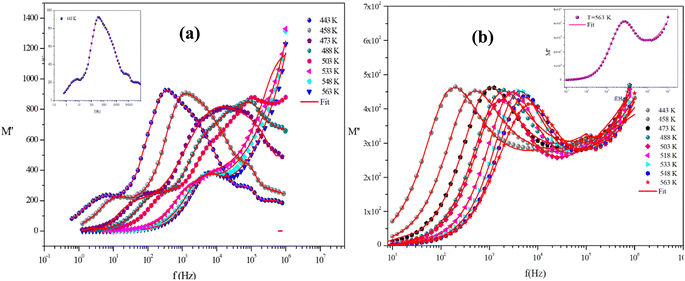 | ||
| Fig. 15 The imaginary parts of the electric modulus as a function of frequency at several temperatures of α-CuMoO4 (a) and CuWO4 (b). | ||
For the Mo-based compound, this graph displays two asymmetric relaxation peaks for each temperature. The influence of the grain boundary is demonstrated by the tiny peak observed at low frequencies. Whereas, the second peak found at high frequencies is connected to the relaxation process of grains. In contrast, for the W-based compound, these plots show the appearance of a single peak in the modulus spectra, confirming the single relaxation phenomenon of the material studied. These results are in good agreement with those of the Nyquist plots.
Furthermore, it is evident that the illustrations of these figures reveal that the charge carriers are mobile over long distances in the frequency range below the maximum peak  . The area above is where charge carriers are spatially connected to potential wells and are only capable of localized motion within these wells while maintaining their mobility over short distances.
Additionally, the presence of these peaks in the modulus spectra explains the conductivity relaxation processes. With rising temperatures, the relaxation peak moves up to a higher frequency spectrum. The relaxation process is thus temperature-dependent and this indicates a correlation between the movement of the mobile ions as the temperature increases.
In fact, the charge carriers become more accelerated and thermally active. This results in a decrease in the relaxation time, an increase in the relaxation frequency, and a shift in the frequency of the relaxation peaks.43 This behavior assumes that the jumps of the charge carrier are taken into account and that the relaxation depends on the temperature.
Added to this, at lower frequencies, the values of the imaginary parts of M′′ approach zero, showing that the electrode effect can be neglected in the modulus representation.
On the other hand, the temperature dependency of the characteristic relaxation frequency fp is plotted in Fig. 16(a) and (b). It is clear that the relaxation frequency satisfies the Arrhenius law given by the following equation:
 | (11) |
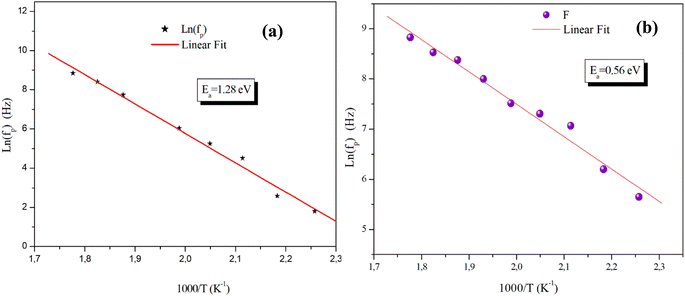 | ||
| Fig. 16 Temperature dependence of the relaxation frequency fp for the grains of α-CuMoO4 (a) and CuWO4 (b). | ||
The activation energies derived from Ln(σgT) = f (1000/T) and (Ln![[thin space (1/6-em)]](https://www.rsc.org/images/entities/char_2009.gif) fp) = f (1000/T) for the two title compounds are grouped in Table 4. It can be seen that the values of the activation energies obtained from the relaxation frequency and those obtained from the conductivity are different for the α-CuMoO4 sample. This means that there is a partial blocking of the movements of the charge carriers by the grain boundaries.44 However, the latter has a significant impact on the total conductivity values of the material.
fp) = f (1000/T) for the two title compounds are grouped in Table 4. It can be seen that the values of the activation energies obtained from the relaxation frequency and those obtained from the conductivity are different for the α-CuMoO4 sample. This means that there is a partial blocking of the movements of the charge carriers by the grain boundaries.44 However, the latter has a significant impact on the total conductivity values of the material.
| Sample | Ln(σg T) | Ln(fp) |
|---|---|---|
| CuWO4 | Ea = 0.73 eV | Ea = 0.56 eV |
| α-CuMoO4 | Ea = 0.60 eV | Ea = 1.28 eV |
Contrarily, in the case of the compound based on tungsten, the activation energy estimated from the relaxation frequency is very close to that obtained from the conductivity. This observation demonstrates that the total conductivity is equal to the grain conductivity rather than being influenced by the grain boundaries. This proves that conduction and relaxation are ensured by the same mechanism in the material.
4. Conclusions
Briefly, our study examined the impact of replacing tungsten (rW+ = 0.60 Å) with molybdenum (rMo+ = 0.59 Å) on both the structural and electrical properties. Initially, we prepared powders of CuMoO4 and CuWO4 using a solid-state reaction method. The XRD diffractograms demonstrate that both CuMoO4 and CuWO4 crystallize in the triclinic system with the same space group P![[1 with combining macron]](https://www.rsc.org/images/entities/char_0031_0304.gif) . From a structural standpoint, it is important to note that the replacement of tungsten with molybdenum results in a significant change in the lattice parameters, the volume, the distances between W and Mo, and the angles. Thermal analysis indicates the absence of any exothermic or endothermic peaks within the temperature range of 283 K to 483 K, which can be attributed to the absence of structural transitions in the two titled compounds.
. From a structural standpoint, it is important to note that the replacement of tungsten with molybdenum results in a significant change in the lattice parameters, the volume, the distances between W and Mo, and the angles. Thermal analysis indicates the absence of any exothermic or endothermic peaks within the temperature range of 283 K to 483 K, which can be attributed to the absence of structural transitions in the two titled compounds.
An equivalent circuit for the electrochemical cell with both compounds has been proposed.
Furthermore, the study of dc conductivity implies that Mo+ conduction is preferable to W+ conduction as a result of its small mass and small ionic size. Additionally, it has been discovered that at various temperatures, the ac conductivity spectra response follows the Jonscher's power law. The variations of the exponent ‘s’ as a function of temperature confirm that the charge transport mechanisms can be described by the non-overlapping small polaron tunneling (NSPT) model, the correlated barrier hopping (CBH) model for the sample of CuWO4, and the OLPT approach for α-CuMoO4. Eventually, the temperature variation of the M′′ peak showed a thermally activated relaxation process.
Conflicts of interest
There are no conflicts to declare.Acknowledgements
The authors extend their appreciation to the Deanship of Scientific Research at King Khalid University for funding this work through a small group Research Project under grant number RGP.1/41/44.References
- W. Xiusheng, F. Chao, C. Jufang, G. Chunye and L. Wei, Effect of W doping on phase transition behavior and dielectric relaxation of CuMoO4 obtained by a modified sol-gel method, Mater. Res. Express, 2020, 7, 016309 CrossRef
.
- K. Seevakan, Structural, morphological and magneto-optical properties of CuMoO4, electrochemical nanocatalyst as supercapacitor electrode, Ceram. Interfaces, 2018, 44, 20075–20083 CrossRef CAS
.
- G. Steiner, R. Salzer and W. Reichelt, Temperature dependence of the optical properties of CuMoO4 Fresenius, J. Anal. Chem., 2001, 370, 731–734 CAS
.
- N. Joseph, Glass-free CuMoO4 ceramic with excellent dielectric and thermal properties for ultralow temperature cofired ceramic applications, ACS Sustainable Chem. Eng., 2016, 4, 5632–5639 CrossRef CAS
.
- M. Naja, A. Abbasi, M. M. Farahani and V. H. Rodrigues, Synthesis, characterization and crystal structure of a copper molybdate coordination polymer as an epoxidation catalyst, Inorg. Chim. Acta, 2015, 433, 21–25 CrossRef
.
- D. Dongwei, R. Lan, X. Wei, B. Richard, W. Huanting and T. Shanwen, Preparation of a hybrid Cu2O/CuMoO4 nanosheetelectrode for high-performance asymmetric supercapacitors, J. Mater. Chem. A, 2016, 4, 17749–17756 RSC
.
- H. Ehrenberg, H. Weitzel, J. Garcia-Jaca, F. Rodrıguez and D. Hernandez, Optical study of the piezochromic transition in CuMoO4 by pressure spectroscopy, Phys. Rev. B: Condens. Matter Mater. Phys., 2000, 61, 16497 CrossRef
.
- M. Benchikhi, Characterization and photoluminescence properties of ultrafine copper molybdate(α-CuMoO4) powders prepared via a combustion-like process, Int. J. Miner., Metall. Mater., 2016, 23, 1340–1345 CrossRef CAS
.
- R. Kohlmuller and J. P. Faurie, Etude des systemes MoO3–Ag2MoO4 et MoO3–MO (MCu, Zn, Cd), Bull. Soc. Chim. Fr., 1968, 11, 4379–4382 Search PubMed
.
- H. Ehrenberg, H. Weitzel, H. Paulus, M. Wiesmann, G. Wltschek, M. Geselle and H. Fuess, Crystal structure and magnetic properties of CuMoO4 at low temperature (-phase), J. Phys. Chem. Solids, 1997, 58, 153–160 CrossRef CAS
.
- A. W. Sleight, High Pressure CuMoO4, Mater. Res. Bull., 1973, 8, 863–866 CrossRef CAS
.
- R. Tali, V. V. Tabachenko, L. M. Kovba and L. N. Dem Õyanets, Kristallicheskaya struktura CuMoO4, Zh. Neorg. Khim., 1991, 36, 1642–1644 CAS
.
- J. Baek, A. S. Sefat, D. Mandrus and P. S. Halasyamani, A New Magnetically Ordered Polymorph of CuMoO4: Synthesis and Characterization of ε-CuMoO4, Chem. Mater., 2008, 20, 3785–3787 CrossRef CAS
.
- H. Ehrenberg, M. Wiesmann, J. Garcia-Jaca, H. Weitzel and H. Fuess, Magnetic structures of the high-pressure modifications of CoMoO4 and CuMoO4, J. Magn. Magn. Mater., 1998, 182, 152–160 CrossRef CAS
.
- O. Yu. Khyzhun, V. L. Bekenev and Yu. M. Solonin, First-principles calculations and X-ray spectroscopy studies of the electronic structure of CuWO4, J. Alloys Compd., 2009, 480, 184–189 CrossRef CAS
.
- J. Ruiz-Fuertes, D. Errandonea, A. Segura, F. J. Manjón, Zh. Zhu and C. Y. Tu, Growth, characterization, and high-pressure optical studies of CuWO4, High Pressure Res., 2008, 28, 565–570 CrossRef CAS
.
- N. Wooster, The crystal structure of Molybdenum Trioxide, MoO3, Zeitschrift für Kristallographie, Cryst. Mater., 2015, 18, 504–5012 Search PubMed
.
- J. B. Forsyth, C. Wilkinson and A. I. Zvyagin, The antiferromagnetic structure of copper tungstate, cuwo, J. Phys.: Condens. Matter, 1991, 3, 8433–8440 CrossRef CAS
.
- M. Mumtaz, M. Naveed, B. Amin, M. Imran and M. N. Khan, Temperature dependent impedance spectroscopy of (Co3O4) x/CuTl-1223 nanoparticles-superconductor composites, Ceram. Int., 2018, 44, 4351–4359 CrossRef CAS
.
- K. Karoui, A. B. Rhaiem and F. Jemni, Li2M(WO4)2 (M = Ni, Cu, Co): electrical, thermal, and optical properties, Ionics, 2021, 27, 1511–1524 CrossRef CAS
.
- D. Johnson, ZPlot, ZView Electrochemical Impedance Software, Version 2.3b, Scribner Associates, Inc., North Carolina, 2000 Search PubMed
.
- I. Dakhlaoui, K. Karoui, F. Hajlaoui, M. Zaghrioui, N. Audebrand, M. Dallone and F. Jomni, A new supramolecular semiconductor palladium (II) complex [(CH3)3N(CH2)3Br]2Pd2Cl6: structural study, optical and electrical properties, New J. Chem., 2023, 47, 8042–8049 RSC
.
- N. Chakchouk, K. Ben Brahim, M. Ben Gzaiel and A. Oueslati, Investigation of optical and electrical properties of the semiconducting α-KZnPO4 compound, RSC Adv., 2022, 12, 6831–6840 RSC
.
- S. Kour, H. Mahajan and R. Mukherjee, Influence of sintering temperature on impedance and modulus spectroscopy of nickel-substituted cobalt ferrite, J. Mater. Sci.: Mater. Electron., 2023, 34, 594–608 CrossRef CAS
.
- M. M. Rahman, N. Hasan, M. A. Hoque, M. B. Hossen and M. Arifuzzaman, Results Phys., 2022, 38, 105610 CrossRef
.
- B. N. Parida, R. D. Piyush, R. Padhee and R. N. P. Choudhary, Synthesis and chracterization of a tungsten bronze ferroeletcric oxide, Adv. Mater. Lett., 2012, 3, 231–238 CrossRef CAS
.
- L. Singh, L. Dhavala, R. Bhimireddi, A. A. Ansari, S. Kumar, V. Srivastava f, R. N. Rai, Q. V. Le and Y. Lee, Low-cost flame synthesized La2/3Cu3Ti4O12 electro-ceramic and extensive investigation on electrical, impedance, modulus, and optical properties, Cer. Inter., 2023, 49, 21795–21803 CrossRef CAS
.
- K. Karoui, A. Mahmoud, A. Ben Rhaiem and F. Boschini, Electrical and electrochemical properties of Li2M(WO4)2 (M = Ni, Co and Cu) compounds, RSC Adv., 2019, 9, 6785–6792 RSC
.
- M. Ganaie, S. Ahmad, S. Islam and M. Zulfequar, Dc, Ac Conductivity and Dielectric Analysis of SeTe Alloy, Adv. Sci. Lett., 2014, 20, 1360–1363 CrossRef
.
- B. Louati, F. Hlel and K. Guidara, J. Alloys Compd., 2009, 486, 299–303 CrossRef CAS
.
- A. K. Jonscher, Dielectric Relaxation in Solids, Chelsea Dielectric Press, London, 1983, p. 380 Search PubMed
.
- R. Ltaoui, A. Triki, S. Hcini, A. Oueslati, S. Zemni and O. Kanoun, Conduction mechanisms and complex impedance analysis in La0.6Sr0.4FeO3 ceramic, J. Electron., 2023, 50, 121–138 Search PubMed
.
- A. Q. Abdullah, Optical and structural investigation of synthesized PVA/Pb Snanocomposites, Chem. Mater. Res., 2015, 26, 6939–6944 Search PubMed
.
- R. N. Bhowmik and G. Vijayasri, J. Appl. Phys., 2013, 114, 223701–223708 CrossRef
.
- H. Nefzi, F. Sediri, H. Hamzaoui and N. Gharbi, Mater. Res. Bull., 2013, 48, 1978–1983 CrossRef CAS
.
- N. Chakchouk, B. Louati and K. Guidara, Electrical properties and conduction mechanism study by OLPT model of NaZnPO4 compound, Mater. Res. Bull., 2018, 99, 52–60 CrossRef CAS
.
- M. Dult, R. S. Kundu, S. Murugavel, R. Punia and N. Kishore, Phys. B, 2014, 452, 102–107 CrossRef CAS
.
- A. R. Long, Frequency-dependent loss in amorphous semiconductors, Adv. Phys., 1982, 31, 553–637 CrossRef CAS
.
- I. G. Austin and N. F. Mott, Polarons in crystalline and non-crystalline materials, Adv. Phys., 1969, 18, 41–102 CrossRef CAS
.
- S. R. Elliot, Adv. Phys., 1987, 36, 135–217 CrossRef
.
- M. Krimi, K. Karoui, J. J. Suñol and A. B. Rhaiem, Phase transition, impedance spectroscopy and conduction mechanism of Li0.5Na1.5WO4 material, Phys. E, 2018, 102, 37–145 CrossRef
.
- C. T. Moynihan, L. P. Boesch and N. L. Laberge, Decay function for the electric field relaxation in vitreous ionic conductors, J. Phys. Chem. Glas., 1973, 14122, 122–125 Search PubMed
.
- V. Thakur, A. Singh, R. Punia, S. Dahiya and L. Singh, J. Alloys Compd., 2017, 696, 529–537 CrossRef CAS
.
- C. H. Hervoches, M. C. Steil and R. Muccillo, Synthesis by the polymeric precursor technique of Bi2Co0. 1V0. 9O5. 35 and electrical properties dependence on the crystallite size, J. Solid State Sci., 2004, 6, 173–177 CrossRef CAS
.
| This journal is © The Royal Society of Chemistry 2024 |

