 Open Access Article
Microwave-assisted synthesis of silver nanoparticles as a colorimetric sensor for hydrogen peroxide†
Nurul Ismillayli ab,
Suprapto Suprapto
 *a,
Eko Santoso
 a,
Reva Edra Nugraha
 c,
Holilah Holilah
 d,
Hasliza Bahruji
 e,
Aishah Abdul Jalil
 fg,
Dhony Hermanto
 b and
Didik Prasetyoko
 a
a
aDepartment of Chemistry, Faculty of Science and Data Analytics, Institut Teknologi Sepuluh Nopember, Keputih, Sukolilo, Surabaya 60111, Indonesia. E-mail: suprapto@chem.its.ac.id
bDepartment of Chemistry, Faculty of Mathematics and Natural Sciences, University of Mataram, Mataram 83125, Indonesia
cDepartment of Chemical Engineering, Faculty of Engineering, Universitas Pembangunan Nasional “Veteran” Jawa Timur, Surabaya, East Java 60294, Indonesia
dResearch Center for Biomass and Bioproducts, National Research and Innovation Agency of Indonesia (BRIN), Cibinong, 16911, Indonesia
eCentre of Advanced Material and Energy Sciences, Universiti Brunei Darussalam, Jalan Tungku Link, BE 1410, Brunei
fCentre of Hydrogen Energy, Institute of Future Energy, Universiti Teknologi Malaysia, Skudai, Johor Bahru, Johor 81310, Malaysia
gDepartment of Chemical Engineering, Faculty of Chemical and Energy Engineering, Universiti Teknologi Malaysia, Skudai, Johor Bahru, Johor 81310, Malaysia
First published on 23rd February 2024
Abstract
To consider silver nanoparticles (AgNPs) as a colorimetric sensor for H2O2 we require investigation of the effects of the homogeneity of the nanoparticle size and morphology on the sensor parameters. Uniformly-sized Ag nanoparticles with diameters of ∼18.8 ± 2.8 nm were produced using microwave irradiation (AgNP1) but non-uniform particles with diameters of ∼71.2 ± 19.4 nm (AgNP2) were formed without microwave irradiation. Microwave synthesis produced AgNP1 with superiority in terms of repeatability, selectivity and sensor stability for up to eight months of storage over AgNP2. AgNP1 exhibited higher sensitivity and detection limits in the working range of 0.01–40000 μM as compared to AgNP2. The application of the AgNP sensor to milk samples provided recovery values of 99.09–100.56% for AgNP1 and 98.18–101.90% for AgNP2. Microwave irradiation resulted in strong and uniform PVP-Ag interactions for isotropic growth into small nanoparticles. Size and morphology uniformity determined the characteristics of the AgNP sensor that can be applied for H2O2 detection in a wide range of concentrations and real-time evaluation, with the potential for industrial applications.
Introduction
Hydrogen peroxide (H2O2) detection is an essential field in nanosensors for monitoring biological processes, cancer cell diagnostics, medical treatment, food safety, water treatment, and chemical analysis.1–5 H2O2 is an easily decomposed and relatively safe oxidant. However, when H2O2 comes in contact with living tissue, it can cause irritation, tissue damage, DNA damage, and other serious diseases.6–8 Prolonged exposure to H2O2 through contaminated food or drink further increases the risk. Aside from being a preservative in foods, such as raw milk, H2O2 can be produced in the presence of oxygen in beverages containing redox-active substances such as ascorbic acid (AA), calcium lactate, glucuronolactone, dextrose, and sodium citrate.9 Therefore, fast and accurate detection of H2O2 is required.AgNP nanosensors for H2O2 detection are often utilized as electrochemical sensors. AgNPs were designed as a working electrode for detecting H2O2 through catalytic redox reactions. The modification of AgNPs improved the sensitive and selective detection of H2O2. The Ag nanoparticle–reduced graphene oxide–polyaniline (AgNPs–rGO–PANI) nanocomposite enhanced the electron transfer rate during the electrochemical reduction of H2O2 due to interactions between Ag and nitrogen atoms in the PANI backbone polymer.10 Ag was modified with Cu to form a Ag–Cu alloy, enhancing the detection and quantification limits.11 The electrochemical sensor requires skills and expensive equipment to conduct the measurements. The development of colorimetric sensors offers a simple, fast, inexpensive, and convenient detection for practical applications.12,13 Colorimetric detection can be visually observed via color changes, excluding complex, expensive, and sophisticated equipment; therefore, it is suitable for on-site analysis.14,15 Generally, chromogenic compounds and color indicators are used in colorimetric sensors, but the application is restricted by toxicity and limited usage to a specific pH range.16–18 The plasmonic properties of silver nanoparticles (AgNPs) result in a characteristic color that is sensitive to the size and environment, which is ideal for the colorimetric detection of H2O2.20 Due to their intense surface plasma resonance (SPR) bands, AgNPs provide great sensitivity and superior selectivity as sensing agents.21,22 AgNP decomposition during catalytic oxidation with H2O2 exhibits SPR band reduction at 410 nm, which can be correlated with H2O2 concentration.23 In addition, AgNPs are stable under long-term storage, which is an important aspect of an indicator and sensing agent.19
Several AgNP-based H2O2 sensors with varying analytical properties have been developed.20,23–26 Variations in the synthesis method affect the shape, size, stability, and physicochemical properties of AgNPs.27 Zhang et al.28 reported that morphology affects the sensitivity and detection range of colorimetric sensing in H2O2 detection. The results generally indicated that the sensitivity depends on the size of AgNPs.29 Therefore, modifying the synthesis method for producing small AgNPs is advantageous for achieving high activity.
The effects of AgNP shape and size homogeneity on the sensor characteristics were investigated in H2O sensors obtained with and without microwave irradiation. The rapid and uniform microwave heating rate in AgNP synthesis reduced reaction time and produced small and homogeneous AgNPs.30,31 The analytical characteristics of the sensor, such as linear range, detection limit, quantitation limit, sensitivity, repeatability, selectivity, and sensor stability, will be determined based on the sizes and morphology of AgNPs. The selectivity of AgNPs was determined using contaminated H2O2, and application tests on milk samples were also carried out. This study provides a detailed evaluation of the stability and sensitivity of AgNPs produced from the microwave method as H2O2 colorimetric sensors.
Experimental
Materials
Analytical reagent grade silver nitrate (AgNO3), ascorbic acid (C6H8O6), hydrogen peroxide (30%, w/w H2O2), polyvinylpyrrolidone (C6H9NO)n, 30![[thin space (1/6-em)]](https://www.rsc.org/images/entities/char_2009.gif) 000 kDa, ammonium sulphate ((NH4)2SO4), lead(II) nitrate (PbNO3), glucose (C6H12O6), citric acid (C6H8O7), sodium chloride (NaCl), and ethanol (C2H6O) were purchased from Merck. Deionized water was used in all the procedures.
000 kDa, ammonium sulphate ((NH4)2SO4), lead(II) nitrate (PbNO3), glucose (C6H12O6), citric acid (C6H8O7), sodium chloride (NaCl), and ethanol (C2H6O) were purchased from Merck. Deionized water was used in all the procedures.
Synthesis and characterization of AgNPs as sensing agent
Silver nanoparticles were synthesized using AgNO3 precursor with PVP as a capping agent. The 0.01 M AgNO3 solution was mixed with 0.4% PVP solution under rapid stirring, followed by an ascorbic acid solution. The mixture was irradiated in a microwave at 20% power for 3 minutes. A change in the color of the solution to brownish yellow indicated AgNP formation. The AgNPs were separated by centrifugation at 12![[thin space (1/6-em)]](https://www.rsc.org/images/entities/char_2009.gif) 000 rpm for 45 minutes, followed by freeze-drying of the solid. The AgNPs produced were referred to as AgNP1. For comparison, AgNP2 was prepared without microwave irradiation, based on a previous method.32 The spectra profile and crystallinity of AgNPs were characterized using UV-vis spectroscopy (7809 Labo-hub, China) and XRD (Philips X'pert PW 3050, Netherland) with Cu Kα radiation (λ = 1.54060 Å). Capping agent functional groups that stabilized the AgNP were investigated using FTIR (PerkinElmer, USA). The morphology and size of AgNPs were investigated by TEM Hitachi H9500 (Hitachi, Japan).
000 rpm for 45 minutes, followed by freeze-drying of the solid. The AgNPs produced were referred to as AgNP1. For comparison, AgNP2 was prepared without microwave irradiation, based on a previous method.32 The spectra profile and crystallinity of AgNPs were characterized using UV-vis spectroscopy (7809 Labo-hub, China) and XRD (Philips X'pert PW 3050, Netherland) with Cu Kα radiation (λ = 1.54060 Å). Capping agent functional groups that stabilized the AgNP were investigated using FTIR (PerkinElmer, USA). The morphology and size of AgNPs were investigated by TEM Hitachi H9500 (Hitachi, Japan).
The application of AgNPs as H2O2 sensors
H2O2 detection using AgNPs was conducted by adding H2O2 solution (400 μL) at various concentrations into 2000 μL of AgNP solution. The mixture was stirred to form a homogeneous solution and subsequently incubated at 40 °C for 30 minutes. The UV-vis absorption spectra of the solutions were recorded. The absorbances at 419 nm (OD419) of the AgNP solutions before and after H2O2 addition were plotted in a calibration curve, i.e., , according to eqn (1).
 | (1) |
 | (2) |
 | (3) |
σ is the standard deviation and S is the sensitivity of the method, which is the slope of the calibration curve. The repeatability is determined by measuring the sensor response in triplicate.
Selectivity was determined by comparing the response before and after the addition of interferences. Glucose, citric acid, NaCl, and ethanol were added to reach the final concentration of H2O2 and interference of 50 μM. Interference studies were carried out in triplicate. Sensor stability was determined by observing the response of the biosensor until the eighth month of storage. The determination of analytical characteristics was also carried out on AgNP2.
Both types of AgNPs were applied to determine the recovery value of H2O2 in pasteurized milk samples. The milk protein was separated according to the previously reported method33,34 by adding 1.8 g (NH4)2SO4 to 10 mL of milk under magnetic stirring for 30 minutes. The sample supernatant was separated by centrifugation at 8000 rpm for 15 minutes for use in recovery value analysis, calculated using eqn (4). The determination of hydrogen peroxide content was carried out using the standard addition method by adding standard H2O2 (12.50, 18.75, 25.00 μM) to the sample.
 | (4) |
Results and discussion
Synthesis and characterization of AgNPs
The synthesized AgNPs from the AgNO3 solution were characterized using UV-visible spectroscopy. The transformation into Ag nanoparticles could be visually observed based on the changes from colorless to brownish-yellow solutions. Fig. 1a shows a single peak at ∼300 nm, ascribed to the AgNO3 precursor.35 After PVP addition, a peak appeared at ∼330 nm due to the excitation of an electron from the lone pair of the carbonyl to the vacant d-orbital of silver.36 This charge transfer transition induced the formation of an Ag+-PVP complex.37 The complex facilitates silver ion reduction and nucleation in forming stable AgNPs.38 The characteristic peaks of AgNPs at 419 for AgNP1 and 426 nm for AgNP2 appeared after adding AA reducing agent. The absorption peak at a higher wavelength indicates that AgNP2 is larger than AgNP1.39,40 Besides reducing the size of AgNPs, microwave irradiation also shortens the reaction time and forms higher AgNP yields.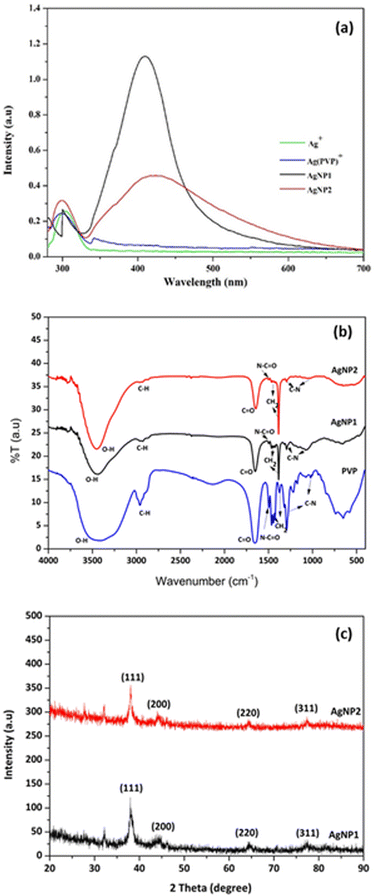 | ||
| Fig. 1 (a) UV-visible spectra of Ag+, Ag+-PVP, AgNP1 and AgNP2. (b) FTIR spectra of PVP, AgNP1 and AgNP2. (c) XRD patterns of AgNP1 and AgNP2. | ||
The capping mechanism by PVP was studied from the FTIR spectra of PVP and AgNPs, as shown in Fig. 1b. Peaks at 1465 and 1425 cm−1 were ascribed to the absorptions of –CH2 groups in PVP. The peak at 1654 cm−1 was attributed to the C![[double bond, length as m-dash]](https://www.rsc.org/images/entities/char_e001.gif) O vibration of PVP41,42 that was red-shifted to 1644 and 1643 cm−1 in AgNP1 and AgNP2 spectra, resulting from the partial donation of electrons from oxygen to silver ions. The peak at 1292 cm−1 indicated the C–N groups in PVP, which were slightly shifted to 1295 cm−1 for AgNP1 and 1294 cm−1 for AgNP2. The N–C
O vibration of PVP41,42 that was red-shifted to 1644 and 1643 cm−1 in AgNP1 and AgNP2 spectra, resulting from the partial donation of electrons from oxygen to silver ions. The peak at 1292 cm−1 indicated the C–N groups in PVP, which were slightly shifted to 1295 cm−1 for AgNP1 and 1294 cm−1 for AgNP2. The N–C![[double bond, length as m-dash]](https://www.rsc.org/images/entities/char_e001.gif) O band at 1503 cm−1 of PVP was shifted to 1495 cm−1 in AgNP1 and AgNP2, indicating that the carbonyl groups are involved in stabilizing AgNPs. The lone pair of electrons on the oxygen atom of PVP is crucial in the formation of the Ag(PVP)+ complex, which is evident from the charge transfer transition at ∼330 nm in the UV-vis spectra (Fig. 1a). The presence of the –OH group in PVP is feasible due to its hygroscopic nature.
O band at 1503 cm−1 of PVP was shifted to 1495 cm−1 in AgNP1 and AgNP2, indicating that the carbonyl groups are involved in stabilizing AgNPs. The lone pair of electrons on the oxygen atom of PVP is crucial in the formation of the Ag(PVP)+ complex, which is evident from the charge transfer transition at ∼330 nm in the UV-vis spectra (Fig. 1a). The presence of the –OH group in PVP is feasible due to its hygroscopic nature.
The XRD analysis of AgNPs showed four diffraction peaks at 2θ values in the range 20–80° (Fig. 1c). These peaks were indexed to (122), (111), (200), (220), and (311) planes, which confirmed the formation of the face-centered cubic (fcc) structure of pure silver.43 TEM analysis of AgNP1 and AgNP2 (Fig. 2a–d) showed that AgNPs were surrounded by a thin amorphous layer, indicating the presence of a PVP capping agent (shown by arrows in Fig. 2a–d). Fig. 2a and c show that AgNP1 have uniform spherical structures and appear smaller than AgNP2 at 18.8 ± 2.8 nm. TEM analysis of AgNP2 showed the formation of large particles with a diameter of 71.2 ± 19.4 nm. The TEM results further confirmed the narrow SPR band profile of AgNP1 as compared to AgNP2 (Fig. 1a). The results indicated that microscopic heating by microwaves rapidly produced silver nanoparticles with a uniform morphology.31,44
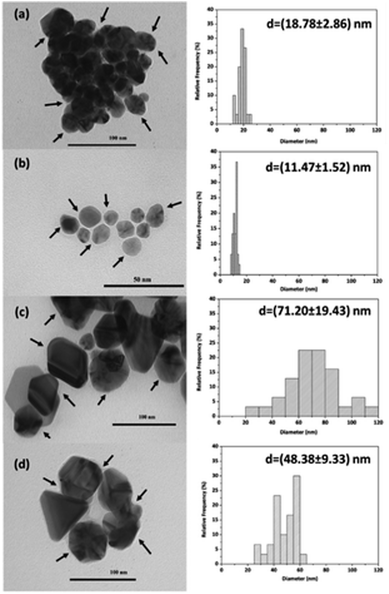 | ||
| Fig. 2 TEM images and size distribution of AgNPs: (a) initial AgNP1, (b) AgNP1 after adding 50 μM H2O2, (c) initial AgNP2, (d) AgNP2 after adding 50 μM H2O2. | ||
The sensing mechanism and analytical characteristics of H2O2 sensors
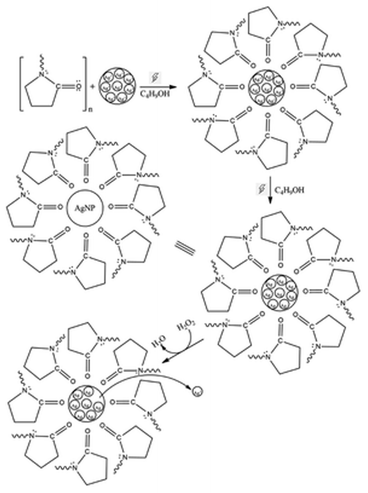
The determination of H2O2 in colorimetric sensors is based on the redox reaction of H2O2 with AgNPs. The AgNPs were oxidized by H2O2 into Ag+ ions, resulting in decreased AgNP concentration. The TEM analysis of AgNPs following the addition of 50 μM H2O2 (Fig. 2b and d) exhibited size reduction from 18.8 ± 2.8 nm to 11.47 ± 1.52 nm for AgNP1 and from 71.2 ± 19.4 nm to 48.38 ± 9.33 nm for AgNP2. The PSA profiles of AgNP1 and AgNP2 before and after oxidation with H2O2 are displayed in Fig. S1.† The size of AgNP2 decreased from 103.60 ± 50.74 nm to 66.80 ± 21.26 nm, whereas AgNP1's size reduced from 27.50 ± 5.68 nm to 9.24 ± 1.71 nm. Even though the TEM and PSA measurements produced slightly different results, their patterns are comparable. H2O2 oxidized AgNPs and etched the surface to form smaller nanoparticles.24,43,45The AgNPs interacted with the C![[double bond, length as m-dash]](https://www.rsc.org/images/entities/char_e001.gif) O groups of PVP, while the pyrrolidone and alkyl groups were assembled to face outward.46 The arrangement generates a protective layer that stabilizes Ag nanoparticles from aggregation. The AgNp surface was exposed to redox reactions with H2O2, causing oxidation to Ag+, resulting in a decrease in AgNP absorbance. The PVP layer may hinder H2O2 diffusion from the solution to the Ag surface. However, the thin PVP layer surrounding the AgNPs (Fig. 2a–d) as observed in TEM analysis suggests the slow polymerization of PVP on the AgNP, thus allowing H2O2 diffusion through the PVP barrier. As seen in Fig. 2 and S2,† the size of the AgNPs decreased as a result of the discharge of several AgNP clusters. Fig. 3 depicts the mechanism of AgNP synthesis and detection of H2O2 by AgNPs.
O groups of PVP, while the pyrrolidone and alkyl groups were assembled to face outward.46 The arrangement generates a protective layer that stabilizes Ag nanoparticles from aggregation. The AgNp surface was exposed to redox reactions with H2O2, causing oxidation to Ag+, resulting in a decrease in AgNP absorbance. The PVP layer may hinder H2O2 diffusion from the solution to the Ag surface. However, the thin PVP layer surrounding the AgNPs (Fig. 2a–d) as observed in TEM analysis suggests the slow polymerization of PVP on the AgNP, thus allowing H2O2 diffusion through the PVP barrier. As seen in Fig. 2 and S2,† the size of the AgNPs decreased as a result of the discharge of several AgNP clusters. Fig. 3 depicts the mechanism of AgNP synthesis and detection of H2O2 by AgNPs.
The pH influence on H2O2 detection using AgNPs was examined by comparing the absorbance of AgNP1 solutions at pH 4, 7, and 9 before and after adding 1 mL of 200 μM H2O2 to the solutions (2 mL). Fig. S3† shows changes in sensor response and the color of the solution. The most significant change in response occurred when sensing H2O2 at pH 4, with the most apparent color fading. The Ag+ ions can be reduced to Ag0 by H2O2 in an alkaline solution,45,47 allowing AgNPs to regenerate (eqn (5)). As a result, the optimum conditions for H2O2 detection occur in acidic pH. This provides simplicity and convenience in H2O2 analysis since the analysis may be carried out directly without adding an alkaline solution to increase the pH.
| H2O2 + 2Ag+ + 2HO− → 2Ag + 2H2O + O2 (E0 = 0.947 V) | (5) |
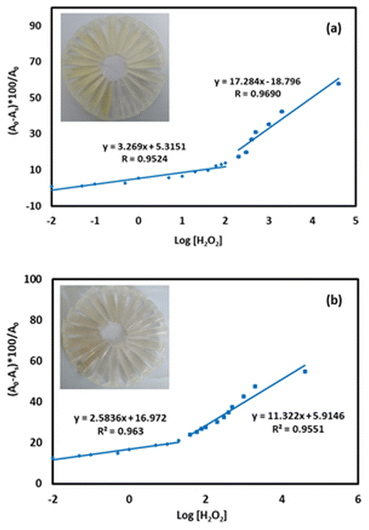
Changes in AgNP response following H2O2 addition at various concentrations are shown in Fig. 4a and b, while the UV-vis spectra of AgNP1 and AgNP2 are shown in Fig. S2.† The AgNP absorbance was gradually reduced and was accompanied by the discoloration of the solution. Increasing the concentration of H2O2 decreased the absorbance of AgNPs for up to 4 × 10⁴ μM at 419 nm for AgNP1 and 426 nm for AgNP2. The detection limit was calculated using the standard deviation and slope of the calibration curve. In the working range of 1 × 10⁻² to 4 × 10⁴ μM, AgNP1 has a lower detection limit than AgNP2. Similarly, AgNP1 has a greater sensitivity than AgNP2, as evidenced by the higher slope value in Fig. 4a and b. The greater sensitivity to H2O2 is due to the decreased size of the AgNPs, which provides more surface sites for the reaction. The uniformity of shape and size also improves the sensor response and sensitivity. AgNP1 exhibits lower LOD and RSD values (repeatability) than AgNP2, suggesting that shape and size homogeneity positively affect the sensor's characteristics.
The linear range, LOD, LOQ, and repeatability (RSD) of the colorimetric sensors are shown in Table 1. The data were also compared with the sensor characteristics of previous studies. In this study, the analytical characteristics of H2O2 sensors using AgNP produced using microwaves are superior with a wider linear range and lower detection limit and are therefore suitable for H2O2 detection.
| Sensing agent | Linear range (μM) | LOD (μM) | LOQ (μM) | RSD (%) | Ref. |
|---|---|---|---|---|---|
| a Graphene quantum dots.b Cellulose nanowhiskers.c Poly(methyl methacrylate).d Locust Bean Gum.e Not determined. | |||||
| AgNP-GQDsa | 0–50 | 3.5 | nde | nde | 24 |
| AgNP-GQDsa | 0–50 | 0.162 | nde | nde | 25 |
| AgNP-citrate | 0.2–32 | 0.090 | nde | nde | 26 |
| AgNP-citrate | 6.7–668 | 8.35 | nde | nde | 20 |
| AgNP-CNWb | 0.01–30 | 0.014 | nde | nde | 23 |
| 60–600 | 112 | ||||
| AgNP-PMMAc | 1–100000 | 1 | nde | nde | 19 |
| Spherical AgNP | 10–40 | 5 | nde | nde | 28 |
| AgNP-LBGd | 1–10000 | 1 | nde | nde | 29 |
| AgNP1-PVP | 0.01–100 | 0.076 | 0.253 | 1.688 | This work |
| 200–40000 | 0.013 | 0.046 | |||
| AgNP2-PVP | 0.01–40 | 0.441 | 1.471 | 1.812 | This work |
| 60–40000 | 0.121 | 0.404 | |||
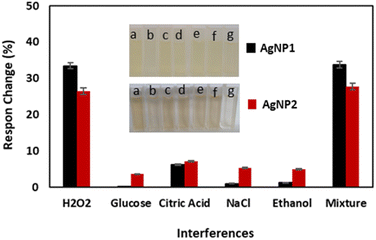
The selectivity as a colorimetric H2O2 sensor was investigated by measuring the AgNp response in the presence of interferences such as glucose, citric acid, NaCl, and ethanol, as shown in Fig. 5. Both AgNPs showed high selectivity, as evidenced by a change in the sensor response of less than 5% due to the addition of interference,48 with citric acid exhibiting the highest response change. Citric acid replaces PVP as a capping agent for AgNPs and generates a small amount of AgNP aggregation.49,50 The measurements were carried out in triplicate and it was revealed that the standard deviation of measurement for AgNP1 was 1.42–5.00%, while that of AgNP2 was 1.55–4.71%. The results indicate the reproducibility of AgNps as a H2O2 sensor. Fig. 5 further shows that AgNP1 is more selective than AgNP2 due to the smaller and more uniform size of the AgNPs.
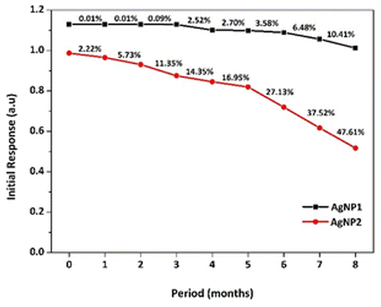
The stability of AgNPs as H2O2 sensors is a critical aspect of their utilization. Therefore, the stability of AgNPs after storage was tested by measuring their response monthly for up to the eighth month, as illustrated in Fig. 6. At the end of the storage time, AgNP1 showed a slight deterioration in response at approximately 10%, while AgNP2 showed up to 47% deficiency. The dramatic drop in AgNP2's initial response was due to particle aggregation. In contrast, AgNP1's smaller size and homogeneous size distribution reduced particle aggregation, maintaining the sensitivity for up to eight months. Under uniform microwave heating in a short thermal induction, Ag nanoparticle nucleation and growth were controlled to form a uniform morphology.51 The capping effect of the surfactant was also intensified under microwave irradiation.52 The π bonds of the C![[double bond, length as m-dash]](https://www.rsc.org/images/entities/char_e001.gif) O functional groups in PVP formed strong interactions with silver, providing an effective capping mechanism to prevent nanoparticle agglomeration.53
O functional groups in PVP formed strong interactions with silver, providing an effective capping mechanism to prevent nanoparticle agglomeration.53
Unlike the synthesis without microwave irradiation, large AgNPs reduced active surface sites for catalytic H2O2 reduction. Inefficient PVP interaction on AgNPs surfaces further initiated particle agglomeration under long-term storage, thus reducing sensor stability. TEM analysis of AgNP2 after H2O2 detection showed the growth of AgNPs into triangular and hexagonal-shaped particles. This transformation provides important insight into the mechanism of PVP attachment to Ag surfaces. The capping of PVP on Ag is suggested to form a homogeneous layer under microwave heating, thus allowing isotropic growth in a uniform direction, and forming small spherically shaped nanoparticles.54 However, PVP tends to attach to the lowest energy facet of Ag in non-microwave synthesis, suppressing uniform isotropic growth. Thus, the lack of the surface capping agent on a high-energy Ag facet resulted in anisotropic growth into various morphologies. Furthermore, the formation of well-defined edges on AgNP2 after H2O2 detection implied that certain facets were susceptible to rapid etching under H2O2.
Sensor performance for actual samples
The assay application of a colorimetric sensor for detecting H2O2 using AgNPs was carried out on milk samples contaminated with H2O2. The recovery value was determined as shown in Table 2. The color changes, UV-vis spectra and the calibration curves of H2O2 detection in the milk samples are shown in Fig. S4.† The recovery value of H2O2 was determined to be ∼99.09–100.56% for AgNP1, and ∼98.18–101.90% for AgNP2. The satisfactory recovery values indicate that homogeneous AgNPs were more accurate in determining H2O2 in the samples. Therefore, the developed AgNp sensor is suitable for real-time practical and industrial applications due to the facile assay processes, rapid analysis, high sensitivity, selectivity, and stability.| AgNPs | [H2O2]added (μM) | [H2O2]measured (μM) | RSD (%) (n = 3) | Recovery (%) |
|---|---|---|---|---|
| AgNP1 | 12.50 | 12.55 | 1.98 | 100.39 |
| 18.75 | 18.58 | 2.20 | 99.09 | |
| 25.00 | 25.14 | 0.93 | 100.56 | |
| AgNP2 | 12.50 | 12.74 | 3.57 | 101.90 |
| 18.75 | 18.52 | 4.76 | 98.80 | |
| 25.00 | 24.54 | 3.13 | 98.18 |
Conclusions
The influence of AgNP size and homogeneity on sensor properties has been explored. The effects of microwave irradiation on the Ag-PVP stabilization during nanoparticle production were determined. Microwave irradiation offers rapid and uniform heating, ensuring the isotropic growth of AgNPs into uniform size and morphology (AgNP1). The sensor characteristics depend on the size and homogeneous morphology to give a detection limit of 0.013 μM, quantization limit of 0.046 μM, repeatability at RSD 1.688%, and selectivity with a response change <5%. AgNPs obtained using microwave synthesis exhibited high stability due to the efficient capping mechanism of the carbonyl group of PVP to prevent the agglomeration of small nanoparticles. Synthesis without microwave irradiation resulted in a non-homogenous PVP interaction, causing anisotropic growth into non-uniform particles. Surface etching during H2O2 detection preferably occurs on less saturated PVP, transforming the AgNP2 into well-defined triangular and hexagonal particles. The application of colorimetric sensors in determining the recovery value of H2O2 levels in milk samples showed satisfactory values of 99.09% to 100.56% for AgNP1 and 98.18% to 101.90% for AgNP2. The detection of H2O2 in its natural environment (acidic pH) without pretreatment offers simplicity and convenience for rapid analysis. Therefore, homogeneous AgNPs produced using microwave heating have great potential for practical use as H2O2 colorimetric sensors.Author contributions
Nurul Ismillayli: conceptualization, methodology, investigation, data curation, writing – original draft. Suprapto Suprapto: funding acquisition validation, supervision, writing – review & editing. Eko Santoso: writing – review & editing. Holilah Holilah: formal analysis. Hasliza Bahruji: visualization, writing – review & editing. Reva Endra Nugraha: formal analysis. Aisyah Abdul Jalil: writing – review & editing. Dhony Hermanto: writing – review & editing. Didik Prasetyoko: validation, supervision, writing – review & editing.Conflicts of interest
There are no conflicts to declare.Acknowledgements
The authors thank the Institut Teknologi Sepuluh Nopember through the Inter-Higher Education Cooperation Research Scheme (Contract number 2267/PKS/ITS/2023) and ORM ITS 2024.References
- C. M. C. Andrés, J. M. Pérez de la Lastra, C. A. Juan, F. J. Plou and E. Pérez-Lebeña, Stresses, 2022, 2, 256–274, DOI:10.3390/stresses2030019.
- Y. Nan, Y. Gu, Z. Liu, Q. Zhou, W. Zhao and W. Xu, New J. Chem., 2021, 45, 4311–4317, 10.1039/d0nj05569g.
- S. Yamashoji, N. Yoshikawa, M. Kirihara and T. Tsuneyoshi, Food Chem., 2013, 138, 2146–2151, DOI:10.1016/j.foodchem.2012.12.037.
- Z. Pan, K. Wang, Y. Wang, P. Tsiakaras and S. Song, Appl. Catal., B, 2018, 237, 392–400, DOI:10.1016/j.apcatb.2018.05.079.
- M. Shokouhi and M. A. Mehrgardi, ChemElectroChem, 2020, 7, 3439–3444, DOI:10.1002/celc.202000535.
- B. E. Watt, A. T. Prodfoot and J. A. Vale, Toxicol. Rev., 2004, 23, 51–57, DOI:10.1016/S2468-1253(20)30003-0.
- Y. Li, J. Guo, H. Zhang, C. W. K. Lam, W. Luo, H. Zhou and W. Zhang, ACS Omega, 2020, 5, 21796–21804, DOI:10.1021/acsomega.0c02843.
- M. Valverde, J. Lozano-Salgado, P. Fortini, M. A. Rodriguez-Sastre, E. Rojas and E. Dogliotti, Stem Cells Int., 2018, 2018, 1615497, DOI:10.1155/2018/1615497.
- D. Bopitiya, D. Christensen, M. Martin, J. Zhang and L. E. Bennett, Food Chem., 2021, 338, 127947, DOI:10.1016/j.foodchem.2020.127947.
- V. Kumar, R. K. Gupta, R. K. Gundampati, D. K. Singh, S. Mohan, S. H. Hasan and M. Malviya, RSC Adv., 2018, 8, 619–631, 10.1039/c7ra11466d.
- M. Shafa, I. Ahmad, S. Hussain, M. Asif, Y. Pan, R. Zairov, A. A. Alothman, M. Ouladsmane, Z. Ullah, N. Ullah, C. Lai and U. Jabeen, Surf. Interfaces, 2023, 36, 102616, DOI:10.1016/j.surfin.2022.10261612.
- A. A. Mahishi, S. M. Shet, P. V. Mane, J. Yu, A. V. Sowriraajan, M. Kigga, M. P. Bhat, K. H. Lee and M. D. Kurkuri, Anal. Methods, 2023, 15, 3259–3267, 10.1039/d3ay00541k.
- S. Wang, Z. Chen, L. Chen, R. Liu and L. Chen, Analyst, 2013, 138, 2080–2084, 10.1039/c3an36722c.
- P. V. Mane, P. Patil, A. A. Mahishi, M. Kigga, M. P. Bhat, K. H. Lee and M. Kurkuri, Heliyon, 2023, 9, e16600, DOI:10.1016/j.heliyon.2023.e16600.
- D. Hermanto, N. Ismillayli, S. Hamdiani, S. R. Kamali, R. Wirawan, H. Muliasari and R. K. Sanjaya, Environ. Eng. Res., 2024, 29, 1–9, DOI:10.4491/eer.2023.503.
- E. M. Elnemma, Bull. Korean Chem. Soc., 2004, 25, 127–129, DOI:10.5012/BKCS.2004.25.1.127.
- K. C. Fang, C. P. Hsu, Y. W. Kang, J. Y. Fang, C. C. Huang, C. H. Hsu, Y. F. Huang, C. C. Chen, S. S. Li, J. Andrew Yeh, D. J. Yao and Y. L. Wang, Biosens. Bioelectron., 2014, 55, 294–300, DOI:10.1016/j.bios.2013.12.029.
- Y. Hong, H. S. Kim, T. Lee, G. Lee and O. Kwon, Nanoscale Res. Lett., 2020, 15, 4–11, DOI:10.1186/s11671-020-03446-2.
- G. G. Carbone, A. Serra, A. Buccolieri and D. Manno, Heliyon, 2019, 5, e02887, DOI:10.1016/j.heliyon.2019.e02887.
- H. Yoshikawa, K. Hieda, K. Ikeda and E. Tamiya, Anal. Methods, 2019, 11, 2991–2995, 10.1039/c9ay00576e.
- Z. Yan, M. F. Yuen, L. Hu, P. Sun and C. S. Lee, RSC Adv., 2014, 4, 48373–48388, 10.1039/c4ra07930b.
- L. Chen, L. Chan, X. Fu and W. Lu, ACS Appl. Mater. Interfaces, 2013, 5, 284–290, DOI:10.1021/am3020857.
- K. B. R. Teodoro, F. L. Migliorini, W. A. Christinelli and D. S. Correa, Carbohydr. Polym., 2019, 212, 235–241, DOI:10.1016/j.carbpol.2019.02.053.
- H. V. Tran, T. V. Nguyen, L. T. N. Nguyen, H. S. Hoang and C. D. Huynh, J. Sci.: Adv. Mater. Devices, 2020, 5, 385–391, DOI:10.1016/j.jsamd.2020.06.001.
- N. D. Nguyen, T. Van Nguyen, A. D. Chu, H. V. Tran, L. T. Tran and C. D. Huynh, Arabian J. Chem., 2018, 11, 1134–1143, DOI:10.1016/j.arabjc.2017.12.035.
- C. Zong, B. Li, J. Wang, X. Liu, W. Zhao, Q. Zhang, X. Nie and Y. Yu, Microchim. Acta, 2018, 185, 1–8, DOI:10.1007/s00604-018-2737-2.
- C. V. Restrepo and C. C. Villa, Environ. Nanotechnol., Monit. Manage., 2021, 15, 100428, DOI:10.1016/j.enmm.2021.100428.
- L. Zhang and L. Li, Anal. Methods, 2016, 8, 6691–6695, 10.1039/C6AY01108J.
- C. K. Tagad, H. U. Kim, R. C. Aiyer, P. More, T. Kim, S. H. Moh, A. Kulkarni and S. G. Sabharwal, RSC Adv., 2013, 3, 22940–22943, 10.1039/c3ra44547j.
- D. N. Kumar, A. Rajeshwari, S. A. Alex, M. Sahu, A. M. Raichur, N. Chandrasekaran and A. Mukherjee, RSC Adv., 2015, 5, 61998–62006, 10.1039/C5RA10146H.
- H. Wang, C. G. Yuan, C. Liu, X. Duan, Q. Guo, Y. Shen, J. Liu and Y. Chen, J. Environ. Sci., 2022, 115, 286–293, DOI:10.1016/j.jes.2021.07.025.
- Y. Wu, P. Liang, Q. min Dong, Y. Bai, Z. Yu, J. Huang, Y. Zhong, Y. C. Dai, D. Ni, H. bo Shu and C. U. Pittman, Food Chem., 2017, 237, 974–980, DOI:10.1016/j.foodchem.2017.06.057.
- L. Zheng, D. Ye, L. Xiong, J. Xu, K. Tao, Z. Zou, D. Huang, X. Kang, S. Yang and J. Xia, Anal. Chim. Acta, 2013, 768, 69–75, DOI:10.1016/j.aca.2013.01.019.
- J. S. Easow and T. Selvaraju, Electrochim. Acta, 2013, 112, 648–654, DOI:10.1016/j.electacta.2013.09.033.
- A. Mirzaei, K. Janghorban, B. Hashemi, M. Bonyani, S. G. Leonardi and G. Neri, J. Nanostruct. Chem., 2017, 7, 37–46, DOI:10.1007/s40097-016-0212-3.
- Y. Borodko, H. S. Lee, S. H. Joo, Y. Zhang and G. Somorjai, J. Phys. Chem. C, 2010, 114, 1117–1126, DOI:10.1021/jp909008z.
- K. M. Koczkur, S. Mourdikoudis, L. Polavarapu and S. E. Skrabalak, Dalton Trans., 2015, 44, 17883–17905, 10.1039/c5dt02964c.
- W. A. Shaikh, S. Chakraborty, G. Owens and R. U. Islam, Appl. Nanosci., 2021, 11, 2625–2660, DOI:10.1007/s13204-021-02135-5.
- L. K. Sørensen, D. E. Khrennikov, V. S. Gerasimov, A. E. Ershov, S. P. Polyutov, S. V Karpov and H. Ågren, J. Phys. Chem. C, 2022, 126, 16804–16814, DOI:10.1021/acs.jpcc.2c03738.
- D. Paramelle, A. Sadovoy, S. Gorelik, P. Free, J. Hobley and D. G. Fernig, Analyst, 2014, 139, 4855–4861, 10.1039/c4an00978a.
- R. Zein, I. Alghoraibi, C. Soukkarieh and M. T. Ismail, Micromachines, 2022, 13, 777, DOI:10.3390/mi13050777.
- R. Bryaskova, D. Pencheva, S. Nikolov and T. Kantardjiev, J. Chem. Biol., 2011, 4, 185–191, DOI:10.1007/s12154-011-0063-9.
- B. Ajitha, Y. A. Kumar Reddy, P. S. Reddy, H. J. Jeon and C. W. Ahn, RSC Adv., 2016, 6, 36171–36179, 10.1039/c6ra03766f.
- S. Mukherji, S. Bharti, G. Shukla and S. Mukherji, Phys. Sci. Rev., 2019, 4, 1–73, DOI:10.1515/psr-2017-0082.
- M. Zannotti, V. Vicomandi, A. Rossi, M. Minicucci, S. Ferraro, L. Petetta and R. Giovannetti, J. Mol. Liq., 2020, 309, 113238, DOI:10.1016/j.molliq.2020.113238.
- G. H. Han, S. H. Lee, M. G. Seo and K. Y. Lee, RSC Adv., 2020, 10, 19952–19960, 10.1039/d0ra03148h.
- T. Parnklang, C. Lertvachirapaiboon, P. Pienpinijtham, K. Wongravee, C. Thammacharoen and S. Ekgasit, RSC Adv., 2013, 3, 12886–12894, 10.1039/c3ra41486h.
- B. Kuswandi, T. Irmawati, M. A. Hidayat, J. Jayus and M. Ahmad, Sensors, 2014, 14, 2135–2149, DOI:10.3390/s140202135.
- A. M. Ferreira, A. Vikulina, M. Loughlin and D. Volodkin, RSC Adv., 2023, 13, 10542–10555, 10.1039/d3ra00917c.
- J. Fernanda and M. B. Cardoso, Langmuir, 2014, 30, 4879–4886, DOI:10.1021/la403635c.
- J. Hernández-Vargas, J. López-Tinoco, R. Huirache-Acuña, R. Rangel-Segura, J. B. González-Campos, J. Villegas, F. Paraguay-Delgado, J. C. González-Hernández and J. Lara-Romero, Chem. Pap., 2021, 75, 4687–4695, DOI:10.1007/s11696-021-01690-z.
- T. Takai, A. Shibatani, Y. Asakuma, A. Saptoro and C. Phan, Chem. Eng. Res. Des., 2022, 182, 714–718, DOI:10.1016/j.cherd.2022.04.035.
- S. Muthaiah, A. Bhatia and M. Kannan, Stab. Appl. Coord. Compd., 2020, 1–18, DOI:10.5772/intechopen.90894.
- M. Tsuji, M. Hashimoto, Y. Nishizawa, M. Kubokawa and T. Tsuji, Chem.–Eur. J., 2005, 11, 440–452, DOI:10.1002/chem.200400417.
Footnote |
| † Electronic supplementary information (ESI) available. See DOI: https://doi.org/10.1039/d3ra07775f |
| This journal is © The Royal Society of Chemistry 2024 |

