 Open Access Article
Water adsorption on MoS2 under realistic atmosphere conditions and impacts on tribology†
N. Scott Bobbitt ,
John F. Curry
 ,
Tomas F. Babuska and
Michael Chandross
 *
*
Material, Physical, and Chemical Sciences Center, Sandia National Laboratories, Albuquerque, New Mexico 87123, USA. E-mail: mechand@sandia.gov
First published on 5th February 2024
Abstract
Molybdenum disulfide (MoS2) is a 2D material widely used as a dry lubricant. However, exposure to water and oxygen is known to reduce its effectiveness, and therefore an understanding of the uptake of water is important information for mitigating these effects. Here we use grand canonical Monte Carlo simulations to rigorously study water adsorption on MoS2 surfaces and edges with different concentrations of defects under realistic atmospheric conditions (i.e. various temperatures and humidity levels). We find that the amount of water adsorbed depends strongly on the number of defects. Simulations indicate that defect sites are generally saturated with water even at low ppm levels of humidity. Water binds strongly to S vacancies on interlamellar surfaces, but generally only one water molecule can fit on each of these sites. Defects on surfaces or edges of lamellae also strongly attract water molecules that then nucleate small clusters of water bonded via hydrogen bonding. We demonstrate that water preferentially binds to surface defects, but once those are saturated at a critical humidity level of about 500–1000 ppm water, water binds to edge sites where it negatively impacts the tribological performance of MoS2.
1 Introduction
Molybdenum disulfide (MoS2) is a lamellar solid consisting of Mo and S in a 2D hexagonal structure.1–3 MoS2 has been the subject of widespread research for many applications including catalysis,4–8 chemical sensors,9–13 and electronic devices.14–16 Prior to research interest in these areas, MoS2 has been used as a solid lubricant17–22 in aerospace applications for decades owing to its extremely low friction and resistance to wear at cryogenic temperatures23 and under vacuum.The low shear strength and friction of MoS2 are due to its lamellar structure in which thin, stacked layers of MoS2 are held together by relatively weak van der Waals forces that permit layers to easily slide across each other. Previous research has demonstrated that water and other environmental contaminants, such as atmospheric water, oxygen, and adventitious carbon increase friction in MoS2 and reduce desirable lubrication properties.24–31 This has limited the utility of MoS2 as a lubricant, especially for applications where it is exposed to humidity. Even for devices destined for the vacuum of space, components are constructed and launched from Earth and often exposed to humid air during fabrication and testing, and this can have a negative impact on the effectiveness of MoS2 lubricants.
Considerable research has focused on understanding the precise mechanism through which water impacts the structure and performance of MoS2.32,33 Previous work from our group has suggested that water adsorbs on the edges of MoS2 flakes, disrupting the lamellar structure and resulting in higher friction.34–37 Others have suggested increases in friction are due to MoS2 oxidizing to MoO3,27,28 hydrogen bonding from water,38,39 or capillary effects.40
Despite these efforts to understand the fundamental interactions of MoS2, water, and oxygen, there have not to date been any rigorous efforts to quantify the amount of water adsorbed by MoS2 under realistic atmospheric conditions. In the work presented here, we use atomistic simulations to predict the amount of water adsorbed from a realistic atmosphere at ambient temperatures, similar to those to which MoS2 might be exposed during device fabrication and testing. As S vacancies are the most common defect in MoS2, we specifically consider the impact of varying densities of S vacancies.41 This work provides a basis for understanding how much water is likely to be adsorbed by MoS2 under realistic conditions.
2 Methods
Grand canonical Monte Carlo (GCMC) simulations were used to compute adsorption isotherms for water, O2, N2, and Ar in MoS2 using the multipurpose molecular simulation code RASPA.42 The simulation box consisted of eight layers of MoS2 (10 × 10 Mo atoms) that were held fixed. These calculations used Lennard-Jones parameters for MoS2 from Gu et al.43 that were developed to accurately capture interactions between MoS2 and water. The TIP3P model was used for all water interactions,44 consistent with the Gu model. Partial charges for the MoS2 were computed using EQeq as implemented in RASPA.45 Note that while the Gu force field prescribes fixed charges of +0.76 and −0.38 on Mo and S, respectively, calculating dynamic charges allows us to account for changes in the partial charges due to defects. The computed values for charges in pristine MoS2 using EQeq are about +0.70 on Mo and −0.35 on S, similar to the Gu values.The TRaPPE model46 was used for N2 and O2, and parameters for Ar were taken from Garcia-Perez.47 Lennard-Jones interactions were truncated at a cutoff of 12.8 Å with no tail corrections. Cross-terms were treated with mixing rules (arithmetic mean of ε, geometric mean of σ),48 and Coulomb interactions were treated using the Ewald summation method. The simulation box was at least twice the LJ cutoff (25.6 Å) in all dimensions. GCMC simulations for bulk MoS2 used 100![[thin space (1/6-em)]](https://www.rsc.org/images/entities/char_2009.gif) 000 initialization cycles followed by 200
000 initialization cycles followed by 200![[thin space (1/6-em)]](https://www.rsc.org/images/entities/char_2009.gif) 000 production cycles. GCMC simulations for surfaces or edges used 500
000 production cycles. GCMC simulations for surfaces or edges used 500![[thin space (1/6-em)]](https://www.rsc.org/images/entities/char_2009.gif) 000 initialization cycles and 1
000 initialization cycles and 1![[thin space (1/6-em)]](https://www.rsc.org/images/entities/char_2009.gif) 000
000![[thin space (1/6-em)]](https://www.rsc.org/images/entities/char_2009.gif) 000 production cycles. The allowed Monte Carlo moves were translation, rotation, regrowth, insertion, deletion, and identity change, all with equal probability. Simulations were performed at 1 bar (0.1 MPa) and either 278 K, 298 K, or 313 K. The composition of the gas reservoir was chosen to mimic a humid atmosphere, including O2, N2, Ar, and water. For the exact composition used in each simulation, see ESI Table 1.† All Lennard-Jones parameters are given in ESI Table 3.† MoS2 unit cell parameters (for 2H phase) are given in ESI.†
000 production cycles. The allowed Monte Carlo moves were translation, rotation, regrowth, insertion, deletion, and identity change, all with equal probability. Simulations were performed at 1 bar (0.1 MPa) and either 278 K, 298 K, or 313 K. The composition of the gas reservoir was chosen to mimic a humid atmosphere, including O2, N2, Ar, and water. For the exact composition used in each simulation, see ESI Table 1.† All Lennard-Jones parameters are given in ESI Table 3.† MoS2 unit cell parameters (for 2H phase) are given in ESI.†
Defects were created by randomly removing S atoms to create a specific defect density, followed by a recalculation of the partial charges in RASPA. The MoS2 structure was held fixed at the crystallographic minimum computed with density functional theory (DFT) (PAW_PBE pseudopotentials, 520 eV energy cutoff, and a 4 × 4 × 1 Monkhorst–Pack k-points grid) in our previous work.37 The energy of separating layers of MoS2 was computed using single point DFT calculations with the same parameters.
Friction experiments were carried out on a custom linear reciprocating microtribometer in both rough vacuum environments (∼2 torr) and ambient pressure to achieve a wide range of partial pressures of water, ranging from 0.054 to 5.624 torr. Partial pressures of water and other environmental constituents were measured via an ambient pressure residual gas analyzer with an orifice plate for operation in 2 torr, alongside a chilled mirror hygrometer to measure partial pressures of water in ambient conditions. All friction experiments were carried out for 500 sliding cycles on 1 micron thick physical vapor deposited MoS2 coatings against a 1/8′′ diameter steel counterface at 200 mN load, 1 mm s−1 sliding speed and 2 mm stroke length. Average cycle coefficient of friction was calculated from bi-directional friction loops using the methods of Burris and Sawyer.49 The averages and standard deviations at each pressure are from the last 100 sliding cycles (steady-state region) of each experiment.
3 Results and discussion
3.1 Adsorption Isotherms for bulk MoS2
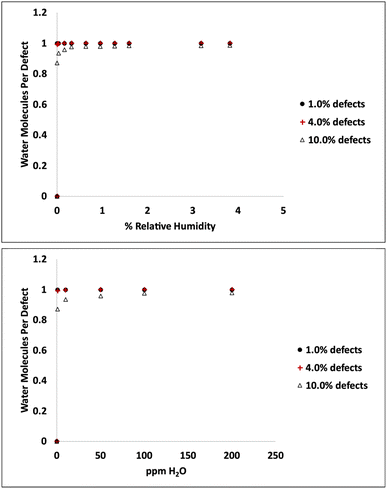
Adsorption isotherms from GCMC simulations are shown in Fig. 1 for defect levels (sulfur vacancies) ranging from 0 to 10% of S atoms removed. 1% S defects corresponds to about 2.3 × 10¹³ defects per cm2 and this is similar to the density of native point defects in MoS2 monolayers grown by chemical vapor deposition.50 Simulations indicate there is virtually no water adsorbed on defect-free MoS2. In almost all cases with defects, the isotherms reach saturation at very low humidity levels. In a system with 1% S defects that has been exposed to humidity and saturated with water, about 0.25% of the mass of the system is water. This can have significant implications for applications highly sensitive to humidity. The same data is replotted in Fig. 2 where we show the amount of water adsorbed normalized by the number of defects. For 1% and 4% defects, the amount of water adsorbed corresponds to one water per S vacancy at humidities as low as 1 ppm water. For the case of 10% defects (2.3 × 10¹⁴ per cm2), much higher than the typical amount in naturally MoS2,51,52 the isotherm does not reach saturation at low humidities, but the defects are 98% saturated at 1% RH. We note that the error bars for Fig. 1 and 2 are very small, essentially zero. The water binds to the defects sites and remains with no fluctuations. Raw data with error estimates for all GCMC simulations are given in the ESI.† Notably, the system with 10% defects never fully reaches 1.0 water molecule per defect site and only reaches a maximum of 99.5% saturation (we consider saturation to be 1 water molecule per defect site). We attribute this to a significant number of the defects being adjacent; in these cases the addition of water to a neighboring defect site is slightly less favored than adding a water to a single site because of the smaller charges. The charge on Mo on a single S vacancy is around 0.58 compared to 0.7 with no defect. For an Mo atom missing two S ligands, however, the partial charge is reduced to about 0.3–0.4, weakening the attractive force. This is consistent with results from DFT calculations in our previous work.37 It is interesting to note that the S–S distance on MoS2 is ∼3.15 Å, which is close to the average water–water separation distance in liquid water at ambient conditions (3.1 Å). Therefore, we can surmise water should fit into the S vacancy site, and when two water molecules are bound to adjacent sites, their respective spacing is close to that of liquid water.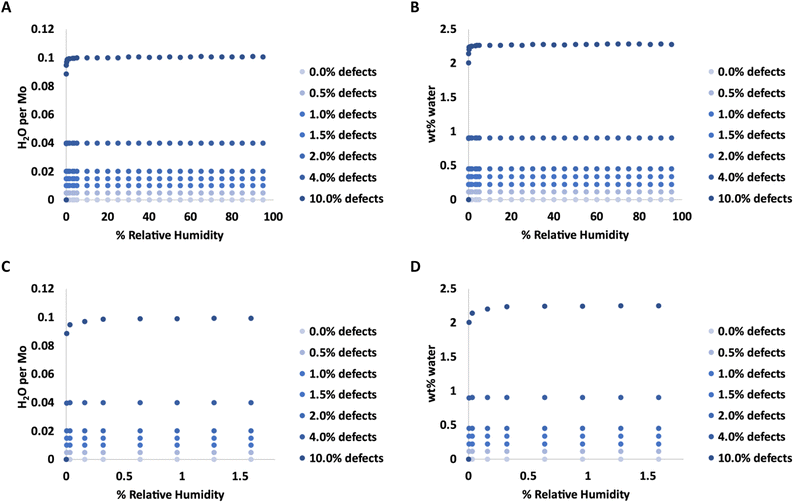 | ||
| Fig. 1 Adsorption isotherms for water in MoS2 at 298 K with various levels of defects. C and D show the same data as in A and B, respectively, but expanded for low levels of humidity. | ||
3.2 MoS2 surfaces
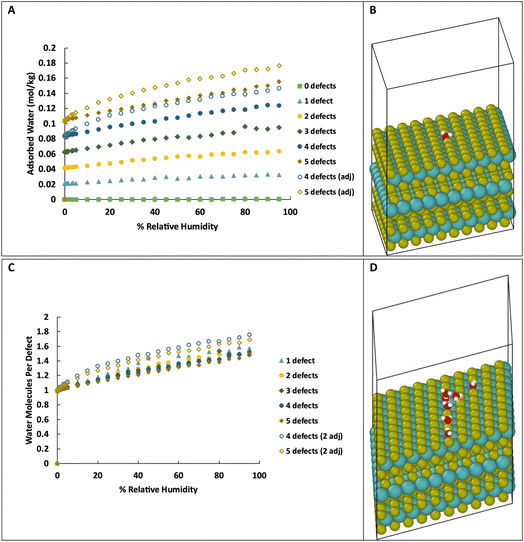
As we are primarily interested in the effects of water on the tribology of MoS2 (i.e., surface properties), we also simulated water adsorption onto S vacancies on the surface of MoS2. This system consists of three layers of MoS2 with 20 Å of vacuum space above the top layer, as shown in Fig. 3B, with 0 to 5 defects on the basal surface. For the structures with 0 to 3 defects, the defects are placed randomly, but specifically not adjacent to other defects. As the density of defects increases, adjacent defects become statistically more likely, so we consider the effects of adjacent defect sites. For the structures with 4 and 5 defects, two structures were created, one without adjacent defects, and one with two adjacent defects (e.g., 2 adjacent and 3 isolated for a total of 5 defects). Visualizations of the structures are shown in ESI Fig. 3.†As in bulk MoS2, we find that the defects are saturated by water molecules at very low humidity levels (Fig. 3C). Again, no water is adsorbed on the defect-free surface. As the humidity increases, small clusters of water nucleate on the defect sites increasing the ratio of water to defects (Fig. 3D) up to about 1.4–1.8 water molecules per defect. Notably, the surfaces with adjacent defect sites adsorb more water than those with only isolated sites. This might seem to contradict our previous conclusion from Fig. 2 that adjacent defect sites are less favorable for adsorption. That conclusion, however, only applies to the first water molecule that binds to the S vacancy. Subsequent water molecules bind to the initial water via hydrogen bonding, and these additional molecules prefer sites with two adjacent water molecules to form two hydrogen bonds (Fig. 4). Therefore, adjacent defect sites decrease the affinity of the MoS2 surface for a single water molecule because of the reduced Coulomb attraction, but adjacent sites with previously bound water molecules increase the binding affinity for a second layer of water due to increased hydrogen bonding.
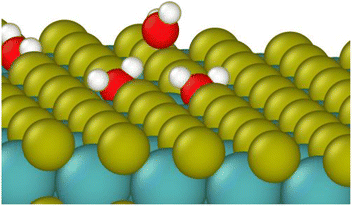 | ||
| Fig. 4 Water molecule stabilized on a defect site by two hydrogen bonds. Colors: red O, white H, yellow S, teal Mo. | ||
For the surface with 5 defects, at the lowest humidity (0.003% RH, 298 K), the structure with adjacent defects contains an average 0.98 water molecules per defect while the structure with non-adjacent defects is completely saturated with 1 water per defect. This is in agreement with the results of simulations in bulk with high defect density. However, at 90% RH, the structure with adjacent defects has 1.65 water molecules per defect, compared to 1.43 for the non-adjacent defects.
The breakdown of the adsorption energy into the van der Waals and Coulomb energy contributions is shown in Fig. 5. Note these values are the total energy of adsorbate–adsorbate or adsorbate–MoS2 interactions, including O2, N2, and Ar. There are no Mo–S interactions included. However, as very little of the other atmospheric species are adsorbed on the MoS2 in the GCMC simulations, the energies shown are almost entirely due to water.
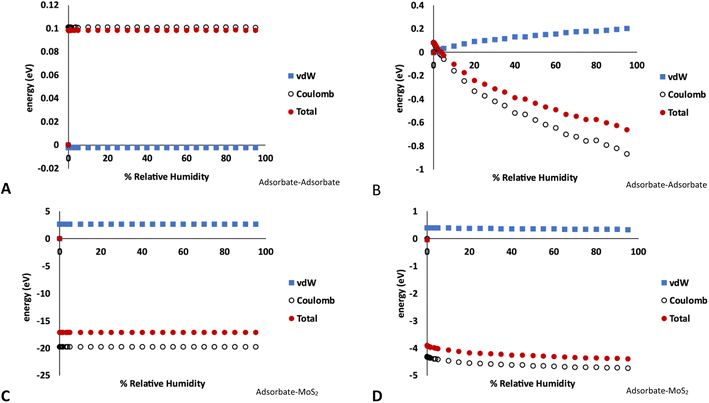 | ||
| Fig. 5 Energy decomposition (energy units in eV) for water adsorption in MoS2 at 298 K. These values represent the total energy of either adsorbate–adsorbate or adsorbate–host interactions in the simulation, averaged over the length of the GCMC simulation. (A) Adsorbate–adsorbate interactions in bulk MoS2 (1% defects), (B) adsorbate–adsorbate interactions on MoS2 surface (4% defects), (C) adsorbate–MoS2 interactions in bulk MoS2 (1% defects), (D) adsorbate–MoS2 interactions on MoS2 surface (4% defects). Note the different energy scales in A–D. Raw data with error bars is given in the ESI.† | ||
Fig. 5A and C show the adsorbate–adsorbate and adsorbate–host (MoS2) interactions in bulk MoS2 with 1% defects, respectively, corresponding to the isotherms in Fig. 1. The energies mirror the adsorption isotherm in that they show no dependence on humidity; S vacancies are saturated with water at low humidities and no more water is adsorbed as humidity increases. Energetic interactions are dominated by water–MoS2 Coulomb attraction, and the adsorbate–MoS2 van der Waals interaction is slightly unfavorable, likely due to the water molecule being confined to a small volume around the defect. However, the strong Coulomb attraction overcomes this.
In the case of water adsorption on the surface at 298 K and 4% defects (Fig. 5B and D, corresponding to the isotherms shown in Fig. 3A), the adsorbate–host interactions are essentially independent of humidity, similar to the bulk case. However, the adsorbate–adsorbate interaction energy become much more strongly negative as humidity increases, indicating stronger water–water interactions. As above, the interactions are dominated by Coulomb attraction. It is clear from this figure that the surface defects are saturated by water molecules at low humidity, and as the humidity increases more water molecules bind via hydrogen bonding to form clusters on the surface.
3.3 Other gases
In general, we find very little O2, N2, or Ar adsorbed on the MoS2 surface. As with water, there is not enough space between the layers in the bulk to adsorb gas molecules, but they can bind to the surface. GCMC simulations indicate that a small amount of these gases is adsorbed, but in the same proportion as they are present in the atmosphere. This indicates MoS2 has no selectivity towards Ar, O2 or N2. As shown in Table 1, the presence of defects does not change this behavior, and defects do not impart any selectivity or significantly increase the amount of O2, N2, and Ar adsorbed. This is because the water out-competes the atmospheric gases for binding sites on the defects, and makes sense in light of the data shown in Fig. 5 that indicates that water adsorption is largely driven by Coulomb interactions; O2, N2, and Ar are all nonpolar molecules. At 298 K and 50% RH (on a surface with a single defect) the adsorption enthalpy for water is −37.5 kJ mol−1, compared to −6.3, −6.6, and −6.6 kJ mol−1 for N2, O2, and Ar respectively (computed by RASPA during GCMC simulation). Therefore, defect sites are much more likely to contain a water molecule that will not be dislodged by O2 or N2.| Defects | 0 | 1 | 2 | 3 | 4 | Gas phase |
|---|---|---|---|---|---|---|
| O2 | 0.22 | 0.21 | 0.21 | 0.21 | 0.21 | 0.21 |
| N2 | 0.77 | 0.78 | 0.78 | 0.78 | 0.77 | 0.78 |
| Ar | 0.01 | 0.01 | 0.01 | 0.01 | 0.01 | 0.01 |
3.4 Effects of layer separation
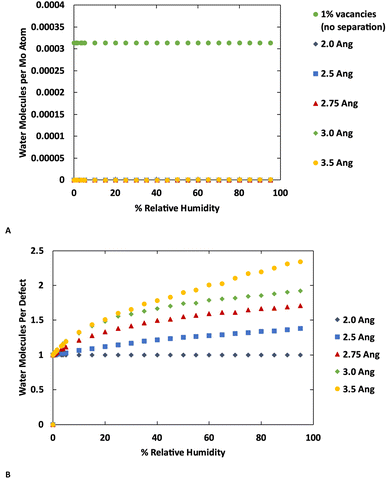
The GCMC simulations indicate that at their crystallographic minimum, the MoS2 lamellae are too close together to permit more than one water molecule per defect to adsorb. However, in these simulations the MoS2 is held fixed while our previous work indicated that water adsorption can disrupt the MoS2 crystal structure by causing layers to separate.37 As there is a significant energetic penalty for this separation, the question arises how far apart must layers be pushed in order to permit more water adsorption. To study this effect, we performed a series of simulations with four layers of MoS2 with the inter-layer distance ranging from the minimum (Mo–Mo distance 6.3 Å) to an additional 3.5 Å of separation. The results are shown in Fig. 6 (also ESI Fig. 7 and ESI Fig. 8†) for MoS2 with and without defects.No additional water is adsorbed with up to 2.0 Å of additional separation. At 2.5 Å a very small amount of extra water adsorbs in the defect-free MoS2, while more significant amounts of extra water are adsorbed at 3.0 Å or greater separations. Water is primarily adsorbed to the defect sites or small clusters of water around the defects. These results are consistent with the kinetic diameter of water of 2.65 Å.53 In the defective MoS2, as before, there is no additional water adsorbed with only 2.0 Å of increased separation, but further separation leads to more water adsorption.
Interestingly we find that the isotherm shape is different in the defect-free and defective MoS2. In the defect-free system, the isotherm is linear with humidity (pressure) indicating Henry behavior, with the Henry coefficient increasing with layer separation distance. This is due to the uniformity of the MoS2 without defects where there is no differentiation among binding sites. In the defective MoS2, however, the isotherm takes on a classic Type I Langmuir shape, consistent with adsorption in porous materials like zeolites. This indicates a stronger interaction with the MoS2 defect sites, while the pristine MoS2 is largely hydrophobic as shown in Fig. 6A (also Fig. 1 and 3). Notably, for bulk MoS2 with defects (Fig. 1) the isotherm is essentially flat because it saturates at very low humidity. This could be viewed as a Type I isotherm with very high interaction strength, as seen in the 10% defects case.
Separating the layers of MoS2 from their normal minimum position requires energy. Alternatively, one can think of this value as the amount of energy driving MoS2 lamellae to return to their optimal position and effectively push out adsorbates like water.54,55 This is important for tribological applications where water is likely entrained in the bulk of MoS2 but eventually diffuses out.29,56,57
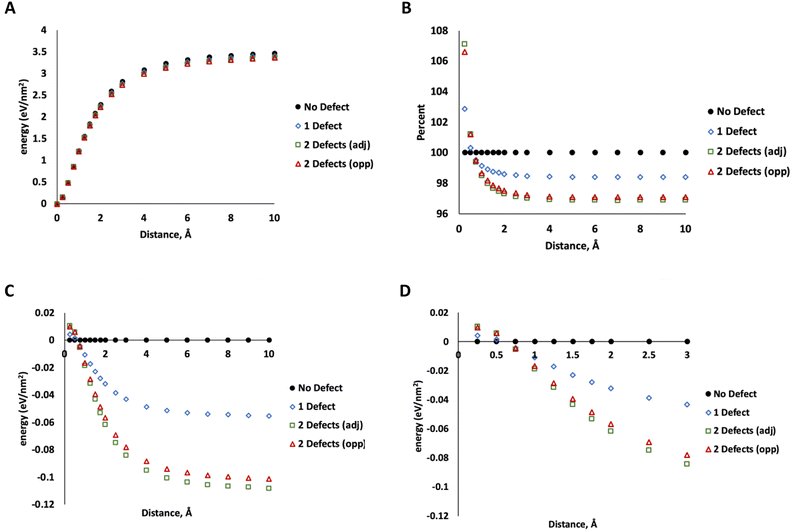
To determine how much energy is associated with MoS2 layer separation, we used DFT calculations (PBE functional, 520 eV, DFT details same as our previous work37) on a 5 × 5 unit cell of MoS2 with 4 layers in the 2H configuration (ESI Fig. 2†). Starting with the minimized geometry, we increased the distance between two layers (leaving the others unchanged) up to 10 Å of separation beyond the crystallographic minimum. At this point, the energy no longer changes with increasing separation, indicating that the two layers are no longer interacting. This was repeated for MoS2 structures with one S vacancy on the surface of one of the separated layers, two adjacent S vacancies on the surface of a separated layer, and two S vacancies on opposing layers (on the site of the nearest neighbor S directly above the first defect). The data in Fig. 7 show only minor differences between these two configurations. The energy of separating layers with two adjacent defects is slightly lower at large distances.
More significantly, the energy of separating defective layers is higher than pristine MoS2 at small distances up to ∼0.5 Å, indicating that they are more difficult to separate than pristine MoS2. At 0.75 Å or greater, this trend changes and defective MoS2 becomes easier to separate. At the smaller distances (<0.5 Å), the defective layers bind to each other more tightly due to attraction between unsaturated defect sites. We attribute this to electronic communication between the unsaturated states at defects on the lamellae at the closer distance. At 10 Å, the difference between defect-free structure and that with one defect is about 0.06 eV nm−2 compared to 0.1–0.11 eV nm−2 for two defects. At this distance we attribute this difference mostly to weaker dispersion interactions from the missing atoms, which reduces the number of pairwise interactions in the system.
3.5 Defects on edges
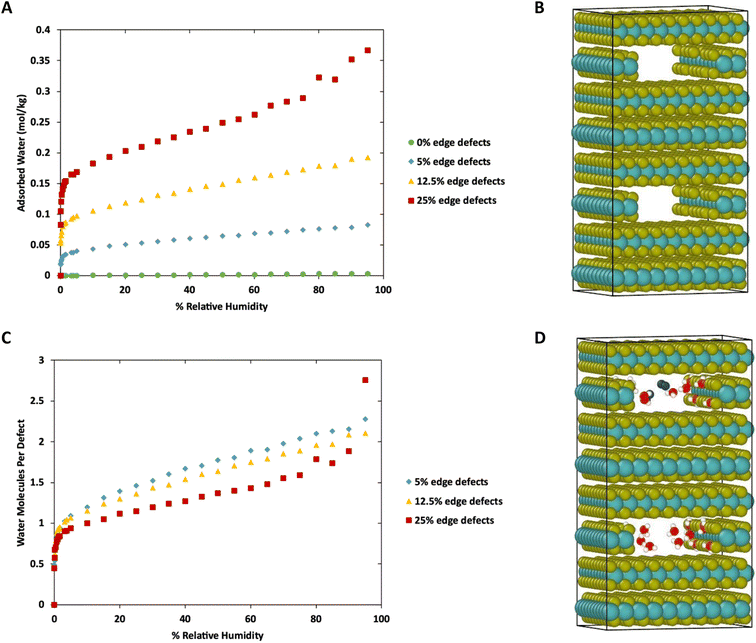
To this point we have focused on defects on the basal surface. However, defects on the edges of MoS2 lamellae have a strong influence over tribological properties.35,36 Therefore, we next consider water adsorption to edges of MoS2 with and without S defects. This was done by removing a stoichiometric slice of a layer, creating a small cavity, followed by the removal of random S atoms along the edges to create defects. This is meant to mimic gaps between sheets or flakes of MoS2 deep in the bulk, as was shown in our previous work to impact tribological performance. The simulation box was duplicated to ensure the length of the simulation box in the Z direction was greater than twice the Lennard-Jones cutoff (shown in Fig. 8B).Results of the GCMC simulations with edge defects at 298 K are shown in Fig. 8 (278 K and 313 K) are shown in ESI Fig. 6.† As with the basal surfaces, very little water adsorbs on the edge when no defects are present. However, more water adsorbs to the defect-free edges compared to the defect-free surface or bulk (0.00033 mol kg−1 on surface vs. 0.0028 mol kg−1 on edges at 298 K, 80% RH, 0 mol kg−1 in defect free bulk) When defects are present on the edges, they are saturated with one water molecule per vacancy at low relative humidity. From that point, the amount of water adsorbed increases nearly linearly with humidity. In the case of 25% edge defects (10 of the 40 edge S removed) we see Type IV isotherm behavior around 80–95% humidity as the water clusters around the defect sites and begins to exhibit capillary condensation. Note that this defect level is similar to that in our previous work with stoichiometric MoS2 nanoplatelets.35,36 In that work, perfectly terminated flakes were highly non-stoichiometric (with excess S), but stoichiometric flakes had ∼30% defects in the form of removed S atoms along the edges.
Notably, although the edge defects are mostly saturated with water at low humidity, the humidity level for saturation is not as low as in the case of the basal surface defects (Fig. 1), which are saturated almost immediately. The system with 12.5% defects does not reach 1 water molecule per defect site until 3% humidity (around 940 ppm at 298 K), which is practically quite low, but also markedly more than the structure with 4% defects on the basal surface that reached saturation at lower than 10 ppm water (0.03% RH). However, we note that all these saturation humidity levels are realistically quite low. For example, desert climates typically have relative humidities of 10–20%, and at these levels our results indicate that all defect sites in MoS2 will be fully saturated.
The reason for this is not immediately clear from looking at the partial charges on the MoS2 structure, as calculated via EQeq in RASPA.45 In pristine MoS2, Mo carries a charge of about 0.70 and S has a charge of −0.35. For a S vacancy on the surface, the Mo charge is reduced to 0.58. For an edge vacancy, the charge on the undercoordinated Mo is only reduced slightly to 0.68. Since we have determined previously that water adsorption is primarily driven by Coulomb interactions, it appears that the water should prefer to bind to the edge site with a stronger positive charge. However, the opposite is true.
To understand the binding to edge defects, it is useful to closely examine the binding positions of water on each type of defect, shown in Fig. 9. For the surface defect (Fig. 9A), the water occupies the vacancy left by the S, in close proximity to three Mo atoms (distances 2.5, 2.6, and 2.7 Å) while for the edge defects each water mostly interacts with only two Mo atoms (distances 2.5 and 2.7 Å). Therefore, despite the ostensibly weaker Coulomb attraction from Mo atoms on the surface, the addition of a third Mo increases the overall binding strength, resulting in more favorable binding on the surface.
Fig. 10 shows a comparison of water adsorption on bulk MoS2, the basal surface of MoS2, and the edges at 298 K. The surface and edge structures have 5% defects on the surface or edge, respectively, and no defects elsewhere. The bulk MoS2 has defects on the basal surfaces. For the edge case, defects are only on the edge and there are no defects on the surface. For the surface structure, there are five defects and none of them are adjacent (ESI Fig. 3F†). As expected from the results in Fig. 2, in bulk MoS2, each defect adsorbs one water molecule. On the surface, the defects are saturated with one water molecule per site at very low humidity, and then the average number of water molecules per defect site increases linearly up to about 1.5 water molecules per defect at 95% humidity. For the edge defects case, at very low humidity (1 ppm water) the edges have an average 0.5 water molecules per defect site. The edge sites reach saturation at about 2.9% RH (314 ppm water) and the number of water molecules increases to 2.3 per defect at 95% RH. Notably, the isotherm also takes on a more typical Type I Langmuir shape.
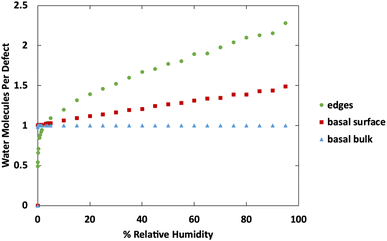 | ||
| Fig. 10 Water adsorption isotherms at 298 K for MoS2 surface, bulks MoS2, and MoS2 edges. All structures contain 5% defects on only the surface or edge, as indicated in the legend. | ||
We can see from Fig. 10 that at extremely low (<942 ppm or 3% RH at 298 K) levels of humidity, water favors binding to the basal surface or bulk, but at higher (>3%) levels of humidity the edge sites are preferred. This threshold is important because previous research indicates that water binding to edge defects impact the tribological performance,36 and these results agree with experimental values (Section 3.6). At higher humidity, the water molecules in excess of one water molecule per defect site are largely adsorbed via hydrogen bonding to water molecules that are already bound to the surface. The hydrogen bonding should not be impacted by the location of the S defects (edge vs. surface), so it is interesting that the edge sites attract more water. We attribute this to the additional van der Waals attraction from the layers above and below the edge site, creating a small pore.
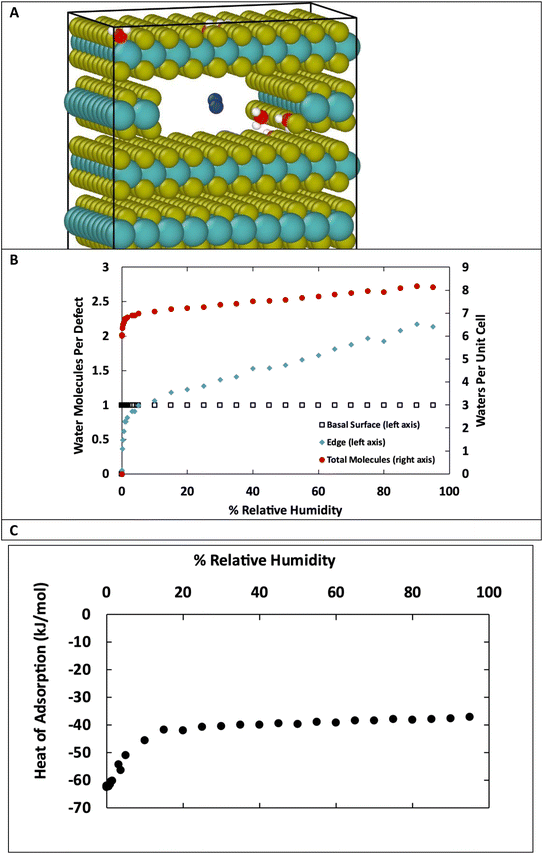
The structures in Fig. 10 each have defects in only one location. However, real MoS2 systems will have a distribution of defects across both surface and edge sites. To better model real systems, we repeated the calculations on a structure that contains an edge and basal surface, with 1% defects randomly distributed throughout the structure (Fig. 11A). In this case, there are 7 total defects: 1 on the edge and 6 on the surfaces. Based on the previous results in Fig. 1 and 2, we can assume the surface defects that are in the bulk will each adsorb only one water molecule, and the rest of the water in the system will be adsorbed on the edge defects. Using this assumption, we see in Fig. 11B similar behavior to the individual structures in Fig. 10. At low humidity the edge defects are not saturated, until about 5% RH in this case. At 95% RH the edge defects adsorb a little over 2 water molecules per site on average. The heat of adsorption (Fig. 11C) is about −62 kJ mol−1 at low humidity and then around −37 kJ mol−1 at high humidity. This corresponds to water binding to the more favorable surface sites at the lowest humidity, followed by the edge sites, and then a second layer of water binding to adsorbed water molecules on edge sites via hydrogen bonding.
3.6 Implications for tribology
Based on our simulations, it is clear that any defect sites in MoS2 will be nearly saturated with water even at humidity levels as low as 3% relative humidity (around 940 ppm at 298 K). This implies that any exposure to humid atmosphere during synthesis, processing or testing will certainly result in significant quantities of water adsorption, depending on the defect density. For 1% defects at 298 K, this could be around 0.2 wt% water or greater in the MoS2.Based on results in Fig. 11, after the surface defects are saturated, most of the adsorbed water will bind to defects on edge sites, where it will disrupt formation of larger lamellae and inhibit the effectiveness of the lubricant.36 These results agree with previous work that demonstrated water's ability to coalesce at edges of MoS2 lamellae, preventing formation of larger lamellae leading to higher friction coefficients. Friction tests as a function of the partial pressure of water in the atmosphere (Fig. 12) corroborate these results, showing a distinct increase in friction coefficient around 0.15–1.0 torr, or approximately 130–1300 ppm water. This suggests that the saturation of water at edges of MoS2 lamellae lead to the increase in friction observed in dynamic sliding and prevent lubrication by inhibiting formation of long term ordered surface lamellae. This agrees with the simulations that indicate that surface or bulk defects saturate first, around 3% relative humidity (940 ppm, 0.7 torr), and then water starts binding to the edges where it impacts tribological performance. As described in our previous work36 water bound to the edges of small MoS2 flakes will inhibit the formation of larger lamellae that are responsible for the low friction coefficient generally found in MoS2. As shown in Fig. 12, small amounts of water (which simulations indicate are likely bound to the surface instead of the edges) do not impact tribological performance significantly.
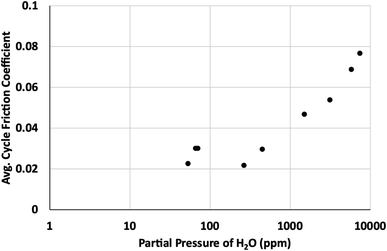 | ||
| Fig. 12 Average cycle friction coefficient as a function of partial pressure of water in parts per million (ppm). | ||
We posit that it is a reasonably valid assumption that each surface vacancy (between the lamellae) will contain only one water, and all other water is mostly likely bound to edge sites or condensed in micropores between the lamellae. We find that within the range of 278 K to 313 K, there is not a large effect of temperature on the amount of water adsorbed on MoS2, (see ESI Fig. 4–ESI Fig. 6†), though there is slightly more water adsorbed at higher temperatures due to the higher humidity/vapor pressure.
4 Conclusions
In this work we used GCMC simulations to systematically study water adsorption on MoS2 with defects on surfaces and edges. Although it has been commonly known for a long time that water impacts the tribological performance of MoS2, the mechanisms of water adsorption under exposure to realistic atmospheres have not been rigorously studied previously. We find that pristine MoS2 is generally hydrophobic, and water adsorption is heavily influenced by defects. The adsorption mechanism is dominated by Coulomb attraction between water and positively charged Mo atoms at defects sites, and subsequently by hydrogen bonding between a second layer of water and the water molecules bound to the MoS2. At a representative atmospheric condition of 298 K and 5% RH, MoS2 with 1% defects (a realistic value for real MoS2) can contain 0.2 wt% water or more. We find no significant adsorption of O2, N2, or argon.Water preferentially binds to defects on the basal surface first due to geometric effects that allow interactions with three Mo atoms at once; however, these sites are saturated at low ppm humidity and in bulk MoS2 can only hold one water per site. Water molecules bound to the surface or edges nucleate small clusters of water via hydrogen bonding. Ultimately, most water will go to defect sites on the edges, and our previous work has shown that water bound to edges of MoS2 flakes play a critical role in the negative impact on tribology.36
We also used DFT to compute the energy of separating layers of MoS2 to permit higher water adsorption. GCMC simulations indicate water will not intercalate the layers until they are separated at least 2.5 Å beyond their usual minimum position, and this requires about 2.5 eV nm−2. Interestingly, the inclusion of defects increases the energy required to separate layers at small distances (<0.5 Å) but reduces it slightly at longer distances.
Generally, defect sites are completely saturated with water at very low (ppm) humidity. However, we find that MoS2 with high defect density (10%) does not saturate at low humidity and never truly reaches 100% saturation (98% saturated at 1% RH and higher). We attribute this to the presence of more adjacent defects that we show are slightly less favorable binding sites for water. However, adjacent defect sites on surfaces result in more water adsorption at medium or high humidities because water molecules bound to adjacent sites create ideal binding sites for a third water molecule stabilized by two hydrogen bonds.
While surface defects in bulk MoS2 are more favorable for water adsorption than edges, edge sites also readily bind water and have more room for a second layer adsorbed to the bound water molecules. (In the bulk, each defect can contain only one water molecule.) Therefore, we conclude at very low humidity, surface defect sites are saturated, and at higher humidity (about 3% relative humidity) edge sites become saturated and take on more water. Water binding to the edge sites disrupts the formation of ordered surface lamellae and reduces the effectiveness of the lubricant.29,36
Practically, all defect sites are saturated above 3–5% relative humidity and virtually all MoS2 that has been exposed to regular atmosphere should be considered saturated with at least one water molecule per defect site.
Conflicts of interest
There are no conflicts to declare.Acknowledgements
This article has been authored by an employee of National Technology & Engineering Solutions of Sandia, LLC under Contract No. DE-NA0003525 with the U.S. Department of Energy (DOE). The employee owns all right, title and interest in and to the article and is solely responsible for its contents. The United States Government retains and the publisher, by accepting the article for publication, acknowledges that the United States Government retains a non-exclusive, paid-up, irrevocable, world-wide license to publish or reproduce the published form of this article or allow others to do so, for United States Government purposes. The DOE will provide public access to these results of federally sponsored research in accordance with the DOE Public Access Plan https://www.energy.gov/downloads/doe-public-access-plan. This paper describes objective technical results and analysis. Any subjective views or opinions that might be expressed in the paper do not necessarily represent the views of the U.S. Department of Energy or the United States Government.References
- U. Krishnan, M. Kaur, K. Singh, M. Kumar and A. Kumar, A Synoptic Review of MoS2: Synthesis to Applications, Superlattices Microstruct., 2019, 128, 274–297 CrossRef CAS.
- X. Li and H. Zhu, Two-Dimensional MoS2: Properties, Preparation, and Applications, J. Materiomics, 2015, 1, 33–44 CrossRef.
- J. Sun, X. Li, W. Guo, M. Zhao, X. Fan, Y. Dong, C. Xu, J. Deng and Y. Fu, Synthesis Methods of Two-Dimensional MoS2: A Brief Review, Crystals, 2017, 7, 198 CrossRef.
- L. S. Byskov, J. K. Nørskov, B. S. Clausen and H. Topsøe, Edge Termination of MoS2 and Comos Catalyst Particles, Catal. Lett., 2000, 64, 95–99 CrossRef CAS.
- Y. Cao, Roadmap and Direction toward High-Performance MoS2 Hydrogen Evolution Catalysts, ACS Nano, 2021, 15, 11014–11039 CrossRef CAS PubMed.
- L. Lei, D. Huang, G. Zeng, M. Cheng, D. Jiang, C. Zhou, S. Chen and W. Wang, A Fantastic Two-Dimensional MoS2 Material Based on the Inert Basal Planes Activation: Electronic Structure, Synthesis Strategies, Catalytic Active Sites, Catalytic and Electronics Properties, Coord. Chem. Rev., 2019, 399, 213020 CrossRef CAS.
- S. Singh, A. Modak, K. K. Pant, A. Sinhamahapatra and P. Biswas, MoS2–Nanosheets-Based Catalysts for Photocatalytic CO2 Reduction: A Review, ACS Appl. Nano Mater., 2021, 4, 8644–8667 CrossRef CAS.
- J. Mao, Y. Wang, Z. Zheng and D. Deng, The Rise of Two-Dimensional Mos2 for Catalysis, Front. Phys., 2018, 13, 138118 CrossRef.
- M. Donarelli and L. Ottaviano, 2d Materials for Gas Sensing Applications: A Review on Graphene Oxide, MoS2, Ws2 and Phosphorene, Sensors, 2018, 18, 3638 CrossRef PubMed.
- O. Samy, S. Zeng, M. D. Birowosuto and A. El Moutaouakil, A Review on MoS2 Properties, Synthesis, Sensing Applications and Challenges, Crystals, 2021, 11, 355 CrossRef CAS.
- R. Kumar, W. Zheng, X. Liu, J. Zhang and M. Kumar, MoS2-Based Nanomaterials for Room-Temperature Gas Sensors, Adv. Mater. Technol., 2020, 5, 1901062 CrossRef CAS.
- O. V. Yazyev and A. Kis, MoS2 and Semiconductors in the Flatland, Mater. Today, 2015, 18, 20–30 CrossRef CAS.
- E. Singh, P. Singh, K. S. Kim, G. Y. Yeom and H. S. Nalwa, Flexible Molybdenum Disulfide (MoS2) Atomic Layers for Wearable Electronics and Optoelectronics, ACS Appl. Mater. Interfaces, 2019, 11, 11061–11105 CrossRef CAS PubMed.
- Y. Chen, S. Huang, X. Ji, K. Adepalli, K. Yin, X. Ling, X. Wang, J. Xue, M. Dresselhaus and J. Kong, Tuning Electronic Structure of Single Layer MoS2 through Defect and Interface Engineering, ACS Nano, 2018, 12, 2569–2579 CrossRef CAS PubMed.
- I. D. Marion, D. Čapeta, B. Pielić, F. Faraguna, A. Gallardo, P. Pou, B. Biel, N. Vujičić and M. Kralj, Atomic-Scale Defects and Electronic Properties of a Transferred Synthesized MoS2 Monolayer, Nanotechnology, 2018, 29, 305703 CrossRef PubMed.
- K. Santosh, R. C. Longo, R. Addou, R. M. Wallace and K. Cho, Impact of Intrinsic Atomic Defects on the Electronic Structure of MoS2 Monolayers, Nanotechnology, 2014, 25, 375703 CrossRef PubMed.
- M. R. Vazirisereshk, A. Martini, D. A. Strubbe and M. Z. Baykara, Solid Lubrication with MoS2: A Review, Lubricants, 2019, 7, 57 CrossRef.
- A. Savan, E. Pflüger, P. Voumard, A. Schröer and M. Simmonds, Modern Solid Lubrication: Recent Developments and Applications of MoS2, Lubric. Sci., 2000, 12, 185–203 CrossRef CAS.
- M. Bell and J. Findlay, Molybdenite as a New Lubricant, Phys. Rev., 1941, 59, 922 CAS.
- K. P. Furlan, J. D. B. de Mello and A. N. Klein, Self-Lubricating Composites Containing MoS2: A Review, Tribol. Int., 2018, 120, 280–298 CrossRef CAS.
- T. Spalvins, A Review of Recent Advances in Solid Film Lubrication, J. Vac. Sci. Technol., A, 1987, 5, 212–219 CrossRef CAS.
- Y. Xu, K. Fu, K. Liu, K. Sun, Y. Dong and L. Yao, A State of the Art Review of the Tribology of Graphene/MoS2 Nanocomposites, Mater. Today Commun., 2022, 105108 Search PubMed.
- S. H. Mukhtar, M. Wani, R. Sehgal and M. Sharma, Nano-Mechanical and Nano-Tribological Characterisation of Self-Lubricating MoS2 Nano-Structured Coating for Space Applications, Tribol. Int., 2023, 178, 108017 CrossRef CAS.
- J. Gao, B. Li, J. Tan, P. Chow, T.-M. Lu and N. Koratkar, Aging of Transition Metal Dichalcogenide Monolayers, ACS Nano, 2016, 10, 2628–2635 CrossRef CAS PubMed.
- P. Budania, P. Baine, J. Montgomery, C. McGeough, T. Cafolla, M. Modreanu, D. McNeill, N. Mitchell, G. Hughes and P. Hurley, Long-Term Stability of Mechanically Exfoliated MoS2 Flakes, MRS Commun., 2017, 7, 813–818 CrossRef CAS.
- T. N. Walter, F. Kwok, H. Simchi, H. M. Aldosari and S. E. Mohney, Oxidation and Oxidative Vapor-Phase Etching of Few-Layer MoS2, J. Vac. Sci. Technol. B, 2017, 35, 021203 CrossRef.
- T. Liang, W. G. Sawyer, S. S. Perry, S. B. Sinnott and S. R. Phillpot, Energetics of Oxidation in MoS2 Nanoparticles by Density Functional Theory, J. Phys. Chem., 2011, 115, 10606–10616 CAS.
- T. Liang, W. G. Sawyer, S. S. Perry, S. B. Sinnott and S. R. Phillpot, First-Principles Determination of Static Potential Energy Surfaces for Atomic Friction in MoS2 and MoO3, Phys. Rev. B, 2008, 77, 104105 CrossRef.
- H. Khare and D. Burris, Surface and Subsurface Contributions of Oxidation and Moisture to Room Temperature Friction of Molybdenum Disulfide, Tribol. Lett., 2014, 53, 329–336 CrossRef CAS.
- M. Stella, C. D. Lorenz and M. C. Righi, Effects of Intercalated Water on the Lubricity of Sliding Layers under Load: A Theoretical Investigation on MoS2, 2D Mater., 2021, 8, 035052 CrossRef CAS.
- J. Panitz, L. Pope, J. Lyons and D. Staley, The Tribological Properties of MoS2 Coatings in Vacuum, Low Relative Humidity, and High Relative Humidity Environments, J. Vac. Sci. Technol., A, 1988, 6, 1166–1170 CrossRef CAS.
- V. E. P. Claerbout, P. Nicolini and T. Polcar, Exploring Nanoscale Lubrication Mechanisms of Multilayer MoS2 During Sliding: The Effect of Humidity, Front. Chem., 2021, 9, 450 Search PubMed.
- E. Serpini, A. Rota, A. Ballestrazzi, D. Marchetto, E. Gualtieri and S. Valeri, The Role of Humidity and Oxygen on MoS2 Thin Films Deposited by RF Pvd Magnetron Sputtering, Surf. Coat. Technol., 2017, 319, 345–352 CrossRef CAS.
- J. F. Curry, N. Argibay, T. Babuska, B. Nation, A. Martini, N. C. Strandwitz, M. T. Dugger and B. A. Krick, Highly Oriented Mos2 Coatings: Tribology and Environmental Stability, Tribol. Lett., 2016, 64, 1–9 CrossRef.
- J. F. Curry, M. A. Wilson, H. S. Luftman, N. C. Strandwitz, N. Argibay, M. Chandross, M. A. Sidebottom and B. A. Krick, Impact of Microstructure on MoS2 Oxidation and Friction, ACS Appl. Mater. Interfaces, 2017, 9, 28019–28026 CrossRef CAS PubMed.
- J. F. Curry, T. Ohta, F. W. DelRio, P. Mantos, M. R. Jones, T. F. Babuska, N. S. Bobbitt, N. Argibay, B. A. Krick and M. T. Dugger, Structurally Driven Environmental Degradation of Friction in MoS2 Films, Tribol. Lett., 2021, 69, 1–10 CrossRef.
- N. S. Bobbitt and M. Chandross, Interactions of Water with Pristine and Defective MoS2, Langmuir, 2022, 38, 10419–10429 CrossRef CAS PubMed.
- R. Holinski and J. Gänsheimer, A Study of the Lubricating Mechanism of Molybdenum Disulfide, Wear, 1972, 19, 329–342 CrossRef CAS.
- X. Zhao, G. Zhang, L. Wang and Q. Xue, The Tribological Mechanism of MoS2 Film under Different Humidity, Tribol. Lett., 2017, 65, 1–8 CrossRef CAS.
- M. Uemura, K. Saito and K. Nakao, A Mechanism of Vapor Effect on Friction Coefficient of Molybdenum Disulfide, Tribol. Trans., 1990, 33, 551–556 CrossRef CAS.
- R. Addou, L. Colombo and R. M. Wallace, Surface Defects on Natural MoS2, ACS Appl. Mater. Interfaces, 2015, 7, 11921–11929 CrossRef CAS PubMed.
- D. Dubbeldam, S. Calero, D. E. Ellis and R. Q. Snurr, Raspa: Molecular Simulation Software for Adsorption and Diffusion in Flexible Nanoporous Materials, Mol. Simul., 2016, 42, 81–101 CrossRef CAS.
- Z. Gu, P. De Luna, Z. Yang and R. Zhou, Structural Influence of Proteins Upon Adsorption to MoS2 Nanomaterials: Comparison of MoS2 Force Field Parameters, Phys. Chem. Chem. Phys., 2017, 19, 3039–3045 RSC.
- W. L. Jorgensen, J. Chandrasekhar, J. D. Madura, R. W. Impey and M. L. Klein, Comparison of Simple Potential Functions for Simulating Liquid Water, J. Chem. Phys., 1983, 79, 926–935 CrossRef CAS.
- C. E. Wilmer, K. C. Kim and R. Q. Snurr, An Extended Charge Equilibration Method, J. Phys. Chem. Lett., 2012, 3, 2506–2511 CrossRef CAS PubMed.
- L. Zhang and J. I. Siepmann, Direct Calculation of Henry's Law Constants from Gibbs Ensemble Monte Carlo Simulations: Nitrogen, Oxygen, Carbon Dioxide and Methane in Ethanol, Theor. Chem. Acc., 2006, 115, 391–397 Search PubMed.
- E. Garcia-Perez, J. Parra, C. Ania, D. Dubbeldam, T. Vlugt, J. Castillo, P. Merkling and S. Calero, Unraveling the Argon Adsorption Processes in MFI-Type Zeolite, J. Phys. Chem., 2008, 112, 9976–9979 Search PubMed.
- D. Frenkel and B. Smit, Understanding Molecular Simulation: from Algorithms to Applications, Elsevier, Academic Press, 2002; vol. 1, pp. 1–638 Search PubMed.
- D. Burris and W. Sawyer, Addressing Practical Challenges of Low Friction Coefficient Measurements, Tribol. Lett., 2009, 35, 17–23 CrossRef.
- S. Shree, A. George, T. Lehnert, C. Neumann, M. Benelajla, C. Robert, X. Marie, K. Watanabe, T. Taniguchi and U. Kaiser, High Optical Quality of MoS2 Monolayers Grown by Chemical Vapor Deposition, 2D Mater., 2019, 7, 015011 CrossRef.
- S. Srivastava and Y. N. Mohapatra, Defect Density of States in Natural and Synthetic MoS2 Multilayer Flakes, J. Phys. D: Appl. Phys., 2022, 55, 345101 CrossRef.
- Z. He, R. Zhao, X. Chen, H. Chen, Y. Zhu, H. Su, S. Huang, J. Xue, J. Dai and S. Cheng, Defect Engineering in Single-Layer MoS2 Using Heavy Ion Irradiation, ACS Appl. Mater. Interfaces, 2018, 10, 42524–42533 CrossRef CAS PubMed.
- A. F. Ismail, K. C. Khulbe and T. Matsuura, Gas Separation Membranes, Switz. Springer, 2015, 10, 973–978 Search PubMed.
- G. Levita and M. C. Righi, Effects of Water Intercalation and Tribochemistry on MoS2 Lubricity: An Ab Initio Molecular Dynamics Investigation, ChemPhysChem, 2017, 18, 1475–1480 CrossRef CAS PubMed.
- G. Levita, E. Molinari, T. Polcar and M. C. Righi, First-Principles Comparative Study on the Interlayer Adhesion and Shear Strength of Transition-Metal Dichalcogenides and Graphene, Phys. Rev. B, 2015, 92, 085434 CrossRef.
- M. Matsunaga, K. Hoshimoto and Y. Uchiyama, Frictional Behaviour of Molybdenum Disulphide in High Vacuum, Wear, 1972, 22, 185–192 CrossRef CAS.
- M. Matsunaga and K. Hoshimoto, Frictional Behaviour of Molybdenum Disulphide in High Vacuum—Part II, Wear, 1976, 38, 371–384 CrossRef CAS.
Footnote |
| † Electronic supplementary information (ESI) available. See DOI: https://doi.org/10.1039/d3ra07984h |
| This journal is © The Royal Society of Chemistry 2024 |

