 Open Access Article
Extracting lignin from sugarcane bagasse for methylene blue and hexavalent chromium adsorption in textile wastewater: a facile, green, and sustainable approach†
Nhu Y. Nguyen-Thi *a,
Cuong Quoc Nguyen
 b,
Quang Le Dangc,
Quang De Tran
 b,
Tuyet Nhung Do-Thia and
Luong Huynh Vu Thanh*d
aCan Tho University of Technology, Can Tho 94000, Vietnam. E-mail: ntny@ctuet.edu.vn; Tel: +84-909-163-385
bDepartment of Chemistry, College of Natural Sciences, Can Tho University, Can Tho 94000, Vietnam
cInstitute for Tropical Technology, Vietnam Academy of Science and Technology, Hanoi 10072, Vietnam
dDepartment of Chemical Engineering, College of Engineering, Can Tho University, Can Tho 94000, Vietnam. E-mail: lhvthanh@ctu.edu.vn
First published on 2nd February 2024
Abstract
This study presents the process of extracting lignin from sugarcane bagasse collected in the Mekong Delta, Vietnam by the alkali method. NaOH has been used as an effective, environmentally friendly chemical to enhance the extraction process. The obtained lignin was applied for methylene blue (MB) and hexavalent chromium (Cr(VI)) removal. Factors influencing lignin extraction and adsorption processes of MB and Cr(VI) were investigated, showcasing the sustainable reusability of lignin extracted from sugarcane bagasse. Lignin characterization was also carried out by scanning electron microscopy (SEM), Fourier transform infrared spectroscopy (FT-IR) and thermogravimetric analysis (TGA) techniques. The results showed that the extracted lignin content reached 38.61% under optimal conditions (NaOH concentration of 10%, reaction temperature of 90 °C and reaction time of 90 min). The adsorption efficiency and capacity of lignin reached 90.90% and 9.09 mg g−1 for MB and 80.10% and 28.04 mg g−1 for Cr(VI), respectively, under optimum adsorption conditions (pH, adsorption time, initial methylene blue concentration, and used lignin content). The adsorption process obeyed Langmuir adsorption and was principally physical adsorption. These findings prove sugarcane bagasse based lignin as a cheap and efficient adsorbent for MB and Cr(VI) removal, which contributes to the utilization of the abundant agricultural by-product for wastewater treatment.
1. Introduction
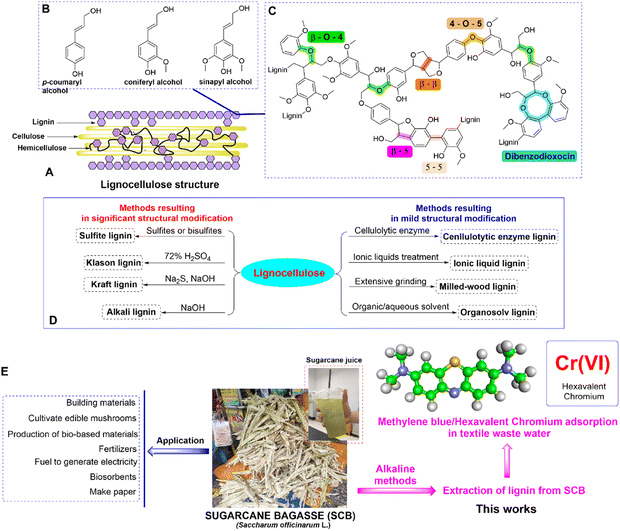
Lignocellulose has gained recognition due to its widespread presence in diverse biomass sources, including agricultural and forest remnants. This characteristic positions it as a compelling contender for viable biorefinery methodologies aimed at sustainability.1,2 The exploration of lignocellulose's potential offers considerable prospects in mitigating energy and environmental constraints by facilitating biofuel synthesis, the creation of biodegradable substances, and pioneering advancements within the domains of green chemistry and biotechnology. Lignocellulose is composed primarily of three major polymers: lignin, cellulose, and hemicellulose (Fig. 1A). Lignin provides rigidity and protection, cellulose offers mechanical strength, and hemicellulose contributes to the overall structure.3 Lignin, a renewable source of aromatic compounds, holds the potential to replace petroleum-derived benzene, toluene, and xylene compounds. So, lignin holds substantial promise as a foundational resource for generating bulk or modified aromatic compounds. Lignin is a natural complex biopolymer structure derived from plants, accounting for 12–39% in plant cells.3–7 Lignin used to be considered as a pollutant matter for a long time before being used in industrial polymers, chemistry, and environmental engineering. As a phenolic polymer, lignin has been used in a variety of fields like chemical synthesis, medicine, adhesives and environmental treatment.8–10 The exact structure of lignin currently is a challenge to scientists because it is dependent on plant sources, type of woods, and extraction methods (alkaline methods, ionic liquid method, etc.). Basically, lignin is an amorphous heteropolymer consisting of 3 main monomers: coniphenyl alcohol, sinapyl alcohol and p-coumaryl alcohol11 (Fig. 1B and C). Besides the two commercial products of lignin, soft-wood lignin and hard-wood lignin, studies of lignin derived from different sources, namely, grass,12 rice husk,13 sugarcane bagasse,14–17 and coconut fiber17 were published. The catalytic conversion of lignin remains an engrossing subject of scientific investigation, promising significant potential for progress (Fig. 1D).Sugarcane bagasse is an abundant by-product of sugar cane, a major short-term industrial crop in the provinces of the Mekong Delta. Sugarcane bagasse consists mostly of cellulose, accounting for 40–50%, followed by hemicellulose accounting for 20–30%, lignin accounting for 18–25% and a small component of other soluble substances like glucose, sucrose, etc. So far, biochar is well-known thanks to its porous structure and high specific surface area, which lead to its excellent potential applications in removal of a variety of inorganic and organic pollutants.18,19 Some studies on lignin derived from sugarcane bagasse have been conducted for environmental treatment applications.15–17,20
Methylene blue (MB) is one of the most common dyes being used in the production processes of textiles, dyeing and printing. These organic dyes are non-biodegradable, mutagenic, toxic and carcinogenic to humans.21 Therefore, it is necessary to find simple, efficient, and economical methods to treat dye wastewater. Chromium is found in various forms; the primary types include elemental chromium(0), chromium(III), and chromium(VI). Chromium(III) is naturally occurring and plays a crucial role as a nutrient for the human body.22 On the other hand, chromium(VI) is utilized in textile manufacturing as a catalyst for dyeing and as a dye for wool.23 It's important to note that hexavalent chromium (Cr(VI)) is marked as a human carcinogen by the International Agency for Research on Cancer (IARC).24 The use of chromate in textiles and leather tanning can contribute to or worsen contact dermatitis.24 Many technologies have been applied to treat organic wastewater, such as biological, chemical or physical methods. Among these techniques, adsorption is one of the most favored methods because of its low cost, ease of operation, lower energy consumption, simple setup, high efficiency and non-toxicity.18,19,21,25
This study was driven by the central objective of evaluating sugarcane bagasse-derived lignin's viability as an economical and ecologically friendly biosorbent for the efficient removal of MB and Cr(VI) from aqueous solutions (Fig. 1E). The work delved into the intricate interactions between lignin and MB/Cr(VI), with the overarching aim of unveiling a potent solution for pollution remediation by meticulously analyzing the adsorption dynamics and effectiveness of lignin in capturing MB/Cr(VI) molecules. So, the research not only aimed to propose a pragmatic strategy for water decontamination but also aimed to underscore the broader potential of lignin as a versatile resource with multifaceted environmental applications.
2. Experimental
2.1. Materials
Natural biomass resources (sugarcane bagasse, SCB) were collected from Can Tho and Hau Giang, Vietnam (see ESI†). All reagents were purchased from commercial sources and used without further purification. Other chemicals included NaOH (≥98%, pellets (anhydrous), Sigma-Aldrich Inc), H2SO4 (95–98%, Vietnam), methylene blue (≥95%, calc. to the dried substance, Sigma-Aldrich Inc) and deionized water (Vietnam).2.2. Lignin extraction process
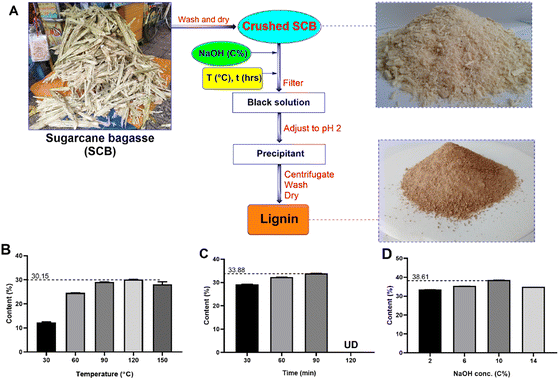
Influencing factors including NaOH solution concentration, reaction temperature, and reaction time were surveyed by the method of alternating each factor to determine the optimal lignin extraction process. First, SCB was chopped into a size of around 1 cm2 and boiled in distilled water at 70 °C for 2 h to remove sugar. After that, the SCB was dried at 60 °C for 24 h and crushed to approximately 0.5 mm. The crushed SCB was treated with NaOH solution (2–14%) at T (30–120 °C) for t (30–120 min), and then the solid was removed to obtain a black solution. Next, concentrated H2SO4 was slowly added into the black solution to form a yellow precipitant until the solution reached pH 2. Then the precipitate was centrifuged, washed several times with deionized water and dried at 60 °C for 24 h to obtain lignin.
 | (1) |
2.3. Lignin characterization
The morphology, structural and thermal characterization of lignin was performed by scanning electron microscopy (SEM), Fourier transform infrared spectroscopy (FTIR), and thermogravimetric analysis (TGA). FT-IR measurements were taken using an FT-IR Nicolet 6700 (Thermos). Each scan recorded 50 scans, in the range from 500 to 4000 cm−1 with a resolution of 4 cm−1. SEM images of the lignin sample were captured using a Hitachi-TM1000 Tabletop system (Japan). TGA was conducted using a NETZSCH TGA 209 F3 instrument, covering a temperature range of 100 °C to 700 °C, with a heating rate of 10 °C min−1.2.4. MB adsorption process
The MB adsorption process was examined following the method of alternating each variable to determine the optimal conditions for the whole process. First, a (g) of lignin was added to five 250 mL conical flasks containing 100 mL of b (mg L−1) MB solution. The pH was adjusted from 5 to 9 by using 0.1 N NaOH and 0.1 N HCl solutions, the MB concentration varied from 10 mg L−1 to 50 mg L−1 in 15–120 min and lignin mass from 5 to 50 mg. The MB concentration after the adsorption process was determined by ultraviolet-visible (UV-vis) measurement after separating the lignin by using a UV-vis/NIR Multiskan SkyHigh (Thermo Fisher).2.5. Cr(VI) adsorption process
The adsorption process of Cr(VI) was systematically examined similar to the adsorption process of MB. Specifically, a quantity of a (g) of lignin was introduced into each flask containing 100 mL of K2Cr2O7 solution with a concentration of b mg L−1. The pH of the solution was meticulously adjusted within the range of 2.0 to 6.0 using a 0.1 M NaOH and HCl solution. The hexavalent chromium content was determined from the calibration curve at 540 nm to determine the absorbance.2.6. Kinetic studies
The equilibrium adsorbed concentration, q, and adsorption efficiency, H%, were calculated according to the equations
 | (2) |
 | (3) |
Adsorption kinetics were identified following theoretical pseudo-first-order and pseudo-second-order models. Adsorption isotherms were analyzed according to the Langmuir (eqn (4)) and Freundlich (eqn (5)) models and adsorption type was identified by using the Dubinin–Radushkevich (D–R) model (eqn (6)).
 | (4) |
 | (5) |
ln![[thin space (1/6-em)]](https://www.rsc.org/images/entities/char_2009.gif) qe = ln qe = ln![[thin space (1/6-em)]](https://www.rsc.org/images/entities/char_2009.gif) qm − βε2 qm − βε2
| (6) |
![[thin space (1/6-em)]](https://www.rsc.org/images/entities/char_2009.gif) ln(1 + 1/qe), with T being the absolute temperature (K) and R being the universal gas constant), and β is a constant related to the adsorption energy.
ln(1 + 1/qe), with T being the absolute temperature (K) and R being the universal gas constant), and β is a constant related to the adsorption energy.
3. Results and discussion
3.1. Lignin extraction
Green chemistry represents a progressive paradigm in the realm of chemical science, with its primary emphasis directed toward the advancement of procedures and substances that yield favourable consequences for the environment. The principal focal point of green chemistry revolves around the reduction of detrimental substance employment, the enhancement of production protocols, and the conceptualization of commodities possessing facile recyclability and biodegradability. This paradigm not only serves environmental interests but also engenders economic and societal dividends. Within the scope of this work, the study endeavour revolves around harnessing agricultural by-products to address the exigencies of contaminated wastewater treatment. This approach adheres to an eco-conscious recycling protocol, circumventing the utilization of organic agents. The environmentally friendly recycling process avoids the use of organic solvents; the primary solvent employed in the research is water.Fig. 2A displays the lignin extraction process, which was a green and environmentally friendly technique for extraction of lignin. The process was based on the alkali method and the method of alternating each variable was examined. The lignin extraction efficiency is over 38%. In particular, this study shows that it is environmentally friendly and safe for technicians, which is suitable for large-scale production. Previously, lignin preparation studies have been carried out using formic acid, DES, soda/AQ, hydrotropes and organosolv, which required extreme conditions.26–28 Therefore, these processes are not suitable for the equipment and conditions in Vietnam.
3.2. Lignin characterization
For structural confirmation of prepared lignin, thermogravimetric analysis (TGA), scanning electron microscopy (SEM) and FTIR analysis were performed. SEM analysis showed that lignin particles were in the shape of a polyhedron (Fig. 3A). The size of particles distributed in a wide range from 0.1 to 2.0 μm. Based on this fact, it can be concluded that extracted lignin presents an adequate morphology for hydrophobic constituent adsorption. Infrared spectroscopy is currently one of the important analytical techniques available to analyze almost any type of sample. The FTIR spectra are presented in Fig. 3B. The presence of characteristic peaks in FTIR spectra indicates the presence of lignin on the sample, such as the peaks centered at 3393 cm−1 (phenolic and aliphatic –OH), 2923 cm−1 (C–H stretching), 1710 cm−1 (C![[double bond, length as m-dash]](https://www.rsc.org/images/entities/char_e001.gif) O stretching vibration of ester, carbonyl and non-conjugated ketone), 1515 cm−1 (C–C aromatic skeleton), 1460 cm−1 (C–H asymmetry), 1246 cm−1 (C–C guaiacyl aromatic ring), 1000–1150 cm−1 (strength vibration of C–OH side groups and the C–O–C glycosidic), and 831 cm−1 (–CH bending in aromatic ring). The data from the FTIR spectroscopy show agreement and similarity with the recently published results for lignin prepared from agricultural by-products and wastes.29,30 Thermogravimetric analysis was performed from room temperature to 700 °C (Fig. 3C and see ESI†). The TGA curve presented that thermal degradation of lignin could be divided into 4 temperature ranges of 30–700 °C. Range I (30–140 °C) is related to moisture in lignin particles. There are very few peaks occurring in the range of 180–250 °C. This proved that lignin particles contained very little hemicellulose content. The results showed that lignin degradation took place slowly over a wide temperature range. The decomposition took place fastest at 280–370 °C. This could be explained by the complex structure of lignin with phenolic, carbonyl, and benzylic hydroxyl groups linked together. Char and coke were made at high temperature (range IV).
O stretching vibration of ester, carbonyl and non-conjugated ketone), 1515 cm−1 (C–C aromatic skeleton), 1460 cm−1 (C–H asymmetry), 1246 cm−1 (C–C guaiacyl aromatic ring), 1000–1150 cm−1 (strength vibration of C–OH side groups and the C–O–C glycosidic), and 831 cm−1 (–CH bending in aromatic ring). The data from the FTIR spectroscopy show agreement and similarity with the recently published results for lignin prepared from agricultural by-products and wastes.29,30 Thermogravimetric analysis was performed from room temperature to 700 °C (Fig. 3C and see ESI†). The TGA curve presented that thermal degradation of lignin could be divided into 4 temperature ranges of 30–700 °C. Range I (30–140 °C) is related to moisture in lignin particles. There are very few peaks occurring in the range of 180–250 °C. This proved that lignin particles contained very little hemicellulose content. The results showed that lignin degradation took place slowly over a wide temperature range. The decomposition took place fastest at 280–370 °C. This could be explained by the complex structure of lignin with phenolic, carbonyl, and benzylic hydroxyl groups linked together. Char and coke were made at high temperature (range IV).
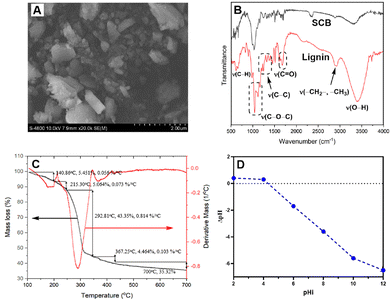 | ||
| Fig. 3 SEM image (A), FTIR spectra (B), TGA plot (C) and pHpzc plot (D) of SCB-based lignin (SCB: sugarcane bagasse). | ||
3.3. Identification of the point of zero charge (PZC)
The PZC graph showed that pHpzc was 4.4 (Fig. 3D). This indicates that in a solution with pH < pHpzc, H+ is predominant, making the surface of the adsorbent material carry a positive charge, resulting in better anion adsorption. Similarly, when solution pH is higher than pHpzc, the surface of the material has a negative charge and the ability to adsorb cations will be better.3.4. Removal of MB using lignin
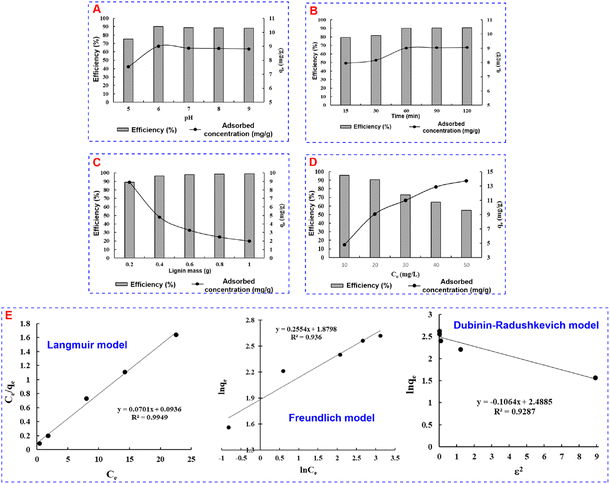
In general, the MB adsorption efficiency of lignin was relatively high (above 75%). The adsorption efficiency increased from over 75% at pH 5 to over 90% at pH 6. This was consistent with zero-point charge analysis. This could be explained by competitive adsorption. pH 5 caused a competitive adsorption of H+ ions with MB+ cations, leading to low MB adsorption efficiency. At pH 6, H+ gradually decreased and was replaced by OH−, and competitive adsorption decreased. Therefore, the adsorption efficiency was higher. However, the adsorption efficiency decreased when the pH was higher than 6, and the reduction was considered insignificant, which could be explained by the lignin solubility in alkaline. Therefore, pH 6 with the highest adsorption efficiency and adsorption capacity was chosen for next surveys.
The MB kinetic model parameters of lignin following the hypothetical adsorption models are shown in Table 1. In the first-order hypothetical equation, the correlation coefficient showed a high consistency between the parameters with the monolayer adsorption of MB on the surface of lignin material (R2 = 0.9949), corresponding to maximum adsorption capacity, qm, 14.26 mg g−1. In the second-order hypothetical equation, the correlation coefficient R2 of 0.936 indicated that the adsorption process occurred partly due to the weak binding forces between the adsorbent and the adsorbate. This confirmed that the MB adsorption onto lignin followed the first-order adsorption kinetics and Langmuir isotherm model.
| Pseudo first order | Pseudo second order | |||||
|---|---|---|---|---|---|---|
| qm (mg g−1) | KL (gm3 mg−1) | R2 | 1/n | KF ((mg g−1) (dm3 mg−1)1/n) | R2 | |
| MB adsorption | 14.26 | 0.75 | 0.9949 | 0.255 | 75.82 | 0.9360 |
| Cr(VI) adsorption | 35.27 | 0.28 | 0.9989 | 0.1329 | 982.36 | 0.9072 |
To determine whether the nature of MB adsorption is physical or chemical adsorption, the D–R isotherm model was applied. The D–R model and parameters are presented in Fig. 3E and Table 2. The average adsorption energy E of 2.17 kJ mol−1 (<8 kJ mol−1) indicated that the MB adsorption process of lignin was a physical adsorption process.31,32 However, a correlation coefficient R2 of 0.9287 is not too high; this could be a little comparative chemical adsorption taking place parallelly along with physical adsorption.
| qm (mg g−1) | R2 | B (mol2 J−2S) | E (kJ mol−1) | |
|---|---|---|---|---|
| MB adsorption | 12.04 | 0.9287 | 0.1046 | 2.17 |
| Cr(VI) adsorption | 32.95 | 0.9467 | 5.6528 | 0.30 |
MB adsorption capacity for each material has different values. This study contributes a new type of adsorbent originating from local farming for methylene blue removal.
3.5. Removal of Cr(VI) using lignin
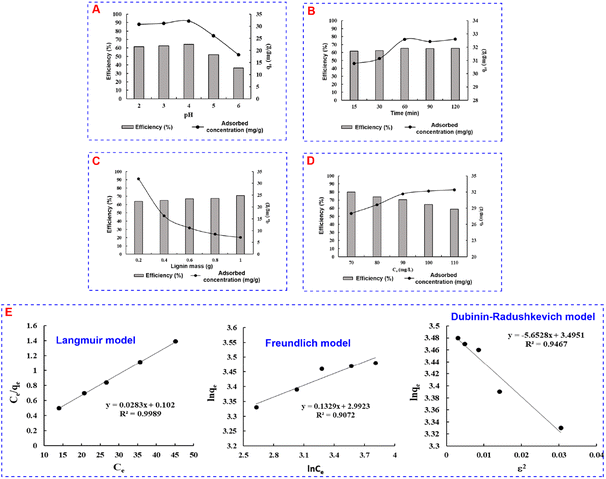
Likewise, the adsorption capacity exhibits a progressive increase from 30.77 mg g−1 to 31.14 mg g−1 and further to 32.59 mg g−1 at 15, 30, and 60 minutes, respectively. Beyond this interval, a plateau in adsorption capacity at 90 and 120 minutes signifies that the lignin surface approaches saturation. Thus, after 60 minutes of adsorption, the process was deemed nearly complete and no further extensions in time resulted in a significant improvement in adsorption capacity.
On the contrary, the adsorption capacity displays more subdued variability, showing a gradual increase as the adsorption concentration augments. The maximum in adsorption capacity is observed at a concentration of 110 mg L−1 (qe = 32.41 mg g−1), while the minimum is observed at 70 mg L−1 (qe = 28.04 mg g−1). From the start, lignin manifests a relatively robust adsorption capacity across the investigated concentration, suggesting substantial surface occupancy by adsorbed species. When the concentration reaches 100 mg L−1, almost complete adsorption has transpired. Consequently, further escalation to 110 mg L−1 induces marginal changes in adsorption capacity. In light of these analyses, a concentration of Cr(VI) solution of 100 mg L−1 is deemed optimal for adsorption, as it aligns with both a relatively high adsorption efficiency and a stable adsorption capacity.
3.6. Recycling test
Lignin regeneration was systematically conducted up to six times, as represented in similar previous research.33 The results are depicted in Fig. 6. In the first two runs, the removal efficiency exhibited remarkable performance, achieving over 99% and over 98%, respectively. However, as the process continued, a gradual decline was observed, with the removal efficiency slightly diminishing to 95% and 96% in the fifth and sixth iterations, respectively. In another recent study, coal-based activated carbons from three types of long-flame coals with varying ash and volatile matter content were prepared for efficient regeneration, yielding a consistent over 98% MB removal efficiency after five cycles.33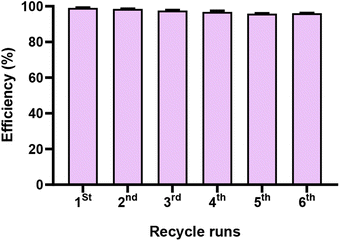 | ||
| Fig. 6 The regeneration performance of the lignin sourced from sugarcane bagasse. Values are shown after two independent tests (±SD). | ||
In summary, this finding underscores the significant economic advantage associated with the utilization of lignin sourced from sugarcane bagasse for the elimination of harmful dyes, as exemplified in this research with MB as the model pollutant. It emphasizes the cost-effectiveness and sustainability of lignin-based treatment methods, highlighting their potential for addressing environmental and industrial challenges related to dye removal.
4. Conclusions
Our research successfully extracted lignin from sugarcane bagasse, a by-product in the Mekong Delta, Vietnam, and applied it to MB and Cr(VI) adsorption. In this study, lignin was observed to be polyhedron particles in shape and micro particles in size. Optimal conditions for the lignin separation process and MB/Cr(VI) adsorption were determined. NaOH has been used in several studies as an effective, environmentally friendly chemical to enhance the extraction of lignin. Lignin extracted from bagasse gave a MB adsorption efficiency of 90.09% and Cr(VI) adsorption efficiency of 80.10% according to Langmuir adsorption and physical adsorption models. With such a high adsorption capacity, facile and cost-effective method, lignin could be an efficient adsorbent for removal of heavy metal, inorganic and organic pollutants.Author contributions
N. Y. N. T.: project administration, supervision, and writing – review and editing; C. Q. N.: data curation, designing, and writing – original draft; Q. L. D.: methodology; Q. D. T.: methodology; T. N. D. T.: review and editing; L. H. V. T.: project administration. All authors have reviewed and approved the final draft.Conflicts of interest
There are no conflicts to declare.Acknowledgements
We thank Can Tho University for providing lab facilities and equipment support.References
- Y. K. Nandabalan, M. U. T. Mohamed, S. Sachdeva and S. Thakur, Fermentation, 2023, 9, 238 CrossRef.
- Z. Gao, K. Alshehri, Y. Li, H. Qian, D. Sapsford, P. Cleall and M. Harbottle, Renewable Sustainable Energy Rev., 2022, 170, 112995 CrossRef CAS.
- M. Mariana, T. Alfatah, A. K. HPS, E. B. Yahya, N. Olaiya, A. Nuryawan, E. Mistar, C. Abdullah, S. Abdulmadjid and H. Ismail, J. Mater. Res. Technol., 2021, 15, 2287–2316 CrossRef CAS.
- A. Duval and M. Lawoko, React. Funct. Polym., 2014, 85, 78–96 CrossRef CAS.
- S.-J. Jung, S.-H. Kim and I.-M. Chung, Biomass Bioenergy, 2015, 83, 322–327 CrossRef CAS.
- J. C. Carvajal, Á. Gómez and C. A. Cardona, Bioresour. Technol., 2016, 214, 468–476 CrossRef CAS PubMed.
- S. Al Arni, Ind. Crops Prod., 2018, 115, 330–339 CrossRef.
- M. Vinardell, V. Ugartondo and M. Mitjans, Ind. Crops Prod., 2008, 27, 220–223 CrossRef CAS.
- P. Carrott and M. R. Carrott, Bioresour. Technol., 2007, 98, 2301–2312 CrossRef PubMed.
- D. Stewart, Ind. Crops Prod., 2008, 27, 202–207 CrossRef CAS.
- D. A. Baker, N. C. Gallego and F. S. Baker, J. Appl. Polym. Sci., 2012, 124, 227–234 CrossRef CAS.
- P. Mousavioun and W. O. Doherty, Ind. Crops Prod., 2010, 31, 52–58 CrossRef CAS.
- S. H. Ghaffar and M. Fan, Biomass Bioenergy, 2013, 57, 264–279 CrossRef CAS.
- S. Jose, L. Mishra, G. Basu and A. Kumar Samanta, J. Nat. Fibers, 2017, 14, 510–518 CAS.
- J. C. del Río, A. G. Lino, J. L. Colodette, C. F. Lima, A. Gutiérrez, Á. T. Martínez, F. Lu, J. Ralph and J. Rencoret, Biomass Bioenergy, 2015, 81, 322–338 CrossRef.
- H. D. Utomo, R. Y. N. Phoon, Z. Shen, L. H. Ng and Z. B. Lim, Nat. Resour., 2015, 6, 209 Search PubMed.
- M. Brienzo, W. Carvalho and A. M. Milagres, Appl. Biochem. Biotechnol., 2010, 162, 1195–1205 CrossRef CAS PubMed.
- K. Wang, Y. Wang, S. Zhang, R. Wang and S.-H. Ho, Environ. Sci. Ecotechnology, 2022, 10, 100168 CrossRef CAS PubMed.
- M. Du, Y. Zhang, Z. Wang, M. Lv, A. Tang, Y. Yu, X. Qu, Z. Chen, Q. Wen and A. Li, Chem. Eng. J., 2022, 442, 136147 CrossRef CAS.
- T. C. Andrade Siqueira, I. Zanette da Silva, A. J. Rubio, R. Bergamasco, F. Gasparotto, E. Aparecida de Souza Paccola and N. Ueda Yamaguchi, Int. J. Environ. Res. Public Health, 2020, 17, 526 CrossRef PubMed.
- M. Mohammed, A. Shitu and A. Ibrahim, Res. j. chem. sci., 2014, 2231, 606X Search PubMed.
- Office of Dietary Supplements – Chromium, https://ods.od.nih.gov/factsheets/Chromium-HealthProfessional/, accessed October 1, 2023 Search PubMed.
- Chromium in fabrics, https://oecotextiles.blog/2013/02/28/chromium-in-fabrics/, accessed October 2, 2023 Search PubMed.
- J. P. Wise, J. L. Young, J. Cai and L. Cai, Environ. Int., 2022, 158, 106877 CrossRef CAS PubMed.
- N. Kannan and M. M. Sundaram, Dyes Pigm., 2001, 51, 25–40 CrossRef CAS.
- D. Watkins, M. Nuruddin, M. Hosur, A. Tcherbi-Narteh and S. Jeelani, J. Mater. Res. Technol., 2015, 4, 26–32 CrossRef CAS.
- D. Tian, R. P. Chandra, J.-S. Lee, C. Lu and J. N. Saddler, Biotechnol. Biofuels, 2017, 10, 1–10 CrossRef PubMed.
- T. Yimtrakarn, W. Kaveevivitchai, W.-C. Lee and N. Lerkkasemsan, Polymers, 2022, 14, 814 CrossRef CAS PubMed.
- R. Md Salim, J. Asik and M. S. Sarjadi, Wood Sci. Technol., 2021, 55, 295–313 CrossRef CAS.
- R. Nandanwar, A. Haldar, A. Chaudhari and J. Ekhe, J. Chem., Biol. Phys. Sci., 2016, 666, 958–969 Search PubMed.
- A. Kangmennaa, S. Acquah, R. B. Forkuo, J. K. Adusei, G. A. Atongo, F. A. Amarh, F. Opoku and E. S. Agorku, J. Dispersion Sci. Technol., 2024, 1–14 CrossRef.
- N. Hasani, T. Selimi, A. Mele, V. Thaçi, J. Halili, A. Berisha and M. Sadiku, Molecules, 2022, 27, 1856 CrossRef CAS PubMed.
- T. Niu, J. Zhou, C. Zhang and S. Li, RSC Adv., 2018, 8, 26978–26986 RSC.
Footnote |
| † Electronic supplementary information (ESI) available. See DOI: https://doi.org/10.1039/d3ra08007b |
| This journal is © The Royal Society of Chemistry 2024 |

