 Open Access Article
Adsorption of hexavalent chromium from wastewater using polyaniline-coated microcrystalline cellulose nanocomposites
Lovejoy Dewaa,
Shepherd Masimba Tichapondwab and
Washington Mhike *a
*a
aPolymer Technology Division, Department of Chemical, Metallurgical and Materials Engineering, Tshwane University of Technology, Pretoria 0001, South Africa. E-mail: MhikeW@tut.ac.za; Tel: +27 12 382 5460
bWater Utilization Division, Department of Chemical Engineering, University of Pretoria, Pretoria 0001, South Africa
First published on 22nd February 2024
Abstract
In this study, the effectiveness of microcrystalline cellulose (MCC) as an adsorbent for the removal of hexavalent chromium, Cr(VI), from synthetic wastewater was enhanced through functionalization with polyaniline (PANI). Scanning electron microscopy (SEM) showed that MCC was an effective scaffold for in situ chemical oxidative polymerization of aniline. Fourier transform infrared spectroscopy (FTIR) spectroscopy and X-ray diffraction confirmed successful PANI synthesis. The MCC/PANI nanocomposites exhibited relatively high specific surface areas, compared to that of the MCC (2.05 m2 g−1). Batch adsorption studies showed that the optimal conditions for the removal of Cr(VI) from wastewater using the MCC/PANI-69 wt% nanocomposite were an initial Cr(VI) concentration of 100 mg L−1, an adsorbent dosage of 4 g L−1 and a Cr(VI) solution pH of 7. The MCC/PANI-69 wt% required only 30 min to reach equilibrium and the equilibrium removal efficiency was 95%. FTIR spectroscopy and energy dispersive X-ray spectrometry results suggest that the Cr(VI) removal mechanism by the MCC/PANI-69 wt% nanocomposite at pH 7 was through electrostatic attraction of Cr(VI) species by PANI, reduction of Cr(VI) into Cr(III) and precipitation of Cr(III) on the nanocomposite surface. The kinetics for the removal of the Cr(VI) by the MCC/PANI-69 wt% nanocomposite were adequately described by the pseudo second order (PSO) kinetics model, whereas the Langmuir isotherm adequately described the equilibrium data. The MCC/PANI-69 wt% nanocomposite had a significantly improved maximum adsorption capacity of 35.97 mg g−1, at pH 7, in comparison to that of the MCC (3.92 mg g−1 at pH 1). The study demonstrated that, whereas most of the reported adsorbents for Cr(VI) are only effective at low pH values, the MCC/PANI nanocomposite synthesized in this study was effective at pH 7.
1 Introduction
Cr(VI) is a highly toxic and persistent pollutant in aqueous environments due to its oxidizing strength, solubility, non-biodegradability and mobility.1 Various industrial and anthropogenic activities contribute to Cr(VI) pollution of freshwater bodies. For instance, processes which are used in the ferrochrome industry unintentionally generate Cr(VI)- containing waste and wastewater that contaminate fresh water bodies.2 Cr(VI) compounds are also widely used in leather tanning, manufacture of pigments, electroplating, manufacture of chromic acid and speciality chemicals.3 Lack of treatment or inadequate treatment of Cr(VI) effluents which are then discharged into fresh water bodies are the main causes of Cr(VI) pollution of freshwater sources.4–6Presently, most of the available water treatment methods are not capable of effectively removing Cr(VI) present in water at trace concentration levels.7 These processes also have several other disadvantages.2,8,9
In an effort to meet stringent regulations such as the maximum limit of 0.05 mg L−1 for Cr(VI) in drinking water recommended by the World Health Organization (WHO), adsorption has drawn immense interest.7,10 Adsorption is considered as an effective, efficient and economic remediation method for heavy metal contaminated water and wastewater which offers flexibility in design and operation. In some instances, it might also be possible to regenerate the adsorbents.11 However, the feasibility and cost effectiveness of adsorption in water treatment is dependent on the availability of low cost, high selective and efficient adsorbents.12 Conventional commercial adsorbents such as activated carbons, silica gel, activated alumina, zeolites, clays are relatively expensive for remediation of Cr(VI) present in water in trace quantities.7,12
Alternative non-conventional adsorbents which are products and by-products of biological, industrial processes and of agricultural origin have been proposed and studied as inexpensive and efficient adsorbents.13 Several microbial, plant and animal biomasses and their derivatives have been studied as biosorbents, adsorbents that are based on biological matrices (biomass). These include polysaccharides such as starch, chitin, chitosan and cellulose.14
Compared to conventional adsorbents, biosorbents are relatively inexpensive, readily available in large quantities and abundant in nature. They are potentially able to remove heavy metals from water with minimal generation of toxic sludge. However, their greatest advantage is that they are environmentally friendly as they are biodegradable, and thus they are easily disposed, after use.13–15 Several studies have demonstrated the effectiveness of plant-based biosorbents in the removal of Cr(VI).13
Cellulose is the most abundant natural polymer on earth.16 It is a semicrystalline polysaccharide that contains hydroxyl functional groups on its molecular chain structure. Microcrystalline cellulose (MCC) is purified, partially depolymerized cellulose.17 Cellulose-based materials are often considered for use as biosorbents due to their relatively low cost and abundance.18
Cellulose and similarly MCC, lack functional groups that are able to complex heavy metals and other pollutants. As a result, there have been a few studies on the use of pristine MCC as an adsorbent.19 However, the prevalence of hydroxyl groups on cellulose and MCC structures enables them to be modified and functionalized to target specific pollutants.20
Polyaniline (PANI) is one of the most widely studied intrinsically conducting polymers (ICP).21 PANI has also been studied as an adsorbent for water treatment.22 Its monomer is relatively inexpensive, it is easily synthesized and tuned.21 PANI contains amine and imine functional groups that are able to interact with some metal ions and other pollutants due to their strong affinity to nitrogen atoms. Hence PANI is highly efficient in removing heavy metals from aqueous solutions.23 However, its particles easily aggregate during their synthesis. This reduces its specific area and limits its adsorption capacity and practical application. The regeneration of PANI particles is also a challenge.23 PANI particles are also difficult to disperse in aqueous media.24 The fabrication of nanocomposites of PANI with other adsorbents has been explored as a solution towards adsorbents with better adsorption capacities, chemical and thermal stability, good regeneration ability, and selectivity towards heavy metals.23
The aim of this study was to develop inexpensive, effective adsorbents for wastewater treatment based on cellulose. The objective of the study was to enhance the effectiveness of MCC in the removal of Cr(VI), from wastewater through its modification and functionalization with PANI. In the study, MCC was coated with PANI through in situ chemical oxidative polymerization of aniline. The PANI coated MCC was then applied in batch adsorption studies on the removal of Cr(VI) from synthetic wastewater.
This work introduces a novel work of fabricating MCC/PANI nanocomposites through in situ polymerization of PANI, thereby utilizing MCC as an effect scaffold for the synthesis of PANI. It is envisaged that the study will contribute to the development of biodegradable, cost effective and efficient biosorbents for the removal of Cr(VI) at neutral pH.
2 Materials and methods
2.1 Materials
The MCC used in the study was grade Avicel 101 with a d50 particle size of 65 μm supplied by JRS Pharma industry, India. Aniline (99.5%), para-toluene sulphonic acid (98.5%) and 1,5-diphenylcarbazide (98.0%) were supplied by Sigma Aldrich, South Africa. Ammonium persulphate (99.0%), potassium chromate (99.0%), hydrochloric acid (37%), ethanol (99.9%), acetone (AR) and sodium hydroxide pellets (98%) were supplied by Glassworld, South Africa. All the reagents were of analytical grade and were used as received. All solutions were prepared with deionized water.2.2 Methods
The MCC/PANI nanocomposites were prepared via in situ chemical oxidative polymerization of aniline in the presence of MCC. The compositions of the MCC/PANI nanocomposites which were synthesized in the study ranged from 9–75 wt% PANI, these are shown in Table 1. 5 g of MCC was used in the preparation of each nanocomposite. The PANI formed in this study was assumed to be completely protonated. It was also assumed that the protonated nitrogen atoms were associated with counter anions from the PTSA dopant.25 Hence the repeat unit molecular weight of the PANI-PTSA was determined as 706 g mol−1, which enabled the determination of the theoretical mass of PANI formed, using the reaction scheme proposed by Stejskal et al.25 In the synthesis of each nanocomposite, an appropriate amount of ammonium persulfate (APS) powder corresponding to a molar ratio of 1.25 with respect to aniline was separately completely dissolved in 50 mL of deionized water by stirring. The polymerization was then conducted as described in the paragraph above.
| Sample | PANI (wt%) | Aniline (mL) | Aniline (mol) | APS (mol) | APS (g) | PANI (mol) | PANI (g) |
|---|---|---|---|---|---|---|---|
| MCC/PANI-9 wt% | 9 | 0.25 | 0.00269 | 0.00336 | 0.766 | 0.00067 | 0.47 |
| MCC/PANI-16 wt% | 16 | 0.50 | 0.00538 | 0.00672 | 1.532 | 0.00134 | 0.95 |
| MCC/PANI-28 wt% | 28 | 1.00 | 0.01075 | 0.01344 | 3.065 | 0.00269 | 1.90 |
| MCC/PANI-36 wt% | 36 | 1.50 | 0.01613 | 0.02016 | 4.597 | 0.00403 | 2.85 |
| MCC/PANI-43 wt% | 43 | 2.00 | 0.02151 | 0.02688 | 6.129 | 0.00538 | 3.80 |
| MCC/PANI-53 wt% | 53 | 3.00 | 0.03226 | 0.04032 | 9.194 | 0.00806 | 5.69 |
| MCC/PANI-60 wt% | 60 | 4.00 | 0.04301 | 0.05376 | 12.258 | 0.01075 | 7.59 |
| MCC/PANI-65 wt% | 65 | 5.00 | 0.05376 | 0.06720 | 15.323 | 0.01344 | 9.49 |
| MCC/PANI-69 wt% | 69 | 6.00 | 0.06452 | 0.08065 | 18.387 | 0.01613 | 11.39 |
| MCC/PANI-75 wt% | 75 | 8.00 | 0.08602 | 0.10753 | 24.516 | 0.02151 | 15.18 |
The morphologies of the neat MCC, PANI and the MCC/PANI nanocomposites were analysed on a ZEISS crossbeam 540 field emission gun scanning electron microscope (FESEM) using an accelerating voltage of 2.0 kV. Elemental compositions of the materials were analysed using energy dispersive X-ray (EDX) spectrometry coupled to the FESEM. The specific surface area and pore characteristics of the MCC, PANI and the MCC/PANI nanocomposites were evaluated using a Micromeritics TriStar II surface area and porosity analyser. The crystallinity of the MCC, PANI and the MCC/PANI nanocomposites was analysed using a PAnalytical X'Pert Pro powder X-ray diffractometer using Cu-Kα radiation in the 2θ range 0° and 90°. The point of zero charge (pHpzc) of the MCC was determined by the salt addition method as described by Bakatula et al.26
Batch adsorption experiments were conducted at standard room temperature conditions using the MCC as an adsobent for the removal of Cr(VI) from the synthetic wastewater. All experiments were conducted in duplicates and the average results reported. The experiments were conducted in 250 mL glass bottles using 50 mL of the Cr(VI) solution. The bottles were agitated at 150 rpm using a mechanical shaker for a predetermined period obtained from initial kinetics results. Process parameters such as the adsobent dosage, initial Cr(VI) concentrations, contact time, and solution pH were optimized by changing one variable at a time and maintaining all the others constant.
The Cr(VI) residual concentrations in the synthetic wastewater after adsorption were determined using the standard ultraviolet-visible (UV-Vis) spectrophotometric method described by Eaton and Franson using a WPA, Lightwave II, Labotec UV-Vis spectrophotometer at a wavelength of 540 nm.27
The maximum amount of Cr(VI) adsorbed by the MCC adsorbent for each run, were determined using eqn (1):
 | (1) |
 | (2) |
To study the effect of the MCC dosage on the removal of Cr(VI), the amount of MCC was varied from 2.5 g L−1 to 80 g L−1. In this experiment, the initial concentration of the chromate solution was kept constant at 10 mg L−1, a contact time of 120 h was used, based on the initial kinetics results. The optimum MCC dosage which yielded the best removal efficiency/capacity was 20 g L−1, this was used in subsequent experiments.
The MCC maximum adsorption capacity for Cr(VI) was determined through equilibrium isotherm studies. These were carried out using varying initial concentrations of Cr(VI) solutions which ranged from 10 to 100 mg L−1 while maintaining the MCC dosage at the determined optimum loading of 20 g L−1. The effect of solution pH on the removal of Cr(VI) from solution by the MCC was investigated in the pH range 1–9, using a Cr(VI) concentration of 10 mg L−1 and the determined MCC optimum loading of 20 g L−1. The pH of the solution was adjusted by addition of HCl or NaOH solution (0.01–5.0 mol L−1) using a pH meter with a resolution of ±0.05 pH.
Batch adsorption kinetics data for the adsorption of Cr(VI) by MCC were obtained by varying the contact time from 0–144 h with an initial Cr(VI) concentration of 10 mg L−1 and adsorbent dosage of 20 g L−1.
The effect of the MCC/PANI nanocomposites adsorbent dosage on the Cr(VI) removal was studied by using varying amounts of the 69 wt% PANI nanocomposite (MCC/PANI-69 wt%) to treat 50 mL synthetic wastewater with a concentration of 100 mg L−1 Cr(VI) concentration at pH 7 for 24 h. An optimum adsobent dosage of 4 g L−1 was selected for further studies, after these experiments.
The effect of the contact time on the removal of Cr(VI) by the MCC/PANI-69 wt% nanocomposite was studied in the range 0–180 min at pH 7 and room temperature in order to determine the adsorption kinetics. 200 mg of the MCC/PANI-69 wt% nanocomposite was mixed with 50 mL of Cr(VI) solution in 250 mL glass bottles having concentrations of 100, 200 and 300 mg L−1. The bottles were then agitated at 150 rpm using a mechanical shaker. Samples were drawn at various time intervals and the residual Cr(VI) concentration was analysed using the UV-Vis spectrophotometric method described in §2.2.2. The removal efficiency at different time intervals was determined using eqn (2).
The effect of the initial Cr(VI) concentration on the removal of Cr(VI) from the synthetic wastewater by the MCC/PANI-69 wt% nanocomposite was studied in the Cr(VI) solution concentration range 100–500 mg L−1, leading to the determination of the adsorption isotherms. This was done by using the optimum MCC/PANI-69 wt% nanocomposite adsorbent dosage of 4 g L−1 to treat the Cr(VI) solution at pH 7. To attain equilibrium, the glass bottles containing the adsorbent and the Cr(VI) solution were agitated on a shaker at 150 rpm for 180 min. After equilibrium was attained, the residual Cr(VI) concentration was analysed using the UV-Vis spectrophotometric method described in §2.2.2. To determine the amount of Cr(VI) adsorbed, the equilibrium adsorption capacity was calculated using eqn (1). All experiments were conducted in duplicates and the average results reported.
3 Results and discussion
3.1 Characterization of the MCC, PANI and MCC/PANI nanocomposites
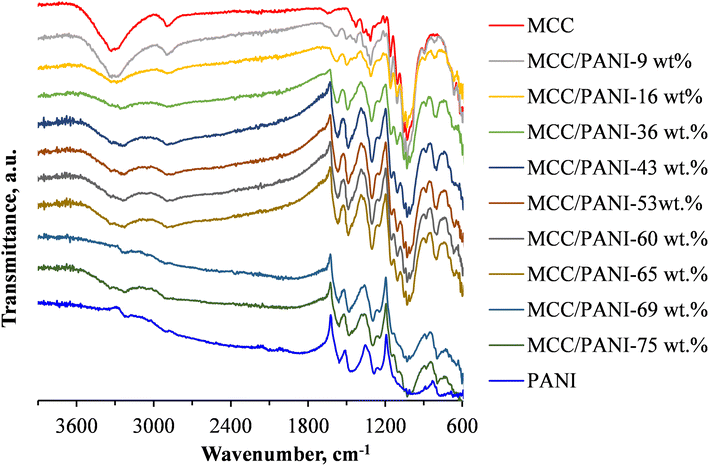
Fig. 1 also shows the FTIR spectra of the p-toluene sulphonic acid (PTSA) doped polyaniline (PANI) synthesized in this study. The FTIR spectra of the PANI/PTSA salt in Fig. 1 shows several characteristic infrared adsorption bands exhibited by PANI salts, confirming successful synthesis of PANI in this study.28 The FTIR spectra bands corresponding to N–H vibrations in PANI were observed in the range 3400–3200 cm−1.29 In the FTIR spectra of the PANI/PTSA salt in Fig. 1, the band at ca. 3230 cm−1 is attributed to the protonated amine segments in PANI. The bands at ca. 1560 and 1460 cm−1 are ascribed to the ring stretching of the quinoid (N![[double bond, length as m-dash]](https://www.rsc.org/images/entities/char_e001.gif) Q
Q![[double bond, length as m-dash]](https://www.rsc.org/images/entities/char_e001.gif) N) and benzenoid (N–B–N) structures in PANI, respectively. B and Q denote benzenoid and quinoid moieties in the PANI chains.28 The bands at ca. 1284 and 1240 cm−1 are due to the C–N stretching of aromatic amines in PANI.28 The band at about ca. 1000 cm−1 was attributed to vibrational modes of B–H+
N) and benzenoid (N–B–N) structures in PANI, respectively. B and Q denote benzenoid and quinoid moieties in the PANI chains.28 The bands at ca. 1284 and 1240 cm−1 are due to the C–N stretching of aromatic amines in PANI.28 The band at about ca. 1000 cm−1 was attributed to vibrational modes of B–H+![[double bond, length as m-dash]](https://www.rsc.org/images/entities/char_e001.gif) Q or B–NH+–B, formed during PANI doping reactions.24 This band is due to the interaction between the PANI polymer chain and the dopant (PTSA).30 The band at ca. 790 cm−1 corresponds to the out of plane bending vibration of the C–H aromatic bond in the 1,4 disubstituted benzene ring.24 The band at ca. 670 cm−1 was due to the vibrations of the S–O groups in the dopant, PTSA.30
Q or B–NH+–B, formed during PANI doping reactions.24 This band is due to the interaction between the PANI polymer chain and the dopant (PTSA).30 The band at ca. 790 cm−1 corresponds to the out of plane bending vibration of the C–H aromatic bond in the 1,4 disubstituted benzene ring.24 The band at ca. 670 cm−1 was due to the vibrations of the S–O groups in the dopant, PTSA.30
Fig. 1 shows that the intensity of the infrared absorption band at ca. 3350 cm−1 attributed to the stretching of OH groups in MCC decreased with an increase in the PANI content of the MCC/PANI nanocomposites. This observation implies that there was interfacial interaction between the OH groups of the MCC and the PANI, possibly through hydrogen bonding with the PANI nitrogen groups. Li et al. previously showed using X-ray photoelectron spectroscopy that PANI and cellulose interacted through hydrogen bonding, demonstrating their good compatibility which is expected to stabilize the nanocomposites in aqueous media.31 Fig. 1 also shows that the intensity of the band at ca. 3230 cm−1 attributed to the protonated amine segments in PANI increased with an increase in the PANI content of the nanocomposites.
Another observation from Fig. 1 was that the band at ca 1000 cm−1 observed in PANI narrowed as the MCC content of the nanocomposites was increased. As discussed in the preceding paragraph, this band was an indication of the occurrence of protonated amine/imine groups in the PANI.
| Sample | BET surface area, m2 g−1 | Total pore volume, cm3 g−1 |
|---|---|---|
| MCC | 2.05 | 0.007925 |
| MCC/PANI-28 wt% | 12.08 | 0.062885 |
| MCC/PANI-53 wt% | 22.90 | 0.110594 |
| MCC/PANI-69 wt% | 29.78 | 0.115668 |
| PANI | 27.80 | 0.123548 |
If nanostructures were formed in the synthesis, these would have higher specific areas. Table 2 also shows that PANI had a total pore volume 15 times more than that of the MCC. The BET specific surface areas and total pore volumes of the MCC/PANI nanocomposites were significantly higher than that of the MCC. Table 2 shows that the BET specific surface areas and total pore volumes of the MCC/PANI nanocomposites increased with an increase in the PANI content.
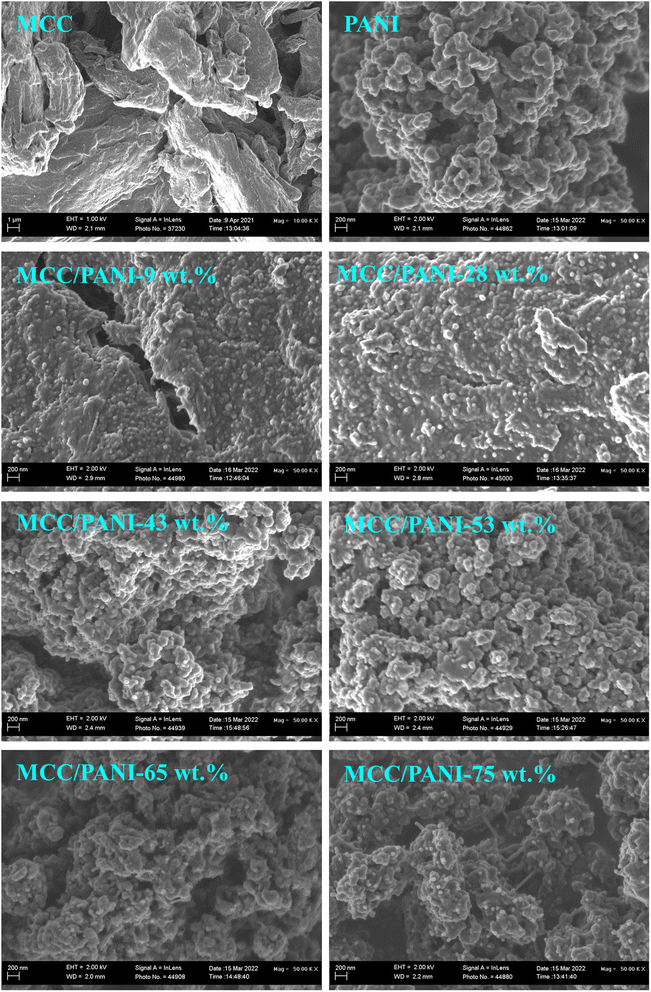
Fig. 2 also shows that the PANI synthesized in this study consisted of agglomerated nanospheres whose size was estimated at less than 100 nm diameter. The morphology of the PANI observed in Fig. 2 (nanosized spheres) correlates with the relatively high specific surface areas observed for the PANI in the preceding section.
Fig. 2 also shows that as the PANI content in the MCC/PANI nanocomposites was increased up to 28 wt% PANI, the PANI uniformly coated the MCC, suggesting that MCC acted as a scaffold for the PANI synthesis. This appears to be further evidence of good interfacial interaction between the PANI and the MCC, as was suggested in the discussion on the FTIR results in §3.1.1. Beyond 28 wt% PANI content, the MCC surfaces were completely covered by agglomerates of PANI nanospheres. The agglomerated PANI particles on the MCC surface provide an explanation for the increase in specific area of the MCC/PANI nanocomposites observed with an increase in the PANI content.
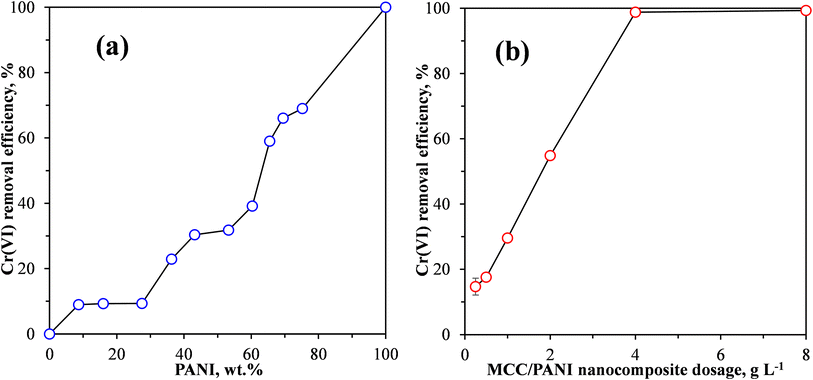 | ||
| Fig. 4 Effect of (a) PANI content and (b) MCC/PANI nanocomposite adsorbent dosage on the Cr(VI) removal efficiency from synthetic wastewater by MCC/PANI nanocomposites. | ||
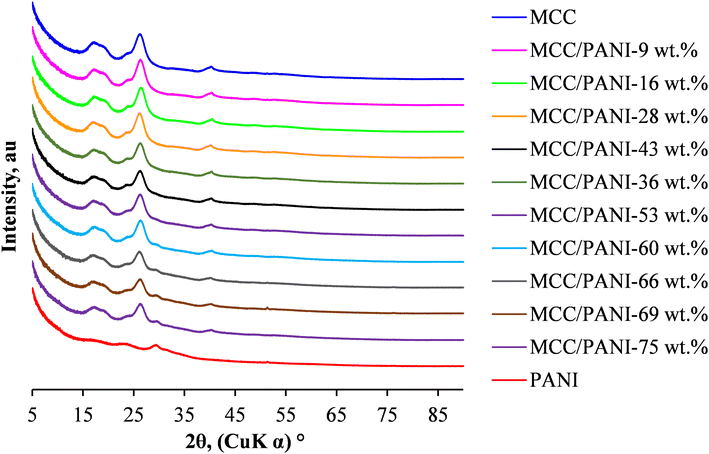
Fig. 3 also shows that up to 53 wt%, the XRD patterns of the MCC/PANI nanocomposites were similar to those of the MCC. However, beyond 53 wt% PANI content, a shoulder appeared in the XRD patterns of the MCC/PANI nanocomposites at 2θ ca. 30°, which corresponds to a characteristic PANI peak. In the XRD patterns of the nanocomposites, the intensity of the characteristic MCC diffraction peak at ca. 27° was observed to decrease with an increase in the PANI content. This observation shows that the crystallinity of the nanocomposites decreased with an increase in the PANI content.
3.2 Cr(VI) adsorption by the MCC
The performance of the MCC as an adsorbent for the removal of the Cr(VI) from the synthetic wastewater was reported in detail elsewhere.19 In brief, the optimal parameters for the removal of the Cr(VI) from the synthetic wastewater by the MCC were determined to be an initial Cr(VI) concentration of 10 mg L−1, an adsorbent dosage of 20 g L−1 and a Cr(VI) solution pH of 1. The MCC took 96 h to reach equilibrium and the equilibrium removal efficiency was 83%. The MCC exhibited a point of zero charge of pH 6.2. The presence of Cr(III) in solution during the adsorption process suggested that the Cr(VI) removal mechanism from wastewater by the MCC was an adsorption coupled reduction mechanism. The kinetics data were best described by the pseudo second order (PSO) model and the Freundlich isotherm best fit the experimental equilibrium data. The adsorption capacity of the MCC was relatively lower at 3.92 mg g−1, when compared to that of commercial adsorbents.19,203.3 Cr(VI) adsorption by the MCC/PANI nanocomposites
Fig. 4(a) shows that under the conditions used, the Cr(VI) removal efficiency was less than 10% as the PANI content was increased from 0 to 28 wt%. It is also observed in Fig. 4(a) that under the same conditions, when the PANI content was increased from 28 wt% the Cr(VI) removal efficiency of the MCC/PANI nanocomposites increased with an increase in the PANI content, reaching a Cr(VI) removal efficiency of 30% at 43 wt% PANI content. A further increase in the PANI content to 53 wt% resulted in a marginal increase in the Cr(VI) removal efficiency of about 1%. However, the Cr(VI) removal efficiency increased once more with further increases in the PANI content, reaching 66% and 69% at PANI contents of 69 wt% and 75 wt% respectively. The MCC/PANI nanocomposite with 69 wt% was thus selected for further study.
The results presented in Fig. 4(a) appear to be consistent with the SEM and BET surface area results observed for the nanocomposites. The SEM results of the MCC/PANI nanocomposites presented in Fig. 2 show that for PANI contents up to 28 wt%, the PANI nanospheres uniformly covered the MCC surfaces. This resulted in the increase in the specific surface areas of the nanocomposites (Table 2). However, up to 28 wt% PANI, this increase in surface areas did not translate to high Cr(VI) removal efficiencies. Higher PANI contents beyond 28 wt% PANI resulted in the agglomeration of the PANI nanospheres on the MCC surfaces (Fig. 2). The agglomeration of the PANI particles on the MCC surface resulted in significantly higher specific surface areas, which apparently resulted in higher Cr(VI) removal efficiencies. Table 2 also shows that there was an 84% increase in the total pore volume of the MCC/PANI nanocomposites when the PANI content was increased from 28 wt% to 53 wt%. The increased pore volumes at higher PANI contents could also have contributed to high Cr(VI) removal efficiencies.
The effect of the adsorbent dosage on the removal efficiency of Cr(VI) by the MCC/PANI-69 wt% nanocomposite is shown in Fig. 4(b). This experiment was conducted using an initial Cr(VI) concentration of 100 mg L−1, and a Cr(VI) solution pH of 7. Fig. 4(b) shows that there was a near linear increase in the Cr(VI) removal efficiency as the adsorbent dosage was increased from 0.25 to 4 g L−1. The increase in the Cr(VI) removal efficiency with an increase in the adsorbent dosage was due to the increased number of available adsorption sites.
Fig. 4(b) shows that a 100% removal efficiency was observed at an adsorbent dosage of 4 g L−1. Further increases in the adsorbent dosage did not result in any change, therefore 4 g L−1 was selected as the optimum adsorbent dosage for the MCC/PANI-69 wt% nanocomposite adsorbent, which was then used for further studies. In comparison, at a Cr(VI) solution of pH 7, the optimum adsorbent dosage for the removal of Cr(VI) by MCC was 20 g L−1. The optimum MCC dosage of 20 g L−1 exhibited a Cr(VI) removal efficiency of only 23% after 120 h contact time, whereas the MCC/PANI-69 wt% optimum dosage of 4 g L−1 showed a Cr(VI) removal efficiency of 100% after 24 h, at a solution pH of 7. These observations show that modification of MCC with polyaniline decreased the adsorbent dosage required to effectively adsorb Cr(VI) and also enhanced its Cr(VI) removal efficiency.
Fig. 5 shows that when the initial Cr(VI) concentration was 100 mg L−1, the Cr(VI) removal efficiency of the Cr(VI) from the synthetic wastewater by the MCC/PANI-69 wt% nanocomposite was close to 100%, whereas the adsorption capacity was about 25 mg g−1. In comparison, when the optimal MCC adsorbent dosage and pH of 20 g L−1 and 1, respectively were used with an initial Cr(VI) concentration of 100 mg L−1, a Cr(VI) removal efficiency and adsorption capacity of about 60% and 3 mg g−1 were obtained respectively. The higher adsorption capacity exhibited by the MCC/PANI-69 wt%, compared to the MCC was possibly due to the increased specific surface area of the MCC/PANI nanocomposites, after modification and functionalization with PANI, which increased the number of available sites for the uptake of the Cr(VI) species.
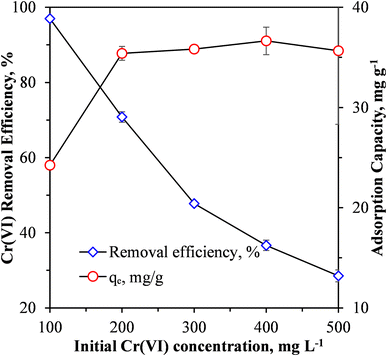 | ||
| Fig. 5 Effect of initial Cr(VI) concentration on Cr(VI) removal efficiency and adsorption capacity of MCC/PANI-69 wt% nanocomposite. | ||
Fig. 5 shows that when the synthetic wastewater had an initial Cr(VI) concentration of 100 mg L−1, a Cr(VI) removal efficiency of 96.996% was achieved using the MCC/PANI-69 wt% nanocomposite adsorbent at a dosage of 4 g L−1 and a pH solution of 7. At this removal efficiency, the final Cr(VI) concentration of the treated water (3 mg L−1) was higher than the recommended WHO recommended limit of 0.05 mg L−1. However, Fig. 5 suggests that if the wastewater had an initial Cr(VI) concentration lower than 100 mg L−1, the removal efficiency would be higher and the final Cr(VI) concentration of the treated water could approach the WHO recommended limit. However, further work will need to be conducted to confirm this premise.
The exponential decrease in the Cr(VI) removal efficiency with an increase in the initial Cr(VI) concentration observed in Fig. 5 is attributed to the saturation of adsorption sites on the MCC/PANI nanocomposite.
Fig. 5 also shows that the adsorption capacity of the nanocomposite increased from 25 mg g−1 to 36 mg g−1 with an increase in the initial Cr(VI) concentration from 100 mg L−1 to 200 mg L−1. However, the adsorption capacity plateaued thereafter with an increase in the initial Cr(VI). The increase in the adsorption capacity was possibly due to the effective utilization of available active adsorption sites on the MCC/PANI nanocomposite surface, which was not possible at low initial Cr(VI) concentrations. The increase in adsorption capacity with an increase in the initial Cr(VI) could also have been due to higher mass transfer driving forces at higher initial Cr(VI) concentrations34,35
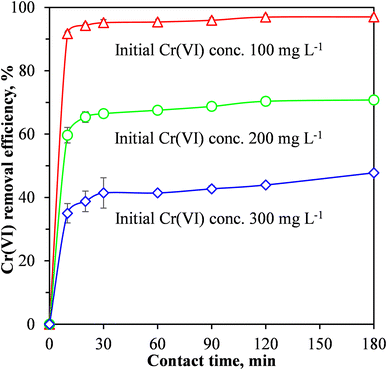 | ||
| Fig. 6 Effect of contact time and initial concentration Cr(VI) concentration on the removal of Cr(VI) from wastewater using the MCC/PANI-69 wt% nanocomposite. | ||
When pristine MCC was used as an adsorbent for the removal of Cr(VI) from the synthetic wastewater, the adsorption process was relatively slow, equilibrium was reached after 96 h at a Cr(VI) removal efficiency of 83%.19 Fig. 6 shows that for the MCC/PANI-69 wt% nanocomposite, and for the three Cr(VI) initial concentrations considered (100, 200 and 300 mg L−1), the Cr(VI) removal efficiencies increased rapidly in the first 10 min and then continued to increase slowly until equilibrium was reached at 30 min. The rapid Cr(VI) adsorption within the first 10 min demonstrated a high affinity of the Cr(VI) by the MCC/PANI adsorbent. The reduced increase observed in the Cr(VI) removal efficiencies in Fig. 6 after 10 min was probably due to the easily accessible active sites which were occupied first by Cr(VI) species becoming inaccessible and the remaining Cr(VI) species in solution finding it difficult to access adsorption sites.
Fig. 6 also shows that for the MCC/PANI-69 wt% nanocomposite, beyond the equilibrium times of 30 min, the Cr(VI) removal efficiency plateaued for all the initial Cr(VI) concentrations considered. This observation is attributed to the non-availability of adsorption sites on the adsorbent surface after most of them had already been occupied by the Cr(VI) species at the initial stage. A decreased concentration gradient of Cr(VI) could also have reduced mass transfer of Cr(VI) to the adsorbent surface.
It was also observed in Fig. 6 that for the initial Cr(VI) concentrations of 100, 200 and 300 mg L−1, the maximum Cr(VI) removal effectiveness were 95, 67 and 45% respectively, at the equilibrium time of 30 min.
Energy dispersive X-ray (EDX) analysis results presented in Table 3 show that both the neat PANI and the MCC/PANI-69 wt% contained significant amounts of nitrogen and sulphur. This is further evidence that PANI was successfully synthesized and that it was doped with PTSA. The sulphur was derived from the PTSA.36
| Element (at%) | MCC | PANI | MCC/PANI-69 wt% | MCC/PANI-69 wt% (after Cr(VI) adsorption) |
|---|---|---|---|---|
| O | 100.00 | 73.08 | 73.42 | 66.37 |
| N | — | 15.37 | 12.63 | 8.50 |
| S | — | 11.55 | 13.95 | 4.95 |
| Cr | — | — | — | 20.17 |
The adsorption experiments conducted using the MCC/PANI-69 wt% were conducted at pH 7. The Cr(VI) speciation diagram shows that, at the initial Cr(VI) concentration of 100 mg L−1 used in the adsorption experiments, and at pH 7, the Cr(VI) was in the form of chromate anions, CrO42−.7 It is therefore inferred that removal of Cr(VI) from the synthetic wastewater occurred through electrostatic attraction between the CrO42− anions and the protonated amines/imines of the PANI.
Jahan et al. previously studied the removal of Cr(VI) from solution at pH 7 using a PANI/bacterial cellulose (BC) mat.37 They proposed that the removal mechanism consisted of three steps viz. adsorption of Cr(VI) onto the adsorbent surface, reduction of the adsorbed Cr(VI) into Cr(III) on the PANI/BC mat, followed by desorption of Cr(III) into solution. The first step in the mechanism proposed by Jahan et al. is similar to the postulation from this study, that the negatively charged CrO42− anions are removed by electrostatic attraction by the protonated amine and imine groups present in PANI.37
To determine whether reduction of Cr(VI) to Cr(III) occurred during the Cr(VI) removal process, the FTIR spectra of the nanocomposite adsorbent was studied before and after the adsorption process. Fig. 7 shows the FTIR spectra of the neat MCC, the as synthesized PANI and the MCC/PANI-69 wt% nanocomposite, and the MCC/PANI-69 wt% nanocomposite after contacting it with 100 mg L−1 Cr(VI) solution.
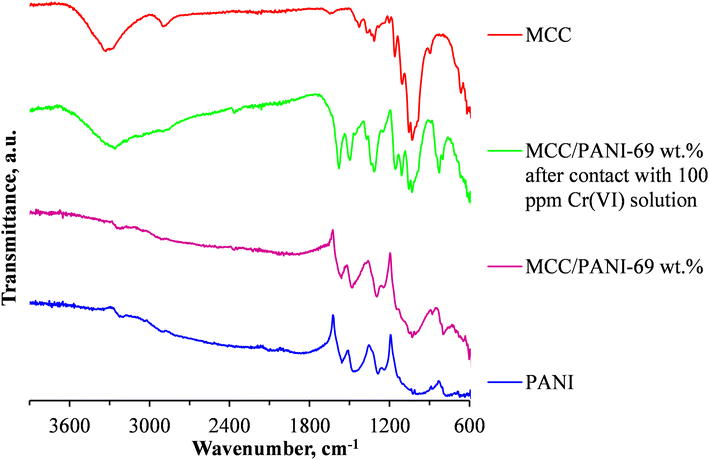 | ||
| Fig. 7 FTIR spectra of MCC, PANI, MCC/PANI-69 wt% nanocomposites as synthesized and MCC/PANI-69 wt% nanocomposites after contact with 100 mg L−1 Cr(VI) solution. | ||
Fig. 7 shows that the relative intensities of the bands at ca. 1560 and 1460 cm−1 that are ascribed to the ring stretching of the quinoid (N![[double bond, length as m-dash]](https://www.rsc.org/images/entities/char_e001.gif) Q
Q![[double bond, length as m-dash]](https://www.rsc.org/images/entities/char_e001.gif) N) and benzenoid (N–B–N) structures in PANI are higher in the MCC/PANI-69 wt% after it was exposed to the 100 ppm Cr(VI) solution, compared to the intensities of the same bands in the as synthesized PANI and the MCC/PANI- 69 wt% nanocomposite. This is evidence that the PANI in the MCC/PANI-69 wt% nanocomposite which was in the emaraldine salt form was oxidised by the Cr(VI) into the pernigraniline form during the Cr(VI) removal process from the synthetic waste water. Simultaneously, the Cr(VI) was reduced into Cr(III).38
N) and benzenoid (N–B–N) structures in PANI are higher in the MCC/PANI-69 wt% after it was exposed to the 100 ppm Cr(VI) solution, compared to the intensities of the same bands in the as synthesized PANI and the MCC/PANI- 69 wt% nanocomposite. This is evidence that the PANI in the MCC/PANI-69 wt% nanocomposite which was in the emaraldine salt form was oxidised by the Cr(VI) into the pernigraniline form during the Cr(VI) removal process from the synthetic waste water. Simultaneously, the Cr(VI) was reduced into Cr(III).38
EDX analysis of the MCC/PANI-69 wt% adsorbent after exposure to the Cr(VI) solution confirmed the presence of Cr on its surface (Table 3). This Cr must have been Cr(III) that precipitated on the nanocomposite adsorbent. In summary, it is postulated that the Cr(VI) removal mechanism by the MCC/PANI-69 wt% nanocomposites at pH 7 was through electrostatic attraction of Cr(VI) species by protonated amine and amine groups of PANI, reduction of Cr(VI) into Cr(III) and precipitation of Cr(III) on the nanocomposite surface.
 | (3) |
In eqn (3), qt and qe are the adsorption capacities at time t (min), and at equilibrium (mg g−1), respectively. k2 is the pseudo second order rate constant (g mg−1 min−1).
The Weber–Morris intra-particle diffusion model given in eqn (4) was also employed to investigate the rate controlling mechanism of Cr(VI) adsorption onto the MCC/PANI-69 wt% nanocomposite. The Weber and Morris Model is given as follows:40
| qt = kidt1/2 + C | (4) |
In the Cr(VI) adsorption kinetics studies, initial Cr(VI) solution concentrations of 100, 200 and 300 mg L−1 at pH 7.0 were used, and the optimum adsorbent dosage of 4 g L−1 was used. The appropriateness of the kinetics models in describing the experimental data were determined by evaluating the linear regression correlation coefficient (R2) of the fits.
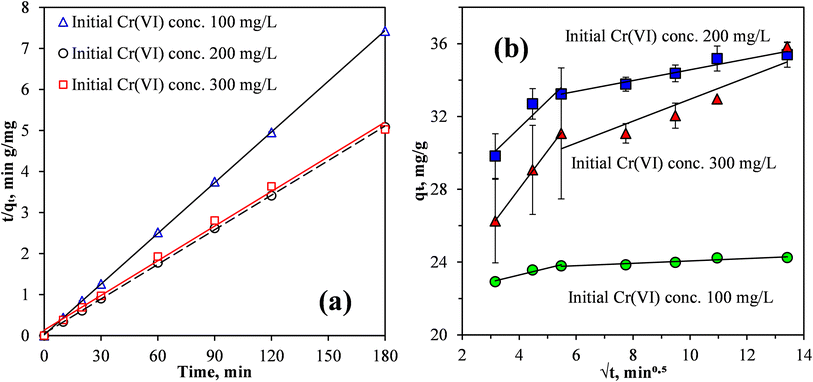
Fig. 8(a) shows the fits of the PSO model to the kinetics data of Cr(VI) removal by the MCC/PANI-69 wt% nanocomposites from the synthetic wastewater. The parameters determined in fitting the models are given in Table 4.
| Kinetics model | Parameter | Constants | ||
|---|---|---|---|---|
| Initial Cr(VI) concentrations | ||||
| 100 mg L−1 | 200 mg L−1 | 300 mg L−1 | ||
| Pseudo second order | qe, cal (mg g−1) | 24.2718 | 35.8423 | 34.1297 |
| k (g mg−1 min−1) | 0.06985 | 0.01383 | 0.00911 | |
| h (mg g−1 min−1) | 41.1525 | 17.7614 | 10.6157 | |
| R2 | 1 | 0.9996 | 0.9955 | |
| Experimental value | qe, exp (mg g−1) | 24.2489 | 35.671 | 35.8333 |
Fig. 8(a) and the correlation coefficients, R2, presented in Table 4 confirmed that the kinetics data correlated well with the PSO model, for the three initial Cr(VI) concentrations considered. Also, the equilibrium adsorption capacities qe, determined using the PSO model, were very close to the experimental values for the three initial Cr(VI) concentrations considered. Thus, the PSO model provided an appropriate fit to the experimental kinetics data for the removal of the Cr(VI) from the synthetic wastewater by the MCC/PANI-69 wt% nanocomposites. This agrees with several previous studies in which the PSO model provided good fits to describe adsorption kinetics for metals such as Cr(VI) from aqueous solutions.42–44 A good fit of the experimental data to the PSO model is evidence that the adsorption mechanism was due to the chemisorption.41,44
Fig. 8(b) show fits of the Weber and Morris intraparticle diffusion model to the Cr(VI) removal data by the MCC/PANI-69 wt% nanocomposite at varying Cr(VI) initial concentrations. The Weber and Morris model is frequently used to identify the adsorption mechanism(s) and to predict the rate-controlling step in adsorption processes. It is apparent from Fig. 8(b) that plots of qt against t1/2 for the three initial concentrations considered are not straight lines that pass through the origin. However, linear segments can be identified in the plots, for the three initial Cr(VI) concentrations. It can thus be concluded from Fig. 8(b) that Cr(VI) removal from solution by the MCC/PANI-69 wt% nanocomposite was controlled by multiple processes.40,44,45 This agrees with the postulation made in § 3.3.4.
 | (5) |
In eqn (5), Ce is the equilibrium concentration of Cr(VI) (mg L−1), KL is the Langmuir equilibrium adsorption constant (L mg−1), qe is the equilibrium adsorption capacity (mg g−1), qm is the maximum adsorption capacity (mg g−1).
Fig. 9 shows a fit of the Langmuir adsorption isotherm to the equilibrium adsorption data for the removal of Cr(VI) by the MCC/PANI-69 wt% nanocomposite. The parameters determined from fitting the Langmuir isotherm are presented in Table 5.
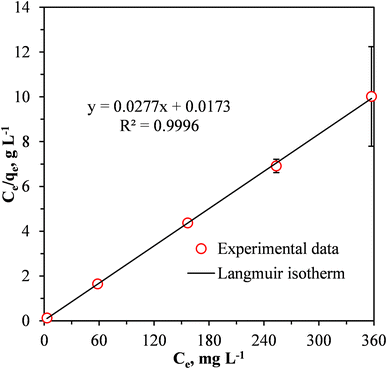 | ||
| Fig. 9 Linear fit of the Langmuir isotherm model to the data for the adsorption of Cr(VI) by the MCC/PANI-69 wt% nanocomposite. | ||
| Isotherm | Parameter | Value |
|---|---|---|
| Langmuir | qm (mg g−1) | 36.1011 |
| KL (L mg−1) | 1.6012 | |
| R2 | 0.9996 |
Fig. 9 and Table 5 show that the Langmuir isotherm provided a good fit to the experimental data for the Cr(VI) removal from the synthetic wastewater by the MCC/PANI-69 wt% nanocomposite. The Langmuir isotherm had a relatively higher correlation coefficient (0.9996) showing that it adequately described the experimental data for the Cr(VI) removal from the wastewater by the MCC/PANI-69 wt% nanocomposite. This observation suggests that the removal of the Cr(VI) by the MCC/PANI-69 wt% nanocomposite occurred through monolayer adsorption.46,47 The maximum monolayer adsorption capacity of the MCC/PANI-69 wt% nanocomposite adsorbent was 36.10 mg g−1 (Table 5).
The separation factor RL values which are related to the Langmuir isotherm, where between 0 and 1 for the three initial Cr(VI) concentrations, this confirms that adsorption of the Cr(VI) by MCC/PANI-69 wt% nanocomposite was favourable.48
4 Conclusions
FTIR and XRD analysis confirmed the successful in situ chemical oxidative polymerization of aniline on the MCC surfaces. SEM showed that MCC was an effective scaffold for PANI synthesis. The agglomeration of the PANI nanospheres on the MCC surfaces apparently enhanced the specific surface area of the MCC/PANI nanocomposites compared to the neat MCC. Batch adsorption studies showed that the optimal conditions for the removal of Cr(VI) from synthetic wastewater using the MCC/PANI-69 wt% nanocomposite as an adsorbent were an initial Cr(VI) concentration of 100 mg L−1, an adsorbent dosage of 4 g L−1 and a Cr(VI) solution pH of 7. The MCC/PANI-69 wt% required only 30 min to reach equilibrium and it attained an equilibrium removal efficiency of 95%.FTIR analysis suggested that the Cr(VI) removal mechanism by the MCC/PANI-69 wt% nanocomposites at pH 7 was through electrostatic attraction of the CrO42− anions by protonated amine and amine groups of PANI, reduction of the adsorbed Cr(VI) into Cr(III) and precipitation of Cr(III) on the nanocomposite surface. EDX analysis of the MCC/PANI-69 wt% adsorbent after exposure to the Cr(VI) solution confirmed the presence of Cr on its surface, also supporting the proposed mechanism.
Good fits of the PSO model to the experimental kinetics data for the removal of the Cr(VI) from the synthetic wastewater by the MCC/PANI-69 wt% nanocomposite implied that the adsorption process involved chemisorption. Fits of the Weber and Morris intraparticle diffusion model to the kinetics data for Cr(VI) removal by the MCC/PANI-69 wt% nanocomposite at varying Cr(VI) initial concentrations confirmed that Cr(VI) removal from solution by the MCC/PANI-69 wt% nanocomposite was controlled by multiple processes, in agreement with the postulated removal mechanism. The Langmuir isotherm best described the experimental data for the Cr(VI) removal from the wastewater by the MCC/PANI-69 wt% nanocomposite, suggesting that the removal of the Cr(VI) by the MCC/PANI-69 wt% nanocomposite occurred through monolayer adsorption.
The MCC/PANI-69 wt% nanocomposite exhibited a significantly improved monolayer maximum adsorption capacity of 36.10 mg g−1, at pH 7, in comparison to that of the MCC (3.92 mg g−1 at pH 1). The MCC/PANI-69 wt% nanocomposite maximum adsorption capacity was comparable to other modified and functionalized adsorbents based on cellulose. The relatively high adsorption capacity of the MCC/PANI-69 wt% nanocomposite was attributed to its significantly higher specific surface area after modification of the MCC with the PANI. The amine and imine functional groups of the PANI also effectively interacted with the Cr(VI), enhancing its adsorption capacity. An important result from the study was that whereas most of the reported adsorbents for Cr(VI) are only effective at low pH values, the MCC/PANI nanocomposite synthesized in this study was effective at pH 7.
Data availability
The datasets generated during and/or analysed during the current study are available from the corresponding author on reasonable request.Author contributions
Conceptualization: [Washington Mhike]; methodology: [Washington Mhike], [Shepherd M. Tichapondwa]; formal analysis and investigation: [Lovejoy Dewa]; writing – original draft preparation: [Lovejoy Dewa]; writing – review and editing [Washington Mhike], [Shepherd Tichapondwa]; funding acquisition [Washington Mhike]; resources [Washington Mhike], [Shepherd M. Tichapondwa]; supervision: [Washington Mhike], [Shepherd M. Tichapondwa].Conflicts of interest
The authors have no competing interests to declare that are relevant to the content of this article.Acknowledgements
Open access funding was provided by Tshwane University of Technology. Samantha Govender and Rettenmaier South Africa are acknowledged for providing the MCC used in this study, at no cost. Financial support by the Department of Science and Innovation, South Africa, through the Paper Manufacturers Association of South Africa under Grant DST/CON 004/2019 is acknowledged.References
- R. Saha, R. Nandi and B. Saha, J. Coord. Chem., 2011, 64, 1782–1806 CrossRef CAS.
- M. Loock-Hattingh, PhD in Chemistry, North-West University, 2016.
- H.-J. Lunk, ChemTexts, 2015, 1, 1–17 CrossRef.
- P. B. Tchounwou, C. G. Yedjou, A. K. Patlolla and D. J. Sutton, in Molecular, Clinical and Environmental Toxicology. Experientia Supplementum, ed. A. Luch, Springer, Basel, 2012, vol. 101, pp. 133–164 Search PubMed.
- Z. Rahman and V. P. Singh, Environ. Monit. Assess., 2019, 191, 419 CrossRef PubMed.
- P. Sharma, S. P. Singh, S. K. Parakh and Y. W. Tong, Bioengineered, 2022, 13, 4923–4938 CrossRef CAS PubMed.
- D. Mohan and C. U. Pittman, J. Hazard. Mater., 2006, 137, 762–811 CrossRef CAS PubMed.
- S. K. Sharma, B. Petrusevski and G. Amy, J. Water Supply: Res. Technol.-AQUA, 2008, 57, 541–553 CrossRef CAS.
- P. J. Williams, E. Botes, M. M. Maleke, A. Ojo, M. F. DeFlaun, J. Howell, R. Borch, R. Jordan and E. van Heerden, Water S.A., 2014, 40, 549–554 CrossRef.
- N. Kumar, A. Kardam, V. Jain and S. Nagpal, Sep. Sci. Technol., 2020, 55, 1436–1448 CrossRef CAS.
- F. Fu and Q. Wang, J. Environ. Manage., 2011, 92, 407–418 CrossRef CAS PubMed.
- M. E. González-López, C. M. Laureano-Anzaldo, A. A. Pérez-Fonseca, M. Arellano and J. R. Robledo-Ortíz, Sep. Purif. Rev., 2021, 50, 333–362 CrossRef.
- V. K. Gupta, A. Nayak and S. Agarwal, Environ. Eng. Res., 2015, 20, 1–18 CrossRef.
- G. Crini, E. Lichtfouse, L. D. Wilson and N. Morin-Crini, Environ. Chem. Lett., 2019, 17, 195–213 CrossRef CAS.
- I. Michalak, K. Chojnacka and A. Witek-Krowiak, Appl. Biochem. Biotechnol., 2013, 170, 1389–1416 CrossRef CAS PubMed.
- C. Olsson and G. Westman, in Cellulose, ed. T. van de Ven and L. Godbout, IntechOpen, Rijeka, 2013, ch. 6, p. 52144 Search PubMed.
- P. M. Ejikeme, Cellulose, 2008, 15, 141–147 CrossRef CAS.
- A. Jamshaid, A. Hamid, N. Muhammad, A. Naseer, M. Ghauri, J. Iqbal, S. Rafiq and N. S. Shah, ChemBioEng Rev., 2017, 4, 240–256 CrossRef CAS.
- W. Mhike, L. Dewa and S. Tichapondwa, Chem. Eng. Trans., 2023, 103, 661–666 Search PubMed.
- Z. N. Garba, I. Lawan, W. Zhou, M. Zhang, L. Wang and Z. Yuan, Sci. Total Environ., 2020, 717, 135070 CrossRef CAS PubMed.
- S. Bhadra, D. Khastgir, N. K. Singha and J. H. Lee, Prog. Polym. Sci., 2009, 34, 783–810 CrossRef CAS.
- I. Y. Sapurina, M. A. Shishov and V. T. Ivanova, Russ. Chem. Rev., 2020, 89, 1115 CrossRef CAS.
- H. Hajjaoui, A. Soufi, W. Boumya, M. Abdennouri and N. Barka, J. Compos. Sci., 2021, 5, 233 CrossRef CAS.
- S. N. Benaouda, H. Chaker, F. Abidallah, C. Bachir, H. Tawheed, P. G. Weidler, A. Bengueddach, J. Canales-Vázquez and R. Hamacha, J. Porous Mater., 2022, 1–15 Search PubMed.
- J. Stejskal, D. Hlavatá, P. Holler, M. Trchová, J. Prokeš and I. Sapurina, Polym. Int., 2004, 53, 294–300 CrossRef CAS.
- E. N. Bakatula, D. Richard, C. M. Neculita and G. J. Zagury, Environ. Sci. Pollut. Res., 2018, 25, 7823–7833 CrossRef CAS PubMed.
- Standard Methods for the Examination of Water and Wastewater, ed. A. D. Eaton and M. A. H. Franson, American Public Health Association, 2005 Search PubMed.
- A. John, S. K. Mahadeva and J. Kim, Smart Mater. Struct., 2010, 19, 045011 CrossRef.
- V. P. Anju and S. K. Narayanankutty, Polym. Bull., 2019, 76, 5253–5267 CrossRef CAS.
- M. Babazadeh, Iran. Polym. J., 2007, 16, 389–396 CAS.
- J. Li, X. Qian, L. Wang and X. J. B. An, BioResources, 2010, 5, 712–726 CAS.
- J. Stejskal, I. Sapurina, M. Trchová and E. N. Konyushenko, Macromolecules, 2008, 41, 3530–3536 CrossRef CAS.
- N. Terinte, R. Ibbett and K. C. Schuster, Lenzinger Ber., 2011, 89, 118–131 CAS.
- B. V. Babu and S. Gupta, Adsorption, 2008, 14, 85–92 CrossRef CAS.
- M. T. Yagub, T. K. Sen, S. Afroze and H. M. Ang, Adv. Colloid Interface Sci., 2014, 209, 172–184 CrossRef CAS PubMed.
- M. V. Kulkarni, A. K. Viswanath, R. C. Aiyer and P. K. Khanna, J. Polym. Sci., Part B: Polym. Phys., 2005, 43, 2161–2169 CrossRef CAS.
- K. Jahan, N. Kumar and V. Verma, Environ. Sci.: Water Res. Technol., 2018, 4, 1589–1603 RSC.
- X. L. Ma, G. T. Fei and S. H. Xu, Nanoscale Res. Lett., 2021, 16, 58 CrossRef CAS PubMed.
- Y.-S. Ho and G. McKay, Process Biochem., 1999, 34, 451–465 CrossRef CAS.
- J. Wang and X. Guo, J. Hazard. Mater., 2020, 390, 122156 CrossRef CAS PubMed.
- A. Pholosi, E. B. Naidoo and A. E. Ofomaja, S. Afr. J. Chem. Eng., 2020, 32, 39–55 Search PubMed.
- Y. Zheng, W. Wang, D. Huang and A. Wang, Chem. Eng. J., 2012, 191, 154–161 CrossRef CAS.
- M. O. Ansari, R. Kumar, S. A. Ansari, S. P. Ansari, M. Barakat, A. Alshahrie and M. H. Cho, J. Colloid Interface Sci., 2017, 496, 407–415 CrossRef CAS PubMed.
- T. H. Tran, H. Okabe, Y. Hidaka and K. Hara, Carbohydr. Polym., 2017, 157, 335–343 CrossRef CAS PubMed.
- H. Qiu, L. Lv, B.-c. Pan, Q.-j. Zhang, W.-m. Zhang and Q.-x. Zhang, J. Zhejiang Univ., Sci., A, 2009, 10, 716–724 CrossRef CAS.
- X. Guo and J. Wang, J. Mol. Liq., 2019, 296, 111850 CrossRef CAS.
- D. D. Milenković, M. M. Milosavljević, A. D. Marinković, V. R. Đokić, J. Z. Mitrović and A. L. Bojić, Water S.A., 2013, 39, 515–522 Search PubMed.
- M. Gouamid, M. R. Ouahrani and M. B. Bensaci, Energy Procedia, 2013, 36, 898–907 CrossRef CAS.
- B. Qiu, C. Xu, D. Sun, H. Yi, J. Guo, X. Zhang, H. Qu, M. Guerrero, X. Wang, N. Noel, Z. Luo, Z. Guo and S. Wei, ACS Sustainable Chem. Eng., 2014, 2, 2070–2080 CrossRef CAS.
- Y. Hao, Z. Cui, H. Yang, G. Guo, J. Liu, Z. Wang, A. Deniset-Besseau and S. Remita, Cellul. Chem. Technol., 2018, 52, 485–494 CAS.
- F. Xue, H. He, H. Zhu, H. Huang, Q. Wu and S. Wang, Langmuir, 2019, 35, 12636–12646 CrossRef CAS PubMed.
| This journal is © The Royal Society of Chemistry 2024 |

