
 Open Access Article
 This Open Access Article is licensed under a Creative Commons Attribution-Non Commercial 3.0 Unported Licence
Fabrication of a PCN/BiOBr 2D hybrid with improved photocatalytic performance of 2,4-dichorophenol degradation†
Shuangying Chen,
Fushui Guo,
Liantao Hao and
Xuliang Zhang*
Analysis and Testing Center, Shandong University of Technology, Zibo, 255000, P. R. China. E-mail: Zhangxl@sdut.edu.cn
First published on 2nd January 2024
Abstract
Photocatalysis has received much attention as an environmentally friendly route to manage the emerging organic pollution problems. Herein, BiOBr nanosheets have been synthesized by a hydrothermal method, and then PCN/BiOBr hybrids are designed via a facile wet chemical method. The as-prepared PCN/BiOBr hybrids are characterized by X-ray diffraction (XRD), UV-vis diffuse reflectance spectra (UV-vis DRS), X-ray photoelectron spectroscopy (XPS) and scanning electron microscopy (SEM). The PCN/BiOBr composite exhibits remarkable improved activity in the degradation of 2,4-dichlorophenol (2,4-DCP) as compared to the pristine BiOBr. Based on the ·OH amount-related fluorescence spectra fluorescence and the photoelectrochemistry (PEC) tests, it is confirmed that the enhanced photocatalytic performance of PCN/BiOBr is attributed to the promoted charge separation. Moreover, by means of the radical-trapping experiments it is demonstrated that the formed ·O2− species, as the electron-modulated direct products, are the primary active species during the photocatalytic degradation of 2,4-DCP. This work would provide a feasible design strategy to fabricate high-activity photocatalysts for 2,4-DCP degradation.
1. Introduction
Chlorophenols, as high-risk aqueous organic environmental pollutants, are produced mainly from the widespread use of preservatives, herbicides, and fungicides, and bring an intractable crisis to human beings. Among the chlorophenols, 2,4-DCP has been listed as a priority control pollutant by America, China, and the European Union.1–3 Therefore, it is urgent to develop economic and effective technologies for the degradation of 2,4-DCP.4–8 Noteworthily, compared with the traditional adsorption technologies, photocatalysis technology shows significant advantages, such as solar energy utilization, low cost and being environmentally friendly.9–12 For photocatalysis, the photocatalytic material is one of the most important parts and is the basic part.13 Recently, many semiconductor photocatalysts have been largely investigated, such as TiO2, BiOCl carbon nitride and BiVO4.14,15 Considering that the solar spectrum of the visible part is nearly 47%, semiconductors with narrow band gaps have become the focus of research. Very recently, BiOBr with a narrow bandgap of 2.8 eV has been widely researched due to its relatively positive valence band position, low cost and low toxicity.16–19 However, the photocatalyst BiOBr always faces the problem of the easy recombination of its photogenerated charge carriers, and this problem mainly results from the narrow bandgap structure, and the other problem which BiOBr faced is its relatively positive conduction band position will result in the insufficient thermodynamic reduction property of its photoelectrons. For this, various strategies have been carried out, such as element doping, noble metal loading, and heterojunction construction.20–23Among the methods for improving photocatalytic activities of BiOBr, constructing heterojunctions with another semiconductor is considered to be a promising method for improving its charge separation efficiency, and thereby to boost its photocatalytic activities.24–26 Generally, introducing a semiconductor with proper band structure to form a S-type heterojunction is a feasible strategy for simultaneously overcoming the charge carrier recombination and the improper conduction band position problems, for which the semiconductor with a positive valence band (VB) provides holes for the oxidation half-reaction and the other semiconductor with a negative conduction band (CB) provides electrons for the reduction half-reaction.9,12,22,24,25 Hence, the charge separation of BiOBr is expected to be improved by constructing S-type heterojunction. Polymeric carbon nitride (PCN), as a sheet-structure material with a relatively negative conduction band position, is considered to be an appropriate material to construct S-type heterojunctions with BiOBr.27,28 Besides, a 2D/2D structure is beneficial for the charge transfer between the two semiconductors. Therefore, to synthesize sheet-like BiOBr and then construct PCN/BiOBr S-type heterojunctions is a feasible strategy for preparing high performance BiOBr-based photocatalysts.
In this work, a nanosheet-structured BiOBr material has been successfully prepared via a hydrothermal approach, and then a 2D/2D structured PCN/BiOBr composite is constructed through a convenient wet chemical way. The photocatalytic activity of BiOBr nanosheets in 2,4-DCP degradation was obviously improved by introducing PCN nanosheets. On the basis of the results of ·OH amount-related fluorescence spectra fluorescence and the PEC tests, the increased photoactivity was mainly attributed to the enhanced charge separation. Besides, the primary active species of the photocatalytic 2,4-DCP degradation reaction by the PCN/BiOBr composite was proved to be the ·O2− species based on the radical-trapping experiments. It is expected that this work can provide avenues for constructing high performance BiOBr-based photocatalysts.
2. Experimental details
2.1 Reagents
All the chemical reagents were analytical grade which were brought from Aladdin biochemical technology and were used as received without further purification. Deionized water was used throughout all experiments.2.2 Synthesis of materials
The BiOBr nanosheets were prepared via a hydrothermal method as follows. 3.6375 g of Bi(NO3)3·5H2O was added in 15 mL of ethanol solution and the mixture was magnetically stirred for 20 min, the result mixture is labelled as mixture A. 0.8925 g KBr was dissolved in 15 mL deionized water by under magnetically stirred for 20 min and the solution was labelled as solution B. The solution B was added dropwise into mixture A under vigorously stirring, and the mixture was further vigorously stirred for 1 h. After that, the resulting mixture was thermal treated at 180 °C for 24 h in the oven. After cooling to room temperature naturally, the powders were centrifuged and washed with deionized water and ethanol alternately by three times, and finally dried at 80 °C for 12 h in air. The bare BiOBr nanosheets are denoted as BOB in the data graphs.The PCN was synthesized as follows. Firstly, 5 g of melamine was dissolved in 500 mL deionized water under vigorously stirring for 30 min in the at 80 °C water bath and the liquid is denoted as liquid A. 5 g of cyanuric acid was dissolved in 500 mL deionized water under vigorously stirring for 30 min in an 80 °C water bath. The liquid is denoted as liquid B. The liquid B was added quickly into liquid A under vigorously stirring. The result mixture was kept in the 80 °C water bath with stir for 1 h and without stir for another 1 h. After cooling to room temperature naturally, the mixture was centrifuged and washed with deionized water three times. The solid product was then separated and dried at 80 °C for 12 h. After that, the sample was grounded into fine powder in a mortar and collected. 20 g of the powder was placed in a 100 mL alundum crucible with a cover, and then calcinated at 550 °C for 4 h with the heating rate of 2 °C min−1 in a box-type resistance furnace. After cooling to the room temperature naturally, a little-yellow PCN powder was obtained, and it was denoted as CN in the data graphs.
The PCN/BiOBr nanocomposites were synthesized as follows. 0.5 g BiOBr and proper amount of PCN (corresponding mass percent: 3%, 5%, 7%, and 9%) were mixed in 100 mL solution which was mixed by deionized water and absolute ethanol with the volume ratio of 1![[thin space (1/6-em)]](https://www.rsc.org/images/entities/char_2009.gif) :1. The mixtures were sonicated for 30 min and stirred for 30 min. Then the mixtures were kept in an 80 °C water bath under vigorously stirring to evaporate the solvent. Then the samples were dried in an 80 °C oven and calcined at 200 °C for 2 h in a muffle furnace. After grounded into fine powder, the obtained nanocomposite was denoted by XCN/BOB, where CN stands for PCN, BOB means BiOBr, and X is the mass percent of PCN to BiOBr.
:1. The mixtures were sonicated for 30 min and stirred for 30 min. Then the mixtures were kept in an 80 °C water bath under vigorously stirring to evaporate the solvent. Then the samples were dried in an 80 °C oven and calcined at 200 °C for 2 h in a muffle furnace. After grounded into fine powder, the obtained nanocomposite was denoted by XCN/BOB, where CN stands for PCN, BOB means BiOBr, and X is the mass percent of PCN to BiOBr.
2.3 Characterization
The crystal structures of prepared samples were characterized using X-ray diffraction (XRD) on Bruker D8A. The morphologies of the samples were studied using scanning electron microscopy (SEM, Quanta 250, FEI). The UV-vis diffuse reflectance spectra (UV-vis DRS) are characterized with a Model Shimadzu UV3600 spectrophotometer. The compositions and elemental chemical states of the samples were confirmed through X-ray photoelectron spectroscopy (XPS) using a Kratos-Axis Ultra DLD apparatus with an Al (mono) X-ray source. Surface photovoltage spectrum (SPS) was measured by a home-build system equipped with a SR830 lock-in amplifier and a SR540 light chopper.2.4 Hydroxyl radical measurement
For the hydroxyl radical (·OH) measurement, 50 mg the powder sample was dispersed in 50 mL of 1 × 10⁻³ M coumarin aqueous solution. The mixture was stirred in a dark situation for 30 min and then irradiated for 1 h under continuous stirring. The sample was centrifuged, and a certain amount of the upper clear solution was acquired for the fluorescence measurement of 7-hydroxycoumarin with characteristic emission peak at 456 nm under the excitation wavelength of 332 nm through a spectrofluorometer (Edinburgh FS5).2.5 Photoelectrochemical (PEC) measurement
The photoelectrochemical measurement was carried out in a three-electrode system with an Ag/AgCl electrode as the reference electrode, and a Pt plate as the counter electrode using a CHI660E electrochemical workstation. The samples were made into paste and coated on FTO glass of 1.0 cm × 1.0 cm by a doctor blade method. The measurements were tested in a 0.5 M Na2SO4 electrolyte using Ar as the protective gas and a 500 W Xe-lamp as the light source.2.6 Photocatalytic activity
The activities of the samples were evaluated by the photodegradation of 2,4-DCP. 0.05 g of the catalyst was placed in 50 mL solution of 2,4-DCP with a concentration of 10 mg L−1, then the mixture was placed in dark situation for 1 h under continuous stirring to ensure the reactive system reached the adsorption–desorption equilibrium. Then, the mixture was irradiated for 1 h using a 150 W Xe lamp. Finally, the Shimadzu UV-3600 UV-vis spectrometer was used to analyse the concentration of 2,4-DCP by means of the characteristic optical absorption at 285 nm. The photostability and repeatability experiment was carried out by the same procedure. For each run, the photocatalyst was centrifuged and washed with deionized water and ethanol several times. Then, it was dried at 80 °C for next test.3. Results and discussion
3.1 Structural characterization
To investigate the crystalline structure of BiOBr and XCN-BiOBr, the samples were analyzed by XRD (shown in Fig. 1A). From the XRD patterns one can see that the pure BiOBr exhibits seven major peaks, which are respectively indexed to the (001), (101), (102), (110), (112), (200) and (212) planes.29–31 All the diffraction peaks could be indexed to the tetragonal BiOBr (JCPDS 09-0393) and no impurities could be found, indicating the high purity of the BiOBr. Meanwhile, it is noticed that the crystal phase of XCN-BiOBr nanocomposites no additional peaks of PCN, which is possibly because of the tiny amount and low crystallinity of PCN. To study the energy structures and light absorption properties of the samples, UV-vis DRS test was carried out. As shown in Fig. S1A,† one can see that the optical absorption of BiOBr slightly changed a little. Further calculation of bandgap energy by the widely accepted Kubelka–Munk method was shown in Fig. 1B, and it is indicated that the bandgap of BiOBr is 2.8 eV and had a tiny blue shift after coupling with PCN. From the UV-vis DRS results of PCN and its calculated bandgap energy results, one can see that the bandgap of PCN is 3.1 eV which can explain the blue shift of the bandgap on the composites.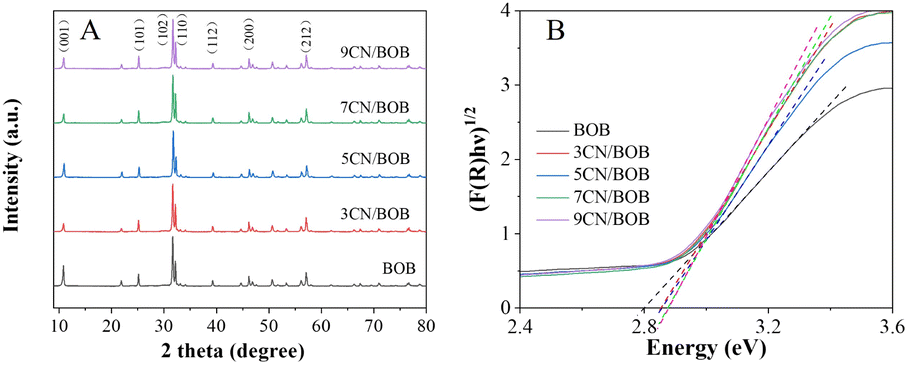 | ||
| Fig. 1 XRD patterns (A), Kubelka–Munk plot (B) of pure BiOBr and XCN/BOB samples. | ||
SEM images of BiOBr and 7CN/BOB composites in Fig. 2 were used to characterize the surface morphologies. As can be seen from Fig. 2A, B and S2,† the BiOBr possesses nanosheet-structure, and its thickness is about 15 nm. From the SEM images of the 7CN/BOB sample (shown in Fig. 2C and D), and further EDS detection results about the element composition of 7CN/BOB sample (shown in Fig. 3), it is indicated that the PCN and BiOBr were successfully mixed.
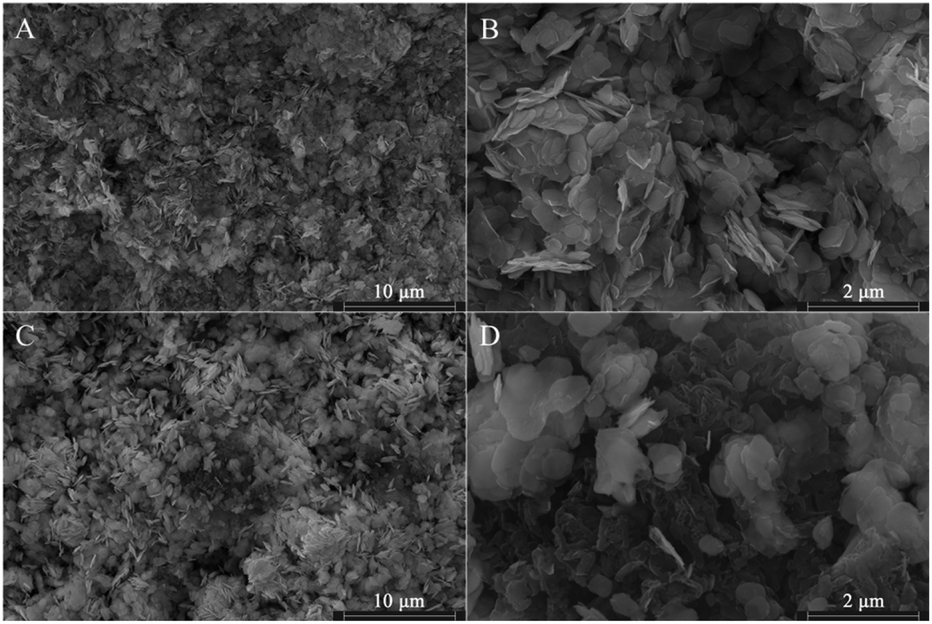 | ||
| Fig. 2 SEM images of the obtained products: pure BiOBr (A and B) and 7CN/BOB (C and D). | ||
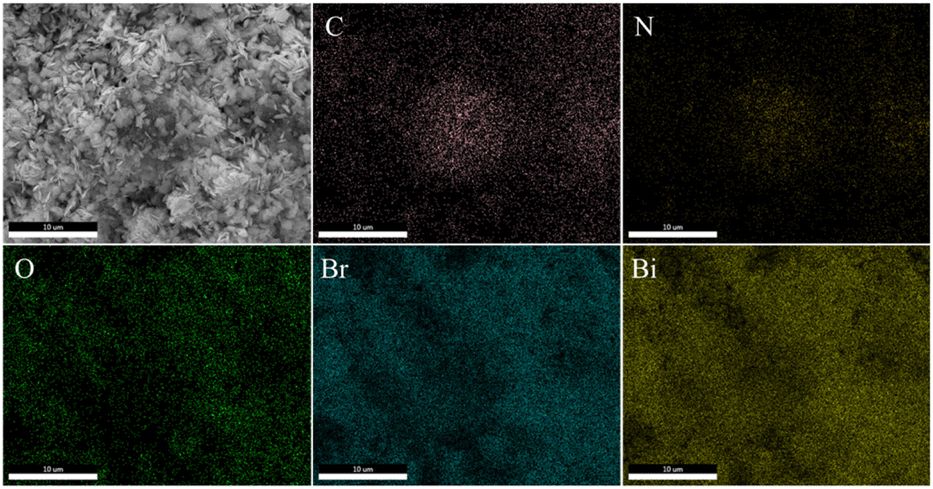 | ||
| Fig. 3 The corresponding elemental mapping images of C, N, O, Br and Bi in 7CN/BOB composites. | ||
The surface element composition and electronic structure of the prepared samples are investigated by the X-ray photoelectron spectroscopy (XPS) as shown in Fig. 4. All XPS figures are corrected by C 1s line with the energy of 284.7 eV. Fig. 4A shows the C 1s spectra of photocatalysts, and the peak with the binding energies at 288.1 eV and 284.7 eV of pure PCN sample corresponding to N–C![[double bond, length as m-dash]](https://www.rsc.org/images/entities/char_e001.gif) N and C–C bonds, respectively.32 Fig. 4B shows the N 1s spectra of the samples, and the two peaks at 398.6 eV and 401 eV of pure PCN sample belong to C–NC and tertiary nitrogen N–(C)3 bonds, respectively.33,34 As compared to the pure PCN, the C 1s and N 1s peaks of the N–CN bond shift to higher energy region after combined on BiOBr. The O 1s spectra of both pure BiOBr and the 7CN/BOB sample exhibit two main peaks located at 530.0 eV and 531.2 eV (Fig. 4C), which should be assigned to the lattice oxygen (Bi–O bond) and the surface O–H bond.31,35 It is noticed that a new peak appeared at 533.0 eV which can be assigned to the C–O bond.36 The Bi 4f spectrum of the BiOBr (Fig. 4D) sample exhibits two main peaks centered at 159.3 eV and 164.6 eV, which can be ascribed to the Bi 4f7/2, Bi 4f5/2 of Bi3+ peaks.30,37 The two obvious peaks of Br 3d (Fig. 4E) for bare BiOBr at 68.3 and 69.3 eV are attributed to the Br 3d5/2 and Br 3d3/2 of Br−1, respectively.29,38 It is obvious that the peaks for Bi 4f and Br 3d in the 7CN/BOB sample shifted to lower binding energy as compared to the pure BiOBr. The peak shift to higher energy always results from the decreased electron cloud density, while to lower energy results from the increased electron cloud density, implying that the electrons migrated from PCN to BiOBr which should cause from the lower Fermi level of BiOBr. Based on these discussions, it is indicated that an interaction between PCN and BiOBr is formed.
N and C–C bonds, respectively.32 Fig. 4B shows the N 1s spectra of the samples, and the two peaks at 398.6 eV and 401 eV of pure PCN sample belong to C–NC and tertiary nitrogen N–(C)3 bonds, respectively.33,34 As compared to the pure PCN, the C 1s and N 1s peaks of the N–CN bond shift to higher energy region after combined on BiOBr. The O 1s spectra of both pure BiOBr and the 7CN/BOB sample exhibit two main peaks located at 530.0 eV and 531.2 eV (Fig. 4C), which should be assigned to the lattice oxygen (Bi–O bond) and the surface O–H bond.31,35 It is noticed that a new peak appeared at 533.0 eV which can be assigned to the C–O bond.36 The Bi 4f spectrum of the BiOBr (Fig. 4D) sample exhibits two main peaks centered at 159.3 eV and 164.6 eV, which can be ascribed to the Bi 4f7/2, Bi 4f5/2 of Bi3+ peaks.30,37 The two obvious peaks of Br 3d (Fig. 4E) for bare BiOBr at 68.3 and 69.3 eV are attributed to the Br 3d5/2 and Br 3d3/2 of Br−1, respectively.29,38 It is obvious that the peaks for Bi 4f and Br 3d in the 7CN/BOB sample shifted to lower binding energy as compared to the pure BiOBr. The peak shift to higher energy always results from the decreased electron cloud density, while to lower energy results from the increased electron cloud density, implying that the electrons migrated from PCN to BiOBr which should cause from the lower Fermi level of BiOBr. Based on these discussions, it is indicated that an interaction between PCN and BiOBr is formed.
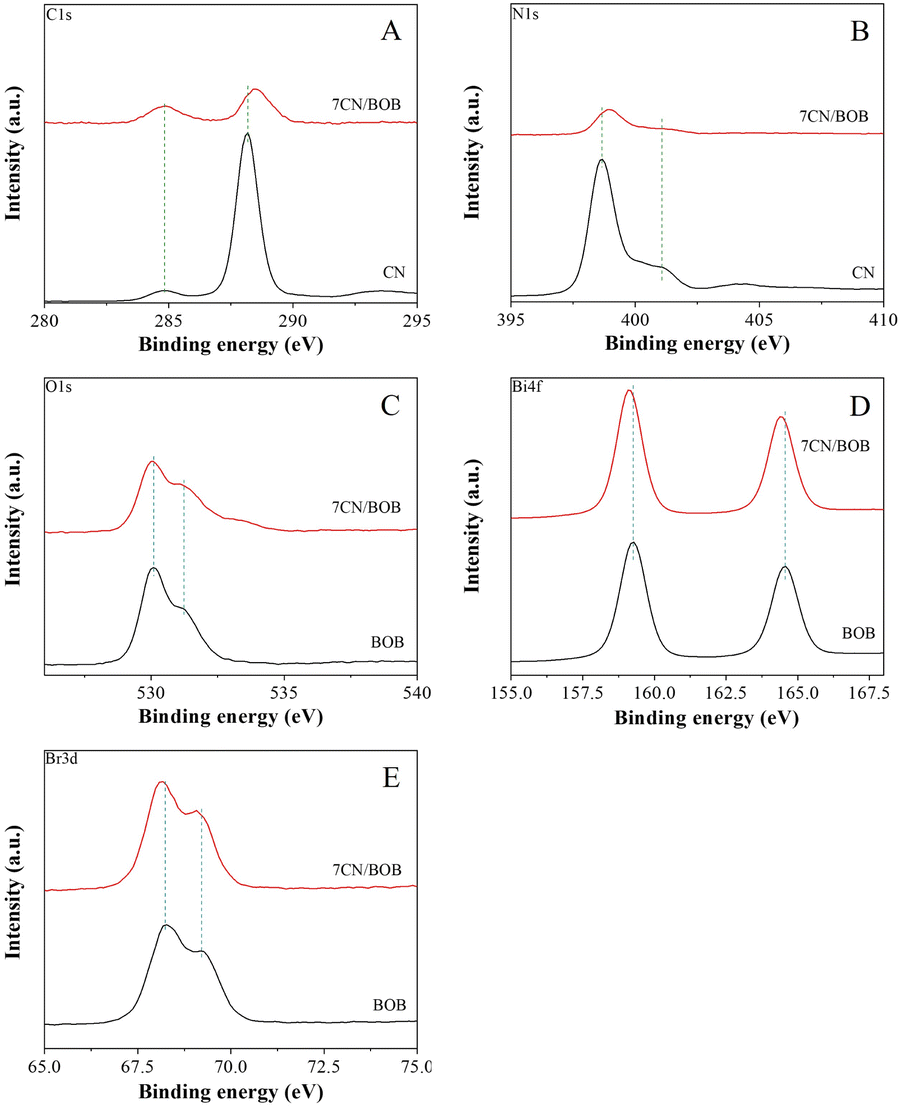 | ||
| Fig. 4 XPS analysis of CN, 7CN/BOB and pure BiOBr; (A) C 1s; (B) N 1s; (C) O 1s; (D) Bi 4f; (E) Br 3d. | ||
3.2 Photophysical properties and photocatalytic activities
The charge separation property of the samples was performed by comparing the yield hydroxyl radicals (·OH) formed from the interaction of photogenerated charge carriers and water. As the ·OH can be quantified by adding coumarin as the probe molecule to generate 7-hydroxy coumarin molecules which can give an emission luminescent around the wavelength of 456 nm in the excitation wavelength of 332 nm. Therefore, the higher fluorescence intensity corresponds to the larger amount of ·OH generated, and then proving the better charge separation property of the sample.39,40 As shown in Fig. 5A. It is confirmed that the fluorescence intensity on the XCN/BOB composites are higher than the bare BiOBr sample, and the 7CN/BOB sample shows the strongest response indicating the highest charge separation property. Thus, it is suggested that the photogenerated charge separation of BiOBr is enhanced by coupling with an appropriate amount of PCN.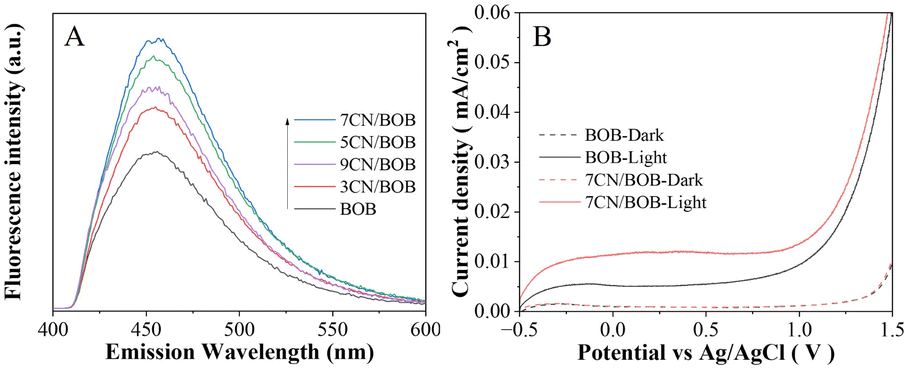 | ||
| Fig. 5 Fluorescence spectra related to the formed hydroxyl radicals (A) and I–V curves (B) under illumination (solid line) and in the dark (dashed line) of pure BiOBr and XCN/BOB. | ||
To further confirm the enhanced charge separation property, the BiOBr and 7CN/BOB samples were coated on the FTO glass and their photoelectrochemical (PEC) properties were investigated. As shown in the Fig. 5B, from the comparison between the currents in dark and under light, one can see that the samples exhibit photo-current mainly in the voltage range of 0–1.0 eV. Besides, the photocurrent density of the 7CN/BOB sample is higher than the pure BiOBr, indicating the higher charge separation property of the 7CN/BOB sample which is consist with the previous ·OH results. On the other hand, surface photovoltage spectroscopy (SPS) of the BiOBr and 7CN/BOB samples were also performed to further support the charge separation property measurements results (shown in Fig. S3†). Generally, higher SPS response corresponding to higher charge separation property, and the result shows that the SPS intensity of the 7CN/BOB sample is higher than the pure BiOBr which can further prove the above charge separation results.
Generally, stronger charge separation stands for higher photocatalytic activity. Thus, it is anticipated that coupling with PCN could improve the photocatalytic activities of BiOBr. The photocatalytic activities of samples are evaluated by 2,4-DCP degradation, as shown in Fig. 6A. The results showed that the 2,4-DCP photocatalytic degradation rate by BiOBr is only 37.5%, and the XCN/BOB composites exhibit higher performance while the 7CN/BOB possesses the highest activity with the degradation rate of 75.3%. Obviously, the photocatalytic performance patterns of the samples are in good agreement with the charge separation results, indicating the improved photocatalytic activities of BiOBr by coupling with an appropriate amount of PCN principally due to the enhanced photogenerated charge separation. Besides, the photostability and repeatability of the 7CN/BOB sample was studied as shown in Fig. 6B, it is indicated that the 7CN/BOB sample represents good stability in 5-run recyclable experiment.
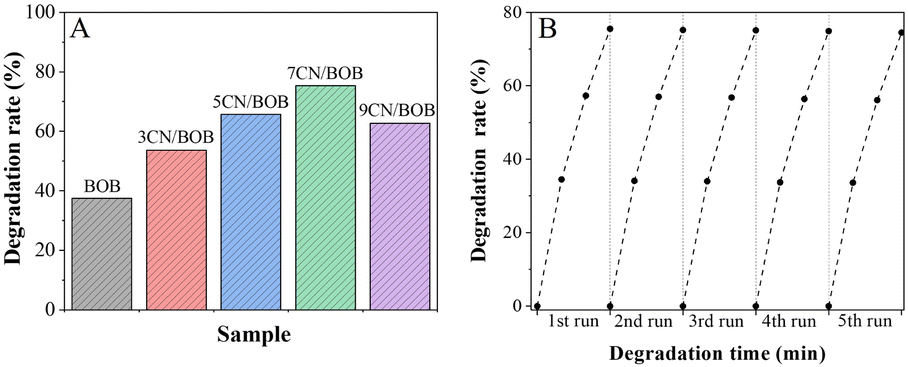 | ||
| Fig. 6 Photocatalytic activities (A) for degrading 2,4-DCP of pure BiOBr and XCN/BOB samples, and stability test (B) of 7CN/BOB. | ||
Generally, active species produced during the photocatalytic degradation of organic pollutants is an important factor which affecting the photocatalytic activity, and the possible active species of h+, ·O2− and ·OH could be analyzed by scavenger trapping experiments to clarify their contribution for degradation processes of 2,4-DCP.41,42 During the experiment, EDTA–2Na, isopropyl alcohol (IPA) and benzoquinone (BQ) were applied to trap h+, ·OH and ·O2−, respectively. As depicted in Fig. S4,† the degradation efficiency of 2,4-DCP decreased significantly with the addition of BQ while the ones with the addition of EDTA–2Na and IPA changed slightly, implying that the ·O2− was the dominant active specie involved in the degradation of 2,4-DCP and the ·OH and h+ were synergistic ones.
3.3 Discussion on mechanism
Based on the above results, a schematic is suggested to explain the processes of charge transfer and separation over the 7BOB/CN nanocomposite, as shown in Fig. 7. When PCN is combined with BiOBr, the electrons of PCN will migrate to BiOBr to balance their Fermi levels, and an electric field directed from PCN to BiOBr is thus generated. Meanwhile, band bending of PCN to upward and BiOBr to downward formed at the interface of the composite cause from the migration of electrons. When the sample is under irradiation, the electrons will be excited from the valence band to the conduction band. The photo-excited electrons of BiOBr will migrate to PCN under the effect of the electric field, and then recombine with the photo-generated holes of PCN. The residual electrons of PCN with higher reduction ability and holes of BiOBr with stronger oxidation ability are in a spatial separation state and can better initiate the photocatalytic reactions. This process is like the letter S, so it is figurative to call this composite a S-type heterojunction, and the improved photocatalytic performance can be attributed to this S-type mechanism.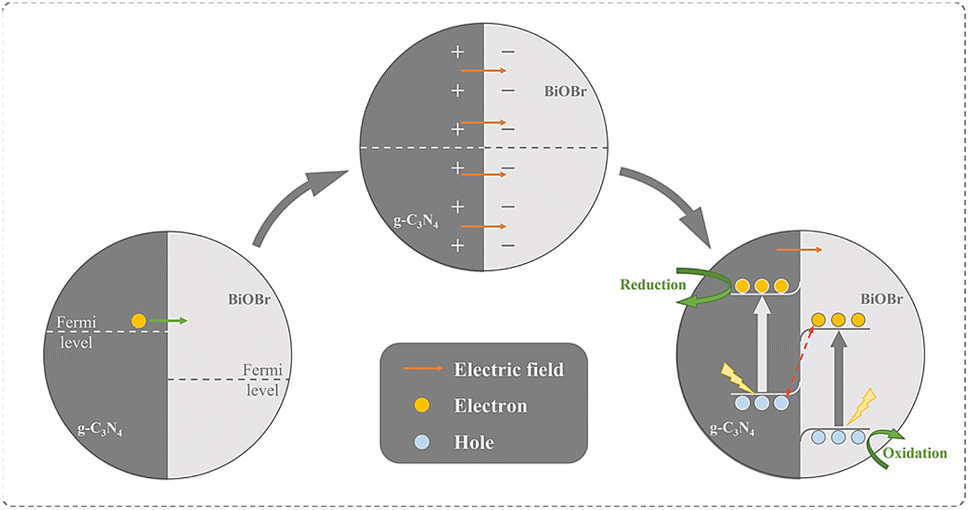 | ||
| Fig. 7 The mechanism schematic for charge transfer and separation and the induced reactions on g-C3N4/BiOBr. | ||
4. Conclusions
In summary, nanosheet-structured BiOBr is successfully synthesized by the hydrothermal method, and the PCN/BiOBr 2D composite is formed via the wet chemical method. The photocatalytic performance of degrading 2,4-DCP is improved by coupling PCN as compared to the pure BiOBr. The ·O2− species are proved to be the dominant reactive species during the photo-degradation reaction and the improved activity is proved to be attributed to the enhanced charge separation property. The mechanism for the promoted charge separation is the formed S-type heterojunction between PCN and BiOBr which can consume the electrons and holes with lower energy, while the high energy level ones remain in the CB of PCN and the VB of BiOBr with a spatial separation status to better initiate the photocatalytic reactions. It is expected that this work can provide a feasible strategy for constructing BiOBr-based catalysts with high photocatalytic performance.Author contributions
Shuangying Chen: conceptualization, methodology, investigation, writing-original draft. Fushui Guo: investigation, writing-review & editing. Liantao Hao: investigation, writing-review & editing. Xuliang Zhang: methodology, supervision, formal analysis, writing-review & editing, project administration, funding acquisition.Conflicts of interest
The authors declare that they have no known competing financial interests or personal relationships that could have appeared to influence the work reported in this paper.Acknowledgements
We are grateful for financial support from the National Natural Science Foundation of China (22002074).References
- J. Chen, N. Gao, X. Lu, M. Xia, Z. Gu, C. Jiang and Q. Wang, RSC Adv., 2016, 6, 100056–100062 RSC.
- X. Chen, X.-a. Ning, X. Lai, Y. Wang, Y. Zhang and Y. He, J. Hazard. Mater., 2021, 416, 125721 CrossRef CAS PubMed.
- X. Jin, J. Zha, Y. Xu, Z. Wang and S. S. Kumaran, Chemosphere, 2011, 84, 1506–1511 CrossRef CAS PubMed.
- Y. Chu, X. Zheng and J. Fan, Chem. Eng. J., 2022, 431, 134020 CrossRef CAS.
- M. Humayun, W. Pi, Y. Yuan, L. Shu, J. Cao, A. Khan, Z. Zheng, Q. Fu, Y. Tian and W. Luo, J. Colloid Interface Sci., 2021, 599, 484–496 CrossRef CAS PubMed.
- Y. Ma, Y. Gu, D. Jiang, X. Mao and D. Wang, J. Hazard. Mater., 2021, 413, 125381 CrossRef CAS PubMed.
- M. Pan, S.-Y. Tang-Hu, C. Li, J. Hong, S. Liu and B. Pan, J. Hazard. Mater., 2023, 441, 129944 CrossRef CAS PubMed.
- W. Yu, M. Xu, X. Liang, J. Wang, W. Fang and F. Wang, Chemosphere, 2023, 313, 137591 CrossRef CAS PubMed.
- F. Wang, N. Ma, L. Zheng, L. Zhang, Z. Bian and H. Wang, Chemosphere, 2022, 307, 135666 CrossRef CAS PubMed.
- J. Sun, C. Jiang, Z. Wu, Y. Liu and S. Sun, Chemosphere, 2022, 308, 136107 CrossRef CAS PubMed.
- C. Liu, S. Mao, M. Shi, X. Hong, D. Wang, F. Wang, M. Xia and Q. Chen, Chem. Eng. J., 2022, 449, 137757 CrossRef CAS.
- S. Huang, Y. Wang, J. Wan, Z. Yan, Y. Ma, G. Zhang and S. Wang, Appl. Catal., B, 2022, 319, 121913 CrossRef CAS.
- Y. Ding, Y. Cao, D. Chen, J. Li, H. Wu, Y. Meng, J. Huang, J. Yuan, Y. Su, J. Wang and H. Li, Chem. Eng. J., 2023, 452, 139687 CrossRef CAS.
- Y. Ren, T. Gong, S. Tan, M. Chen, F. Zhou, Y. Lin, L. Yang and Q. Peng, J. Alloys Compd., 2022, 902, 163752 CrossRef CAS.
- P. Chang, Y. Wang, Y. Wang and Y. Zhu, Chem. Eng. J., 2022, 450, 137804 CrossRef CAS.
- Z. Zhang, L. Li, Y. Jiang and J. Xu, Inorg. Chem., 2022, 61, 3351–3360 CrossRef CAS PubMed.
- L. Zhang, F. Xie, J. Liu, Z. Sun, X. Zhang, Y. Wang, Y. Wang, R. Li and C. Fan, Chem. Eng. J., 2022, 450, 138066 CrossRef CAS.
- Q. Yang, W. Qin, Y. Xie, K. Zong, Y. Guo, Z. Song, G. Luo, W. Raza, A. Hussain, Y. Ling, J. Luo, W. Zhang, H. Ye and J. Zhao, Sep. Purif. Technol., 2022, 298, 121603 CrossRef CAS.
- Z. He, H. Fareed, H. Yang, Y. Xia, J. Su, L. Wang, L. Kang, M. Wu and Z. Huang, J. Colloid Interface Sci., 2023, 629, 355–367 CrossRef CAS PubMed.
- G. Ren, M. Shi, Z. Li, Z. Zhang and X. Meng, Appl. Catal., B, 2023, 327, 122462 CrossRef CAS.
- Y. Liu, Z. Hu and J. C. Yu, Chemosphere, 2021, 278, 130376 CrossRef CAS PubMed.
- W. Li, X. Li, X. Fu, Z. Lou, Y. Zhu and Y. Zhang, Chem. Eng. J., 2023, 451, 138932 CrossRef CAS.
- J. Hu, Y. Chen, Y. Zhou, L. Zeng, Y. Huang, S. Lan and M. Zhu, Appl. Catal., B, 2022, 311, 121369 CrossRef CAS.
- C. Wen, D. Li, J. Zhong, Z. Wang, S. Huang, H. Liu, J. Wu, P. Chen, W. Lv and G. Liu, Chem. Eng. J., 2022, 450, 138075 CrossRef CAS.
- W. Wang, X. Li, F. Deng, J. Liu, X. Gao, J. Huang, J. Xu, Z. Feng, Z. Chen and L. Han, Chin. Chem. Lett., 2022, 33, 5200–5207 CrossRef CAS.
- N. Qin, S. Zhang, J. He, F. Long and L. Wang, J. Alloys Compd., 2022, 927, 166661 CrossRef CAS.
- J. Xu, L. Zhang, R. Shi and Y. Zhu, J. Mater. Chem. A, 2013, 1, 14766–14772 RSC.
- J. Xiao, J. Rabeah, J. Yang, Y. Xie, H. Cao and A. Brückner, ACS Catal., 2017, 7, 6198–6206 CrossRef CAS.
- Z. Miao, Q. Wang, Y. Zhang, L. Meng and X. Wang, Appl. Catal., B, 2022, 301, 120802 CrossRef CAS.
- Y. Zhang, J. Di, X. Zhu, M. Ji, C. Chen, Y. Liu, L. Li, T. Wei, H. Li and J. Xia, Appl. Catal., B, 2023, 323, 122148 CrossRef CAS.
- X.-j. Wang, W.-y. Yang, F.-t. Li, J. Zhao, R.-h. Liu, S.-j. Liu and B. Li, J. Hazard. Mater., 2015, 292, 126–136 CrossRef CAS PubMed.
- J. Zhao, T. Guo, H. Wang, M. Yan and Y. Qi, J. Alloys Compd., 2023, 947, 169613 CrossRef CAS.
- B. Qu, P. Li, L. Bai, Y. Qu, Z. Li, Z. Zhang, B. Zheng, J. Sun and L. Jing, Adv. Mater., 2023, 35, 2211575 CrossRef CAS PubMed.
- Y. Wang, Y. Qu, B. Qu, L. Bai, Y. Liu, Z.-D. Yang, W. Zhang, L. Jing and H. Fu, Adv. Mater., 2021, 33, 2105482 CrossRef CAS PubMed.
- Y. Yao, M. Sun, X. Yuan, Y. Zhu, X. Lin and S. Anandan, Ultrason. Sonochem., 2018, 49, 69–78 CrossRef CAS PubMed.
- Y. Zhang, M. Park, H. Y. Kim, B. Ding and S.-J. Park, Sci. Rep., 2017, 7, 45086 CrossRef CAS PubMed.
- T. Xian, X. Sun, L. Di, C. Sun, H. Li, C. Ma and H. Yang, Appl. Surf. Sci., 2023, 638, 158136 CrossRef CAS.
- Y. Wu, H. Ji, Q. Liu, Z. Sun, P. Li, P. Ding, M. Guo, X. Yi, W. Xu, C.-C. Wang, S. Gao, Q. Wang, W. Liu and S. Chen, J. Hazard. Mater., 2022, 424, 127563 CrossRef CAS PubMed.
- Y. Wang, Y. Tang, J. Sun, X. Wu, H. Liang, Y. Qu and L. Jing, Appl. Catal., B, 2022, 319, 121893 CrossRef CAS.
- J. Bian, Z. Zhang, J. Feng, M. Thangamuthu, F. Yang, L. Sun, Z. Li, Y. Qu, D. Tang, Z. Lin, F. Bai, J. Tang and L. Jing, Angew Chem. Int. Ed. Engl., 2021, 20906–20914 CrossRef CAS PubMed.
- Y. Chen, C. Chen, Y. Liu and L. Yu, Chin. Chem. Lett., 2023, 34, 108489 CrossRef CAS.
- Y. Zhang, W. Li, Z. Hu, X. Jing and L. Yu, Chin. Chem. Lett., 2023, 35, 108938 CrossRef.
Footnote |
| † Electronic supplementary information (ESI) available. See DOI: https://doi.org/10.1039/d3ra08028e |
| This journal is © The Royal Society of Chemistry 2024 |