DOI:
10.1039/D3RA08197D
(Paper)
RSC Adv., 2024,
14, 2687-2696
Exploring the effect of boron on the grain morphology change and spectral properties of Eu3+ activated barium tantalate phosphor
Received
30th November 2023
, Accepted 9th January 2024
First published on 16th January 2024
Abstract
The effect of the grain morphology on the photoluminescence, charge transfer band, and decay properties was investigated by xEu3+, yB3+ (x = 10 mol%, y = 0, 5, 15, 30, 50, 70, and 100 mol%) co-doped BaTa2O6 ceramics fabricated by solid-state reaction. X-ray diffractions of the samples showed that the single-phase structure persisted up to 100 mol% and there was an improvement in crystallinity with increasing B3+ concentration. SEM micrographs of the Eu3+, B3+ co-doped grains showed that the flux effect of boron promotes grain growth and elongated grain shape. The PL emissions of the BaTa2O6:xEu3+, yB3+ co-doped phosphors increased up to 100 mol% B3+ concentration, and there was an increase in the intensities of the CTB energy 5D0 → 7F1 transition. The increase in PL may be attributed to the increased grain size leading to a decrease in the surface area (SA)/volume (vol) ratio with increasing B3+ concentration, as well as the improvement in crystallinity. However, the decrease in asymmetry ratio was related to the occupation of centrosymmetric (B) sites and the transformation from a rounded/irregular-like to an elongated/rod-like grain shape which has an increasing effect on the SA/vol ratio. The decreasing trend of the Judd–Ofelt parameters (Ω2, and Ω4) with the increase in boron was related to a high local symmetry of Eu3+ sites, and an increase in the electron density of the surrounding ligands, respectively. The increase in boron led to longer decays in the observed lifetime with bi-exponential characteristics. The CIE diagram and UV lamp photographs of the phosphors showed a color transition from red to orange associated with the increasing magnetic dipole transition. This study may provide an alternative perspective and new strategies to describe the control of grain morphology and luminescence concerning RE-doped phosphors.
1. Introduction
Promising advances are being made in a variety of applications, including solid-state lasers, LEDs, optical communication, and temperature sensing, due to the activation of phosphors with trivalent rare earth ions (RE3+). Their unique optical properties such as extended luminescence times, narrow emission ranges, and excellent photostability are of great interest.1–8 In the development of luminescent materials, the grain morphology of ceramic phosphors has an effect on the luminescence. Therefore, the grain size, and grain shape of phosphor may play an important role in the correlation between the material and spectral properties.9–19 In the literature, researchers have drawn attention to the effects of morphological features such as grain size and grain shape on the luminescence mechanism, where the surface area (SA) to volume (vol) ratio is an important parameter.9–19 Boron vitrification plays an effective role in grain morphology, increasing crystallization, reducing sintering temperature, and improving optical and structural properties.18–22 The enhancement of luminescence with boron doping has been pointed out in many studies to be related to improved crystallinity.23–25 However, there are also some studies showing the luminescence increase along with the decrease in crystallization with the doping of boron.26,27 The photoluminescence of boron co-doped Ba0.88Mg0.93Al10O16.96:Eu3+ phosphor has been studied by Dulda et al.28 where the grain size and crystallinity of phosphor increased as the grain shape changed from rod to hexagonal shape. Moreover, some studies have been performed by İlhan et al. on Eu3+, B3+ co-doped SrTa2O6,18 and Dy3+, B3+ co-doped CdNb2O6 (ref. 19) phosphors, where it is emphasized that the increased luminescence is closely related to grain morphology.
Tetragonal is the middle-temperature polymorph of BaTa2O6 that occurs between 1150–1300 °C, and this polymorph related to tetragonal tungsten bronze (TTB) structure which can remain kinetically stable at high temperatures (e.g. 1550 °C).29–31 TTB crystal structure belongs to a wide family of functional materials and offers a large scale of doping possibilities due to its suitable structure for different cationic dopants. TTB oxide structures having the A2BC2M5O15 formula (M = Ta, Nb) consist of three types of sites in which the pentagonal (A), square (B), and triangular (C) tunnels are represented by 15, 12, and 9 CN, respectively.29,30
In this paper, we reported the effect of grain size and grain shape on spectral properties with a systematic study, which has been scarcely researched before in the literature. In our previous two studies,18,19 effect of boron dopant has been examined up to 20 and 25 mol% concentrations, respectively. However, in this detailed study, the relationship between spectral properties and grain morphology was investigated by increasing the boron concentration up to 100 mol%, and interesting results were obtained. Depending on the structural and morphological changes with increasing boron concentration, the effects of varying grain size, grain shape, and different SA/vol ratios on luminescence, charge transfer band, decay properties, and Judd–Ofelt parameters were studied by applying XRD, SEM, PL, and decay analyses.
2. Experimental
BaTa2O6:xEu3+, yB3+ (x = 10 mol%, y = 0, 5, 15, 30, 50, 70, 100 mol%) samples were fabricated by solid-state method. The BaCO3 (Sigma-Aldrich, 99%), Ta2O5 (Alfa Aesar, 99.9%), Eu2O3 (Alfa Aesar, 99.9%), and H3BO3 (Kimyalab, %99.9) were used in the synthesis process. The stoichiometric amount of the starting materials was mixed and ground well in an agate mortar to provide homogeneity. Then, by adding europium oxide (Eu2O3) and boric acid (H3BO3), the final mixture of the powders was thoroughly mixed and ground in an agate mortar for the last time to provide more homogeneity. For the sintering process, a sufficient amount of mixture was taken and sintered in an alumina crucible at 1425 °C for 20 h after pelleting.
The phase compositions of the samples were identified by XRD (X-ray diffractometer; PANanalytical Empyrean, U.K.) using Cu Kα radiation between 2θ = 20–70 °C with scan speed 2 °C min−1. The grain morphologies of the samples were investigated by SEM (scanning electron microscopy; FE-SEM; Gemini 500, Zeiss Corp., Germany). Photoluminescence (PL) results were taken by a fluorescence spectrometer (FLS920, Edinburgh Instruments, UK) equipped with a 450 W ozone-free Xe lamp. Lifetime data were also obtained by a fluorescence spectrometer (FLS920) using the time-correlated single-photon counting (TCSPC) system. All the analyses were performed at room temperature.
3. Results and discussions
3.1 XRD and SEM results
XRD results of 10 mol% Eu3+ and yB3+ (y = 0, 5, 15, 30, 50, 70, 100 mol%) co-doped BaTa2O6 ceramic samples are shown in Fig. 1. XRD patterns of BaTa2O6 showed a single tetragonal tungsten bronze structure (JCPDS card no: 17-0793) with space group P4/mbm (127). The absence of any minor phase can be explained by the successful incorporation of Eu3+ ions in the A and B sites of the TTB host and the dissolution of co-doped boron with different concentrations in the three tunnels of the structure. On the other hand, increasing B3+ concentration led to an increase in (001) and (002) XRD reflections, which would be attributed to a z-direction orientation. As mentioned in the SEM part, this phenomenon is related to the grain elongation of BaTa2O6 at high temperatures,31,32 and also the boron vitrification may cause a similar effect in the structure. The shift of XRD peaks (311) towards the smaller two theta angles is shown in Fig. 2. The B3+ ions occupying the structure with a small ionic radius potentially caused an expansion in the lattice due to increased positive charge. Table 1 summarizes the variation of lattice data of all samples. The lattice data for 0 and 100 mol% B3+ samples are a = 12.6272 Å, c = 3.8916 Å, V = 620.51 Å3, and a = 12.7436 Å, c = 3.9052 Å, V = 634.20 Å3, respectively, in which the lattice volume increased as 2.2%. Additionally, in Fig. 2, the narrowing XRD peaks with increasing B3+ indicate an increase in crystallinity. The crystallite size of the samples determined using the Scherrer equation is given in Table 1, where the crystallite sizes from 0 to 100 mol% B3+ co-doped samples changed to 32.58 and 50.53 nm, respectively. The enhancement in crystal size may be attributed to the reduction in nucleation and lattice deformation resulting from increased boron concentration.
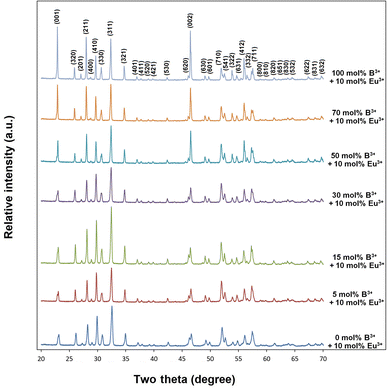 |
| | Fig. 1 XRD results of 10 mol% Eu3+ and 0, 5, 15, 30, 50, 70, and 100 mol% B3+ co-doped BaTa2O6 samples. | |
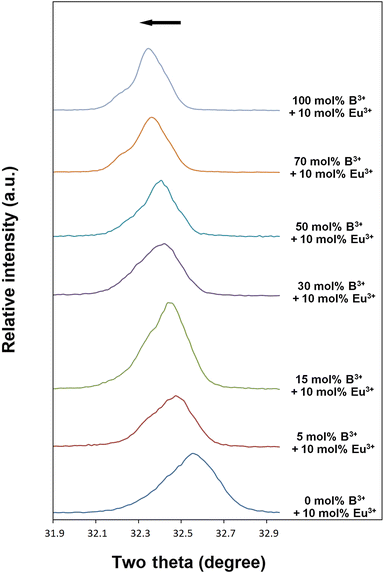 |
| | Fig. 2 Shift of XRD two theta peaks (311) to lower angles. | |
Table 1 Cell parameters and average crystallite sizes for Eu3+, B3+ co-doped BaTa2O6
| Sample |
Lattice parameters |
Crystallite size |
| a (Å) |
c (Å) |
V (Å)3 |
D (nm) |
| JPCDS card no. 17-0793 |
12.5600 |
3.9580 |
624.39 |
— |
| 0 mol B3+ 10 mol% Eu3+ |
12.6272 |
3.8916 |
620.51 |
32.58 |
| 5 mol B3+ 10 mol% Eu3+ |
12.6452 |
3.8986 |
623.39 |
39.60 |
| 15 mol B3+ 10 mol% Eu3+ |
12.6740 |
3.8990 |
626.30 |
41.68 |
| 30 mol B3+ 10 mol% Eu3+ |
12.7024 |
3.9004 |
629.33 |
40.48 |
| 50 mol B3+ 10 mol% Eu3+ |
12.7088 |
3.9010 |
630.07 |
48.49 |
| 70 mol B3+ 10 mol% Eu3+ |
12.7364 |
3.9046 |
633.39 |
49.71 |
| 100 mol B3+ 10 mol% Eu3+ |
12.7436 |
3.9052 |
634.20 |
50.53 |
Fig. 3(a–g) shows SEM micrographs of Eu3+, B3+ co-doped ceramic samples at 5000× magnification and 10 kV acceleration voltage. As seen from the SEM micrographs, boron doping promoted agglomeration, grain growth, and rod-like shape in grains. The elongation tendency of grains may be attributed to the vitrification effect improved by the presence of B3+, which is supported by (001) and (002) XRD reflections. In Fig. 3a, the undoped boron sample has a small grain size, and a round-like irregular grain-shaped morphology, while the grain sizes usually range from 0.5 to 1.5 μm. In Fig. 3b, the growing and elongating tendency of the grains started to occur in the 5 mol% B3+ co-doped sample, and it became more pronounced at 15 mol% B3+ (Fig. 3c). In Fig. 3d, the grain shape of 30 mol% B3+ doped sample had almost rod-like and thick-grained appearance while the growth and elongation trend in the grains continued for higher B3+ concentrations as seen in Fig. 3(e–g). In Fig. 3e, the amount of the grains with small size was considerably decreased at 50 mol% B3+, and it nearly disappeared at 70 (Fig. 3f) and 100 mol% (Fig. 3g) B3+ concentrations. The grain sizes for the without boron sample varied between 0.5–3.0 μm, while the thicknesses and lengths of the grains reached the range of 1.5–10 μm and 5–40 μm, for 100 mol% B3+ concentration, respectively.
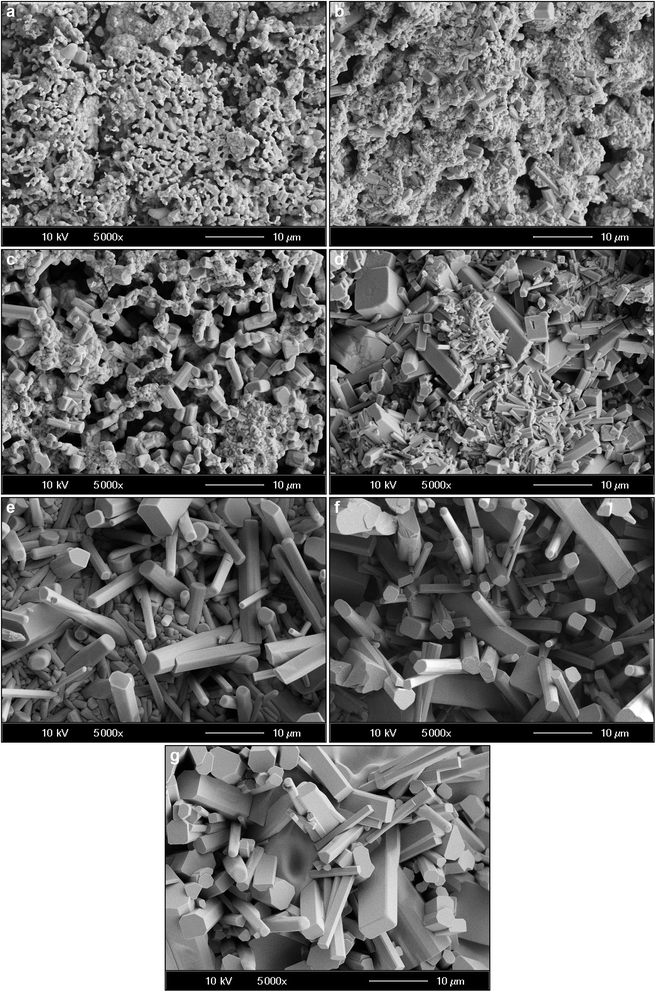 |
| | Fig. 3 SEM micrographs of 10 mol% Eu3+, and different concentrations B3+ co-doped BaTa2O6 samples: (a) 0 mol%, (b) 5 mol% B3+, (c) 15 mol% B3+, (d) 30 mol% B3+, (e) 50 mol% B3+, (f) 70 mol% B3+, (g) 100 mol% B3+, under 10 kV accelerating voltage at 5.000× magnifications. | |
3.2 Spectral properties for BaTa2O6:xEu3+, yB3+ (x = 10 mol%, y = 0, 5, 15, 30, 50, 70, and 100 mol%) phosphors
Fig. 4 shows PL excitation spectra of BaTa2O6:xEu3+, yB3+ (x = 10 mol%, y = 0, 5, 15, 30, 50, 70, 100 mol%) phosphors recorded at λem = 618 nm. PL excitations of all the phosphors were assigned by the 7F0 → 5D4, 7F0 → 5GJ, 7F0 → 5L6, 7F0 → 5D3, and 7F0 → 5D2 transitions, which are related to the intra-configurational (f–f) transitions of Eu3+. In Fig. 4, the peaks associated with the CTB transition have a broadband and a maximum in the 340–350 nm range. The CTB peaks over 300 nm are related to the ligand nature of TTB structure due to the ligand environment with highly coordinated A and B tunnels.33,34 As reported in similar studies,18,29 the CTB transition intensity increased with increasing intensity of magnetic dipole transition or the formal reduction of Eu3+ to Eu2+ is increasing. Fig. 5 shows the PL emissions of BaTa2O6:xEu3+, yB3+ (x = 10 mol%, y = 0, 5, 15, 30, 50, 70, 100 mol%) phosphors monitored by the 5D0 → 7FJ, (J = 0, 1, 2, 3, 4, 5) transitions under excitation of 394 nm, in which the phosphor luminescence increased up to 100 mol% B3+ concentration. The increase in luminescence can be evaluated in terms of crystallinity and morphology. As mentioned in XRD results, the improved crystallinity will contribute to the increase of the luminescence of BaTa2O6:Eu3+, B3+. On the other hand, literature results on the luminescence increase despite decreasing crystallinity26,27 show that morphological parameters such as grain size and grain shape are very important in the increase in luminescence. The effects of the grain size and grain shape on luminescence are reported by different researchers. Kim and Kang9 highlighted that an increase in grain size led to an increase in luminescence due to the reduced presence of non-luminescent centers near the grain surface. Shan et al.10 investigated the effects of nanocrystals with different shapes on luminescence using surface area (SA)/volume (vol) ratios. Some researchers11–13 suggested that phosphors with spherical grain morphology exhibit superior spectral characteristics, including reduced light scattering, enhanced luminescence, and higher definition. Accordingly, the effect of boron may be evaluated in terms of size and shape changes in the grains. Although the increase in boron concentration caused the grain size to increase, there was a deviation from the spherical grain shape due to grain elongation. The transformation of the grains from an irregular/round-like shape to an elongated/rod-like shape would be likely to support an increase in the SA/vol ratio. However, if the grain shape is preserved or there is no grain elongation, grain growth will contribute more to the decrease of the SA/vol ratio, and the activation of luminescence centers near the surface will increase further. In this process, since grain growth and grain elongation occur together, grain elongation will contribute to an increase in the SA/vol ratio. However, although there is an increase in luminescence, the difference in asymmetry ratio (5D0 → 7F2/5D0 → 7F1) is remarkable. The variation of the asymmetry ratio and B3+ concentration is shown in Fig. 6. The emission increases were about 11 and 3 fold from 0 to 100 mol% B3+ for the magnetic dipole transition (5D0 → 7F1) and the electric dipole transition (5D0 → 7F2), respectively. In TTB structure, the pentagonal (A) sites are non-centrosymmetric and associated with the 5D0 → 7F2 transition, where Eu3+ ions are sensitive to the crystal field. The square (B) sites are centrosymmetric and related to the 5D0 → 7F1 transition in which the behavior of Eu3+ ions will not be affected by the crystal field.33 The Eu3+ ions inserted to TTB-host are more likely to occupy A sites (15 CN) rather than B sites (12 CN). The improving magnetic dipole transition indicated that the increased presence of boron increases the activation of Eu3+ ions in the B sites. On the other hand, based on the increase in 5D0 → 7F1 transition, a correlation between grain elongation and B site occupancy is noticeable. The magnetic dipole transitions of lanthanide ions are multiple transitions with strong magnetic dipole character and emission wavelengths throughout the near-infrared, visible, and ultraviolet (UV) spectral range, however, most of these transitions typically involve highly excited states that are rapidly decayed by non-radiative pathways such as multiphonon relaxation process.35 Shan et al.10 highlighted that prism and rod nanocrystals with the same surface area (SA)/volume (vol) ratios can exhibit different lattice energies and multiphonon relaxation processes. Furthermore, the phosphor with low luminescence generally has a larger surface-to-volume (SA/vol) ratio and a higher quenching defect fraction than the phosphor with good luminescence. The low phonon energy modes are cut off at smaller particle sizes due to the phonon confinement effect significantly reducing the energy transfer and luminescence between a donor and an acceptor.36–38 Consequently, based on the occupancy of B site, the magnetic dipole character supports the multiphonon relaxation process, and it is also likely that the elongated grain shape with increasing grain size of the phosphor promotes the multiphonon relaxation process due to the difference in phonon energy.
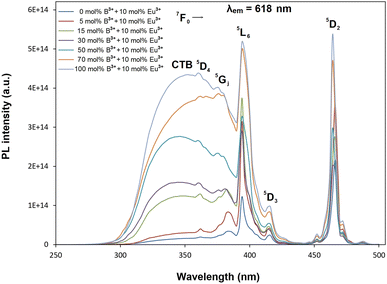 |
| | Fig. 4 PL excitation spectra and charge transfer bands of BaTa2O6:xEu3+, yB3+ phosphors corresponding to 618 nm emission. | |
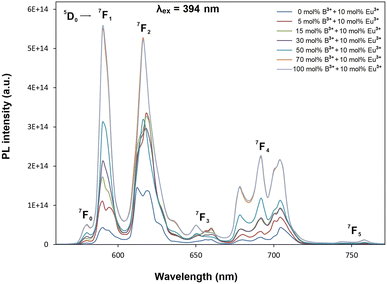 |
| | Fig. 5 PL emission spectra of BaTa2O6:xEu3+, yB3+ phosphors with excitation of 394 nm. | |
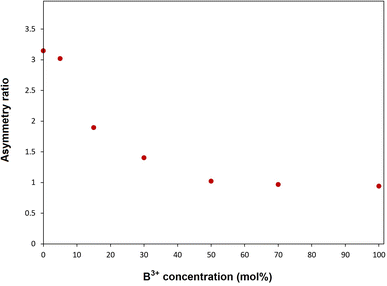 |
| | Fig. 6 Asymmetry ratio and boron concentration variation of BaTa2O6:xEu3+, yB3+ phosphors. | |
Judd–Ofelt (JO) theory explains the intensity of electron transitions in 4f shell of rare-earth ions using three parameters and describes their spectral properties.39,40 The JO intensity parameters ΩJ (J = 2, 4, 6) from the emission spectrum for Eu3+ can be determined by eqn (1):
| |
 | (1) |
where
V is the transition frequency,
I1 and
IJ for
5D
0 →
7F
1 and
5D
0 →
7F
J transitions are the integrated intensities, respectively,
SMD = 9.6 × 10
−42 (esu
2 cm
2) is the magnetic dipole line strength,
n is the refractive index,
e = 4.803 × 10
−10 (esu) is the elementary charge,
J and
J′ for the initial state and final state are the total angular momentum, respectively, |〈
J‖
UJ‖
J〉|
2 is the symbol of double reduced matrix elements for unit tensor operators. For all electric dipole (ED) transitions originating from the
5D
0 level, the reduced matrix elements are zero except for the
5D
0 →
7F
2 (
U2 = 0.0032),
5D
0 →
7F
4 (
U4 = 0.0023) and
5D
0 →
7F
6 (
U6 = 0.0002) transitions. The
5D
0 →
7F
J (
J = 1, 2, 4, 6) transitions are used for the determination of the radiative transition probabilities while
5D
0 →
7F
J (
J = 0, 3, 5) transitions are prohibited, and are not included JO calculation. The
5D
0 →
7F
6 transition related to
Ω6 parameter was not included in the calculation because it could not be detected by PL in the infrared region. However, the effect of this transition on the calculation is negligible, which has been reported in some studies.
18,29 The spontaneous transition probability (
A) is related to its dipole strength which can be expressed as
eqn (2):
| |
 | (2) |
where
SED (electric dipole) and
SMD (magnetic dipole) are line strengths (in esu
2 cm
2), and
h is Planck constant. The electric dipole line strengths (
SED) from the JO parameters can be calculated by
eqn (3):
| |
 | (3) |
The  and
and  are the local field corrections for the ED and MD transitions which can be found by eqn (4) and (5) respectively:
| |
 | (4) |
| |
 | (5) |
where
n is the refractive index of BaTa
2O
6 which was taken as 1.891 from ref.
29 and
41 The Judd–Ofelt intensity parameters (
Ω2,
Ω4) are given in
Table 2. The parameter
Ω2, which is closely related to the hypersensitive electric dipole transition (
5D
0 →
7F
2), indicates the covalency of the Eu–O bond character and the environmental changes of the Eu
3+ ion. The parameter
Ω4 is related to the electron density of the surrounding ligands, where an increase in the
Ω4 parameter shows a decreased electron density.
18,42 In
Table 2, the
Ω2 parameter decreased from 5.299 to 1.506 × 10
−20 cm
2, and the
Ω4 parameter decreased from 3.794 and 1.541 × 10
−20 cm
2, with increasing B
3+ concentration, respectively. The decreasing trend in the
Ω2 parameter showed weak covalent or strong ionic character of the Eu–O bond and high local symmetry of the Eu
3+ sites, while the decrease in
Ω4 parameter indicated an increase in the electron density of the surrounding ligands. Moreover, the decreased
Ω4 parameter may be attributed to the increased charge transfer in the host which may be attributed to the reduction of Eu
3+ to Eu
2+ and a decrease in the electric dipole intensity. The branching ratio (
β) of the Judd–Ofelt theory can be obtained from the radiated transition probability (
A(
J, J′)) and the total radiated transition probability (Σ
A(
J,
J′)) using
eqn (6), the results are given in
Table 2:
| |
 | (6) |
Table 2 J–O parameters (Ω2, Ω4), radiative transition and total transition probabilities (A(J,J′), (Ar)), and branching ratios (β), of BaTa2O6:xEu3+, yB3+ (x = 10 mol%, y = 0, 5, 15, 30, 50, 70, and 100 mol%) phosphors
| B3+ conc. (mol%) |
Eu3+ transitions |
Ω2 (10−20 cm2) |
Ω4 (10−20 cm2) |
A(J,J′) (s−1) |
Ar (s−1) |
β (%) |
| 0 |
5D0 → 7F1 |
5.299 |
3.794 |
99.008 |
556.462 |
17.79 |
| 5D0 → 7F2 |
339.338 |
60.98 |
| 5D0 → 7F4 |
118.115 |
21.23 |
| 5 |
5D0 → 7F1 |
4.878 |
2.417 |
99.092 |
486.692 |
20.36 |
| 5D0 → 7F2 |
312.352 |
64.18 |
| 5D0 → 7F4 |
75.249 |
15.46 |
| 15 |
5D0 → 7F1 |
3.063 |
2.014 |
99.011 |
357.839 |
27.67 |
| 5D0 → 7F2 |
196.130 |
54.81 |
| 5D0 → 7F4 |
62.697 |
17.52 |
| 30 |
5D0 → 7F1 |
2.240 |
1.659 |
98.843 |
293.924 |
33.63 |
| 5D0 → 7F2 |
143.416 |
48.79 |
| 5D0 → 7F4 |
51.665 |
17.58 |
| 50 |
5D0 → 7F1 |
1.645 |
1.437 |
98.744 |
248.823 |
39.68 |
| 5D0 → 7F2 |
105.324 |
42.33 |
| 5D0 → 7F4 |
44.755 |
17.99 |
| 70 |
5D0 → 7F1 |
1.546 |
1.542 |
98.846 |
245.835 |
40.21 |
| 5D0 → 7F2 |
98.978 |
40.26 |
| 5D0 → 7F4 |
48.012 |
19.53 |
| 100 |
5D0 → 7F1 |
1.506 |
1.541 |
98.817 |
243.259 |
40.62 |
| 5D0 → 7F2 |
96.461 |
39.65 |
| 5D0 → 7F4 |
47.981 |
19.73 |
The branching ratio of the phosphors for the 5D0 → 7F2 transition decreased due to the increasing magnetic dipole character. The β ratio of electric and magnetic transitions from 0 to 100 mol% B3+ changed to 60.98–39.65% and 17.79–40.62%, respectively.
Fig. 7 shows the decay curves of 5D0 → 7F2 transition (618 nm) with excitation of 394 nm, for Eu3+, B3+ co-doped phosphors. The two exponential decay curves can be defined using eqn (7):
| |
 | (7) |
where
It is PL intensity,
t is the time after excitation,
I0 is the background,
I1 and
I2 are luminescence intensities corresponding to
τ1 (long) and
τ2 (short) lifetimes, respectively. Accordingly, the average or observed lifetime (
τ) can be found by
eqn (8):
41–45| |
 | (8) |
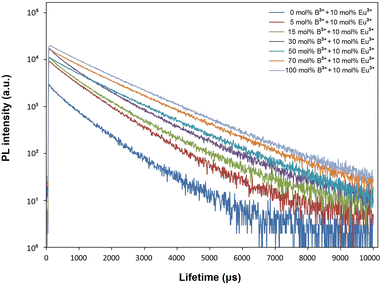 |
| | Fig. 7 Decay curves of BaTa2O6:xEu3+, yB3+ phosphors with the emission of 618 nm and excitation of 394 nm. | |
The variation of the bi-exponential decays depending on B3+ concentration is given in Table 3. The observed lifetimes increased from 0.934 to 1.362 μs in the range of 0–100 mol% B3+, respectively. Based on the phonon energy of RE ions for the same host, a relatively longer PL lifetime is attributed to a more symmetrical site as the f–f transition becomes more forbidden,46 where the decrease in asymmetry ratio or increase in local environmental symmetry of Eu3+ ions supports the decay results. In Table 3, the long lifetime (τ1) and short lifetime (τ2) with increased B3+ changed from 1.109 and 0.436 μs to 1.445 and 0.654 μs, respectively. The long lifetime (τ1) is associated with RE3+ ions on the inside of the particle/isolated centers, and the short lifetime (τ2) is related to RE3+ ions close to the surface and/or on the surface of the particle.45,47 Besides, the long lifetime and the short lifetime are associated with high symmetry and low symmetry of Eu3+ ions, respectively.46 The variation of the long (τ1 × I1) components and short (τ2 × I2) components depending on B3+ concentration is displayed in Fig. 8. The increase in the long and short components shows that the presence of boron increases the activation of Eu3+ luminescence centers in both particle core/isolated centers and on the particle surface. However, the increase in τ1 × I1 trend is higher than the τ2 × I2, indicating that the activation of Eu3+ centers within the particle is increased more than Eu3+ luminescence centers at or near the particle surface. Moreover, the increase in the τ1 × I1 trend supports the more symmetrical or magnetic dipole character of Eu3+ sites and the occupation of Eu3+ ions in B-centrosymmetric sites.
Table 3 Long (τ1) and short (τ2) lifetimes, long (l1) and short (l2) luminescence intensities, average (observed) lifetimes (τ) and chi-square (x2) values for BaTa2O6:xEu3+, yB3+ (x = 10 mol%, y = 0, 5, 15, 30, 50, 70, and 100 mol%) phosphors
| B3+ conc. (mol%) |
τ1 (ms) |
l1 |
τ2 (ms) |
l2 |
τ (ms) |
x2 |
| 0 |
1.109 |
2008 |
0.436 |
1801 |
0.934 |
1.123 |
| 5 |
1.049 |
5415 |
0.537 |
3837 |
0.913 |
1.104 |
| 15 |
1.227 |
5041 |
0.537 |
5828 |
0.995 |
1.232 |
| 30 |
1.250 |
8459 |
0.487 |
8344 |
1.038 |
1.249 |
| 50 |
1.366 |
10![[thin space (1/6-em)]](https://www.rsc.org/images/entities/char_2009.gif) 280 280 |
0.439 |
7051 |
1.199 |
1.269 |
| 70 |
1.433 |
12![[thin space (1/6-em)]](https://www.rsc.org/images/entities/char_2009.gif) 365 365 |
0.617 |
3821 |
1.337 |
1.073 |
| 100 |
1.445 |
15![[thin space (1/6-em)]](https://www.rsc.org/images/entities/char_2009.gif) 783 783 |
0.654 |
4055 |
1.362 |
0.981 |
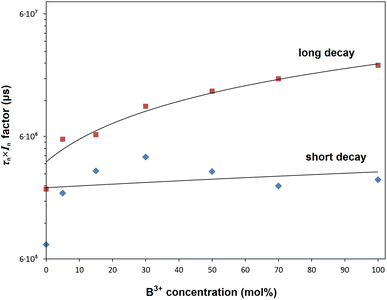 |
| | Fig. 8 Variation of product curves for the long (τ1 × I1) and short (τ2 × I2) components depending on the boron concentration. | |
The quantum efficiency (ηQE) of the phosphors can be found from the ratio of the average (observed) lifetime (τ) to the radiative lifetime (τr) by eqn (9):
| |
 | (9) |
where the radiative and nonradiative transitions of
5D
0 level are
Ar and
Anr, respectively. The radiative lifetimes (
τr) and quantum efficiencies (
ηQE) are tabulated in
Table 4. The values of the
ηQE% from 0 to 100 mol% B
3+ varied to 51.95% and 33.14%, respectively, which corresponds to a decrease of approximately 36%, which may be attributed to the multiphonon relaxation process associated with the improving magnetic dipole character. Moreover, the energy transfer possibility between Eu
3+–Eu
3+ ions can be predicted by
eqn (10):
41| |
 | (10) |
where
τ0 is the observed lifetime for low concentration.
Table 4 summarizes the energy transfer probabilities decreased by approximately 46%, in which the increase in B
3+ concentration caused the local environment of Eu
3+ to become more symmetrical and the energy transfer process to become more inhibiting.
Table 4 Radiative lifetimes (τr), observed lifetimes (τ), quantum efficiencies (ηQE) and energy transfer possibilities (ηEu→Eu) of BaTa2O6:xEu3+, yB3+ (x = 10 mol%, y = 0, 5, 15, 30, 50, 70, and 100 mol%) phosphors
| B3+ conc. (mol%) |
τr (ms) |
τ (ms) |
ηQE (%) |
ηEu→Eu (%) |
| 0 |
1.797 |
0.934 |
51.95 |
0.00 |
| 5 |
2.055 |
0.913 |
44.43 |
2.23 |
| 15 |
2.795 |
0.995 |
35.61 |
−6.60 |
| 30 |
3.402 |
1.038 |
30.51 |
−11.17 |
| 50 |
4.019 |
1.199 |
29.83 |
−28.43 |
| 70 |
4.068 |
1.337 |
32.86 |
−43.19 |
| 100 |
4.111 |
1.362 |
33.14 |
−45.92 |
Fig. 9 displays the chromaticity coordinates of BaTa2O6:xEu3+, yB3+ phosphors in the CIE diagram, illustrating how they vary depending on the concentration of Eu3+. CIE coordinates (x, y) of the phosphors from 0 to 100 mol% B3+ changed to (0.6616, 0.3382) and (0.6339, 0.3657), respectively. The phosphor's emission shows a progression from red to orange as B3+ concentration increases. Thus, by augmenting the B3+ concentration in the CIE diagram, the emission of Eu3+ can be adjusted from the red region to the orange region. The UV lamp photographs of the phosphors under 365 nm are given in Fig. 9, in the inset figure. The UV lamp photo of the undoped boron sample has a red appearance, showing a transition towards an orange appearance with increasing B3+ concentration.
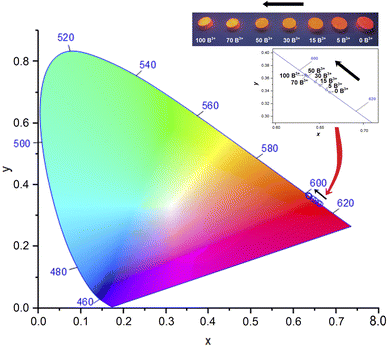 |
| | Fig. 9 CIE coordinates (x, y) and UV lamp photos at 365 nm of BaTa2O6:xEu3+, yB3+ phosphors. | |
4. Conclusion
In the study, the effect of the grain size and grain shape on the spectral properties was investigated by using BaTa2O6:xEu3+, yB3+ (x = 10 mol%, y = 0, 5, 15, 30, 50, 70, 100 mol%) co-doped phosphor ceramics. XRD results showed a single-phase structure up to 100 mol%, while the increase in B3+ concentration led to an improvement in crystallinity and an increase in reflections (001) and (002) associated with elongation in the z-direction. SEM examinations revealed the elongation and growth in grains with increasing B3+ concentration. The increase in PL emission was associated with improved crystallinity and grain growth or decreasing SA/vol ratio, while the increased magnetic dipole character of phosphor was attributed to centrosymmetric B-site occupation and grain elongation. The decrease in the Ω2 and Ω4 parameters indicated the high local symmetry of the Eu3+ sites and increased charge transfer in the host, respectively. The increased B3+ presence led to an increase in the observed lifetime, which is attributed to a more symmetrical site as the f–f transition becomes more forbidden. The increase in the long and short components showed the activation of Eu3+ centers within the grains and at/near the grain surfaces increased, in addition, the relatively high increase in long components supported the increased site symmetry and magnetic dipole character of Eu3+ ions. The decrease in quantum efficiency and energy transfer efficiency was 36% and 46% from 0 to 100 mol% B3+, respectively. The decrease in quantum efficiency and energy transfer efficiency was associated with the increased multiphonon relaxation process resulting from the magnetic dipole transition. The variation of luminescence properties concerning grain morphology also demonstrates that they can be adjusted by controlling the reaction conditions.
Conflicts of interest
There are no conflicts to declare.
References
- X. Liu, L. Li, H. M. Noh, J. H. Jeong, K. Jang and D. S. Shin, Controllable synthesis of uniform CaMoO4:Eu3+, M+ (M = Li, Na, K) microspheres and optimum luminescence properties, RSC Adv., 2015, 5, 9441 RSC.
- G. Jyothi, L. S. Kumaria and K. G. Gopchandran, Site selective substitution and its influence on photoluminescence properties of Sr0.8Li0.2Ti0.8Nb0.2O3:Eu3+ phosphors, RSC Adv., 2017, 7, 28438 RSC.
- Y. Hua, T. Wang, J. S. Yu, W. Ran and L. Li, Modulating A site compositions of europium(III)-doped double-perovskite niobate phosphors, Inorg. Chem. Front., 2022, 9, 6211–6224 RSC.
- M. Chowdhury and S. K. Sharma, Spectroscopic behavior of Eu3+ in SnO2 for tunable red emission in solid state lighting devices, RSC Adv., 2015, 5, 51102 RSC.
- C. Y. Peng, B. Wang, L. F. Yuan, K. G. Hu, G. Chen, H. Y. Wu, Y. H. Hu and Y. H. Jin, Six- and five-coordinated Cr3+ in Ga2GeO5 invokes tunable broadband near-infrared emission toward night-vision applications, Rare Met., 2023, 42, 3787–3796 CrossRef CAS.
- C. Peng, L. Yuan, G. Chen, H. Wu and Y. Jin, Thermally stable broadband near-infrared emitting pyrochlore oxide phosphors codoped with Cr3+ and Yb3+ ions, Ceram. Int., 2024, 50, 7059–7066 CrossRef.
- M. İlhan, M. K. Ekmekçi and İ. Ç. Keskin, Judd–Ofelt parameters and X-ray irradiation results of MNb2O6:Eu3+ (M = Sr, Cd, Ni) phosphors synthesized via a molten salt method, RSC Adv., 2021, 11, 10451–10462 RSC.
- M. İlhan and İ. Ç. Keskin, Analysis of Judd–Ofelt parameters and radioluminescence results of SrNb2O6:Dy3+ phosphors synthesized via molten salt method, Phys. Chem. Chem. Phys., 2020, 22, 19769 RSC.
- Y. Kim and S. Kang, Effect of particle size on photoluminescence emission intensity in ZnO, Acta Mater., 2011, 59, 3024–3031 CrossRef CAS.
- J. Shan, M. Uddi, R. Wei, N. Yao and Y. Ju, The hidden effects of particle shape and criteria for evaluating the upconversion luminescence of the lanthanide doped nanophosphors, J. Phys. Chem. C, 2010, 114, 2452–2461 CrossRef CAS.
- J. Y. Park, H. C. Jung, G. S. R. Raju, B. K. Moon, J. H. Jeong, S. M. Son and J. H. Kim, Sintering temperature effect on structural and luminescence properties of 10 mol% Y substituted Gd3Al5O12:Ce phosphors, Opt. Mater., 2009, 32, 293–296 CrossRef CAS.
- G. S. R. Raju and S. Buddhudu, Emission analysis of Tb3+:MgLaLiSi2O7 powder phosphor, Mater. Lett., 2008, 62, 1259–1262 CrossRef CAS.
- G. Wakefield, E. Holland, P. J. Dobson and J. L. Hutchison, Luminescence properties of nanocrystalline Y2O3:Eu, Adv. Mater., 2001, 13, 1557 CrossRef CAS.
- K. Y. Jung, C. H. Lee and Y. C. Kang, Effect of surface area and crystallite size on luminescent intensity of Y2O3:Eu phosphor prepared by spray pyrolysis, Mater. Lett., 2005, 59, 2451–2456 CrossRef CAS.
- M. İlhan, M. K. Ekmekçi, A. Mergen and C. Yaman, Photoluminescence characterization and heat treatment effect on luminescence behavior of BaTa2O6:Dy3+ phosphor, Int. J. Appl. Ceram. Technol., 2017, 14, 1134–1143 CrossRef.
- B. Demir, D. Derince, T. Dayioglu, L. Koroglu, E. Karacaoglu, V. Uz and E. Ayas, Effects of doping content and crystallite size on luminescence properties of Eu3+ doped fluorapatites obtained from natural waste, Ceram. Int., 2021, 47, 34657–34666 CrossRef CAS.
- W. N. Wang, W. Widiyastuti, T. Ogi, I. W. Lenggoro and K. Okuyama, Correlations between crystallite/particle size and photoluminescence properties of submicrometer phosphors, Chem. Mater., 2007, 19, 1723–1730 CrossRef CAS.
- M. İlhan and L. F. Güleryüz, Boron doping effect on the structural, spectral properties and charge transfer mechanism of orthorhombic tungsten bronze β-SrTa2O6:Eu3+ phosphor, RSC Adv., 2023, 13, 12375 RSC.
- M. İlhan, M. K. Ekmekçi and L. F. Güleryüz, Effect of boron incorporation on the structural, morphological, and spectral properties of CdNb2O6:Dy3+ phosphor synthesized by molten salt process, Mater. Sci. Eng., B, 2023, 298, 116858 CrossRef.
- Y. Huang, Q. Feng, Y. Yang and H. J. Seo, A study of luminescence properties in the boron-doped lead tungstate, Phys. Lett. A, 2005, 336, 490–497 CrossRef CAS.
- H. He, Y. Wang and Y. Zou, Room temperature photoluminescence property of boron-doped sol–gel silica, Mater. Res. Bull., 2004, 39, 747–753 CrossRef CAS.
- Y. C. Kang, H. S. Roh and S. B. Park, Improvement of brightness of Gd2O3:Eu phosphor particles using boric acid flux in the spray pyrolysis, Jpn. J. Appl. Phys., 2000, 39, L31–L33 CrossRef CAS.
- K. S. Lau, Z. Hassan, W. F. Lim and H. J. Quah, Synthesis and luminescence enhancement of red-emitting Ca3Y(AlO)3(BO3)4:Eu3+ phosphors via La3+ Co-doping prepared by microwave solution combustion synthesis, Mater. Chem. Phys., 2022, 292, 126649 CrossRef CAS.
- M. Szkoda, A. L. Oleksiak and K. Siuzdak, Optimization of boron-doping process of titania nanotubes via electrochemical method toward enhanced photoactivity, J. Solid State Electrochem., 2016, 20, 1765–1774 CrossRef CAS.
- A. Nakamura, N. Nambu and H. Saitoh, Effect of boron concentration in Y2O3:(Eu,B) phosphor on luminescence property, Sci. Technol. Adv. Mater., 2005, 6, 210–214 CrossRef CAS.
- D. Chen, D. Yang, Q. Wang and Z. Jiang, Effects of boron doping on photocatalytic activity and microstructure of titanium dioxide nanoparticles, Ind. Eng. Chem. Res., 2006, 45, 4110–4116 CrossRef CAS.
- K. Dhanalakshmi and A. J. Reddy, Effect of flux boric acid (H3BO3) on yttrium silicate Y2SiO5:Dy3+ (9 mol%) nanophosphors its characterization and luminescence studies, Sens. Lett., 2019, 17, 898–904 CrossRef.
- A. Dulda, D. S. Jo, W. J. Park, T. Masaki and D. H. Yoon, Photoluminescence and morphology of flux grown BAM phosphor using a novel synthesis method, J. Ceram. Process. Res., 2009, 10, 811–816 Search PubMed.
- M. İlhan, M. İ. Katı, İ. Ç. Keskin and L. F. Güleryüz, Evaluation of structural and spectroscopic results of tetragonal tungsten bronze MTa2O6: Eu3+ (M = Sr, Ba, Pb) phosphors and comparison on the basis of Judd–Ofelt parameters, J. Alloys Compd., 2022, 901, 163626 CrossRef.
- İ. Ç. Keskin and M. İlhan, Thermoluminescence kinetic parameters and radioluminescence of RE3+ (RE = Pr, Sm, Tb, Ho, Er)-doped barium tantalate phosphors, J. Electron. Mater., 2023, 52, 5614–5630 CrossRef.
- M. İlhan, A. Mergen and C. Yaman, Removal of iron from BaTa2O6 ceramic powder produced by high energy milling, Ceram. Int., 2013, 39, 5741–5750 CrossRef.
- M. İlhan, A. Mergen and C. Yaman, Mechanochemical synthesis and characterisation of BaTa2O6 ceramic powders, Ceram. Int., 2011, 37, 1507–1514 CrossRef.
- G. Li, L. Cheng, F. Liao, S. Tian, X. Jing and J. Lin, Luminescent and structural properties of the series Ba6-xEuxTi2+xTa8-xO30 and Ba4-yKyEu2Ti4-yTa6+yO30, J. Solid State Chem., 2004, 177, 875–882 CrossRef CAS.
- J. Hou, P. Chen, G. Zhang, Y. Fang, W. Jiang, F. Huang and Z. Ma, Synthesis, structure and photoluminescence properties of tetragonal tungsten bronze-type Eu3+-doped K2LaNb5O15 niobate phosphor, J. Lumin., 2014, 146, 97–101 CrossRef CAS.
- F. T. Rabouw, P. T. Prins and D. J. Norris, Europium-doped NaYF4 nanocrystals as probes for the electric and magnetic local density of optical states throughout the visible spectral range, Nano Lett., 2016, 16, 7254–7260 CrossRef CAS PubMed.
- H. X. Mai, Y. W. Zhang, L. D. Sun and C. H. Yan, Highly efficient multicolor up-conversion emissions and their mechanisms of monodisperse NaYF4:Yb,Er core and core/shell-structured nanocrystals, J. Phys. Chem. C, 2007, 111, 13721–13729 CrossRef CAS.
- G. K. Liu, H. Z. Zhuang and X. Y. Chen, Restricted phonon relaxation and anomalous thermalization of rare earth ions in nanocrystals, Nano Lett., 2002, 2, 535–539 CrossRef CAS.
- X. Y. Chen, H. Z. Zhuang, G. K. Liu, S. Li and R. S. Niedbala, Confinement on energy transfer between luminescent centers in nanocrystals, J. Appl. Phys., 2003, 94, 5559–5565 CrossRef CAS.
- B. R. Judd, Optical absorption intensities of rare-earth ions, Phys. Rev., 1962, 127, 750 CrossRef CAS.
- G. S. Ofelt, Intensities of crystal spectra of rare-earth ions, J. Chem. Phys., 1962, 37, 511 CrossRef CAS.
- M. İlhan, İ. Ç. Keskin, L. F. Güleryüz and M. İ. Katı, A comparison of spectroscopic properties of Dy3+-doped tetragonal tungsten bronze MTa2O6 (M = Sr, Ba, Pb) phosphors based on Judd–Ofelt parameters, J. Mater. Sci.: Mater. Electron., 2022, 33, 16606–16620 CrossRef.
- R. Saraf, C. Shivakumara, S. Behera, H. Nagabhushana and N. Dhananjaya, Photoluminescence, photocatalysis and Judd– Ofelt analysis of Eu3+-activated layered BiOCl phosphors, RSC Adv., 2015, 5, 4109 RSC.
- N. Yaiphaba, R. S. Ningthoujam, N. S. Singh, R. K. Vatsa, N. R. Singh, S. Dhara, N. L. Misra and R. Tewari, Luminescence, lifetime, and quantum yield studies of redispersible Eu3+-doped GdPO4 crystalline nanoneedles: Core-shell and concentration effects, J. Appl. Phys., 2010, 107, 034301 CrossRef.
- N. S. Singh, R. S. Ningthoujam, N. Yaiphaba, S. D. Singh and R. K. Vatsa, Luminescence, lifetime and quantum yield studies of YVO4:Ln3+ (Ln3+ = Dy3+, Eu3+) nanoparticles: Concentration and annealing effects, Chem. Phys. Lett., 2009, 480, 237–242 CrossRef CAS.
- A. K. Parchur and R. S. Ningthoujam, Behaviour of electric and magnetic dipole transitions of Eu3+, 5D0 → 7F0 and Eu–O charge transfer band in Li+ co-doped YPO4:Eu3+, RSC Adv., 2012, 2, 10859–10868 RSC.
- S. K. Gupta, J. P. Zuniga, M. Abdou, P. S. Ghoshc and Y. Mao, Optical properties of undoped, Eu3+ doped and Li+ co-doped Y2Hf2O7 nanoparticles and polymer nanocomposite films, Inorg. Chem. Front., 2020, 7, 505 RSC.
- V. Sudarsan, F. C. J. M. van Veggel, R. A. Herring and M. Raudsepp, Surface Eu3+ ions are different than ‘‘bulk’’ Eu3+ ions in crystalline doped LaF3 nanoparticles, J. Mater. Chem., 2005, 15, 1332 RSC.
|
| This journal is © The Royal Society of Chemistry 2024 |
Click here to see how this site uses Cookies. View our privacy policy here.  Open Access Article
 *a,
Lütfiye Feray Güleryüz
 b and
Mehmet İsmail Katıc


 and
and  are the local field corrections for the ED and MD transitions which can be found by eqn (4) and (5) respectively:


![[thin space (1/6-em)]](https://www.rsc.org/images/entities/char_2009.gif) 280
280![[thin space (1/6-em)]](https://www.rsc.org/images/entities/char_2009.gif) 365
365![[thin space (1/6-em)]](https://www.rsc.org/images/entities/char_2009.gif) 783
783


