
 Open Access Article
 This Open Access Article is licensed under a Creative Commons Attribution-Non Commercial 3.0 Unported Licence
Quantification of crystallinity during indomethacin crystalline transformation from α- to γ-polymorphic forms and of the thermodynamic contribution to dissolution in aqueous buffer and solutions of solubilizer†
Kanji Hasegawa,
Satoru Goto *,
Hikaru Kataoka,
Hitoshi Chatani,
Takatoshi Kinoshita,
Hideshi Yokoyama and
Tomohiro Tsuchida
*,
Hikaru Kataoka,
Hitoshi Chatani,
Takatoshi Kinoshita,
Hideshi Yokoyama and
Tomohiro Tsuchida
Faculty of Pharmaceutical Sciences, Tokyo University of Science, 2641 Yamazaki, Noda, Chiba 278-8510, Japan. E-mail: s.510@rs.tus.ac.jp
First published on 30th January 2024
Abstract
The thermodynamic properties and dissolution of indomethacin (INM) were analyzed as models for poorly water-soluble drugs. Physical mixtures of the most stable γ-form and metastable α-form of INM at various proportions were prepared, and their individual signal intensities proportional to their mole fractions were observed using X-ray powder diffraction and Fourier transform infrared spectrometry at standard temperature. The endothermic signals of the α-form, with a melting point of 426 K, and that of the γ-form, with a melting point of 433 K, were obtained by differential scanning calorimetry (DSC). Furthermore, an exothermic DSC peak of the α/γ-phase transition at approximately 428 K was obtained. As we computed the melting entropy of the α-form and that of its transformation, the frequency of the transition was quantitatively determined, which indicated the maximum of the α/γ-phase transition at an α-form proportion of 68%. Subsequently, the thermodynamic contributions of the α- and γ-forms were analyzed using a Van't Hoff plot for solubility in aqueous solutions at pH 6.8. The dissolution enthalpies for α- and γ-forms were 28.2 and 31.2 kJ mol−1, respectively, which are in agreement with the quantitative contribution predicted by the product of the temperature and melting entropy. The contribution of melting entropy was conserved in different dissolution processes with aqueous solvents containing lidocaine, diltiazem, L-carnosine, and aspartame as solubilizers; their γ-form Setschenow coefficients were −39.6, +82.9, −17.3, and +23.2, whereas those of the α-form were −39.7, +80.4, −16.7, and +22.7, respectively. We conclude that the dissolution ability of the solid state and solubilizers indicate their additivity independently.
1. Introduction
The solid states of active pharmaceutical ingredients (APIs) in medicinal formulations comprise the most stable crystals, metastable polymorphs,1 nanocrystals,2 co-crystal complexes,3,4 amorphous5 and co-amorphous mixtures,6 eutectic mixtures,7,8 solid solutions,8 and solid dispersions.5,9,10 These states are chosen to regulate API solubility in water for controlled release. Additionally, the salt formation of an API affects the stability and dissolution performance of the solid dispersion.10 In addition to the previous ingenuities of solid states, measures such as hydrotropes,11–13 nanoparticulation,2 chemical modifications,14 cyclodextrin inclusion complexes,15 and pH adjustment16 can be used to manipulate solubility.17,18 Approximately 40% of market-approved medicines and 90% of molecules in the discovery pipeline have low aqueous solubility, while only 8% of new drug candidates exhibit high aqueous solubility and intestinal permeability.19,20 Given that physical properties such as dissolution rate, solubility, compressibility, and temporal stability depend on the solubility and permeability of an API, it is essential to devise appropriate drug-development strategies.17,18 According to Sun's Materials Science Tetrahedron (MST),21 we focus on the reasonable improvement based on correlation between the structure and properties of crystals and solutions. Any unexpected modification of solubility and dissolution kinetics might occasionally involve risks of overdose or loss of therapeutic efficacy.22–24 To overcome these shortcomings, the goal of our series of studies22–31 is to establish a rational indexation of physicochemical properties to strike a balance between the solubility of solid-state APIs and the solubility required for controlled release. This study aims to enhance APIs' bioavailability, expecting to improve solubility by taking advantage of thermodynamic rationality.In previous studies,22–28 indomethacin (INM) (see Scheme 1 for its chemical structure) was used as a poorly water-soluble API model to analyze its thermodynamic and dissolution properties. With regard to INM, its most stable γ-form (Form I, Tm = 433 K) and a metastable α-form (Form II, Tm = 426 K) are frequently studied in terms of the mechanisms of polymorph formation for the selective recovery of specific polymorphs,32–37 and several other polymorphs and solvates are reported.38,39 Kneading of INM with equimolar lidocaine (LDC, Tm = 341 K) easily provides a eutectic mixture with an observed Tm of 314 K.25 We confirmed that LDC-analogous local anesthetics, procaine (PRC, Tm = 334 K), tetracaine (TTC, Tm = 316 K), and dibucaine (DBC, Tm = 338 K) can also form eutectic mixtures, with melting points at 313, 303, and 325 K, respectively.26 Aqueous solubility of the eutectic mixture of the acidic INM with these basic drugs was dependent on their water–octanol partition coefficient (log![[thin space (1/6-em)]](https://www.rsc.org/images/entities/char_2009.gif) P); the hydrophilic LDC and PRC increase the observed solubility of INM, whereas the hydrophobic TTC and DBC decrease it. The solubility of INM and other nonsteroidal anti-inflammatory drugs (NSAIDs) was determined in the presence of pre-dissolved diltiazem (DTZ) or LDC. As a result, the balance between the dissolution enthalpy and dissolution entropy of acidic drugs is maintained in the presence and absence of basic drugs DTZ and LDC, supporting the establishment of enthalpy–entropy compensation.27 We have reported various basic drugs, such as LDC, other local anesthetics,25,27 DTZ,25,26 cimetidine, famotidine, arginine, antipyrine, and imidazole,24 that increase or decrease INM solubility. L-Carnosine (CNS) is a dipeptide consisting of β-alanyl and histidine moieties that maintain structural commonality with imidazole, antipyrine, cimetidine, and famotidine24 which have five-membered heterocycles. Aspartame (APM) is a dipeptide with a similar molecular size, and its phenylalanine moiety is characterized by a non-heteroaromatic ring.
P); the hydrophilic LDC and PRC increase the observed solubility of INM, whereas the hydrophobic TTC and DBC decrease it. The solubility of INM and other nonsteroidal anti-inflammatory drugs (NSAIDs) was determined in the presence of pre-dissolved diltiazem (DTZ) or LDC. As a result, the balance between the dissolution enthalpy and dissolution entropy of acidic drugs is maintained in the presence and absence of basic drugs DTZ and LDC, supporting the establishment of enthalpy–entropy compensation.27 We have reported various basic drugs, such as LDC, other local anesthetics,25,27 DTZ,25,26 cimetidine, famotidine, arginine, antipyrine, and imidazole,24 that increase or decrease INM solubility. L-Carnosine (CNS) is a dipeptide consisting of β-alanyl and histidine moieties that maintain structural commonality with imidazole, antipyrine, cimetidine, and famotidine24 which have five-membered heterocycles. Aspartame (APM) is a dipeptide with a similar molecular size, and its phenylalanine moiety is characterized by a non-heteroaromatic ring.
 | ||
| Scheme 1 Structural formula of the drug used in the experiment. | ||
In the stable solid state, the population of a contained polymorph is evaluated based on the degree of crystallinity, which broadly refers to the degree of structural order in a solid. Generally, a literature reference is used for the melting heat of a 100% crystalline material, and the actual measured melting heat is divided by this reference value.40,41 For pharmaceutical ingredients, the mass ratio of the contained polymorphs is of low interest, without a view of continuity, such as periodicity, hardness, density, transparency, and diffusion. Fundamentally, crystallinity can be measured using X-Ray Powder Diffraction (XRPD) at normal temperature or under cryogenic conditions, and calorimetric techniques are used for the higher temperature range.40–42 The relative index is also obtained via densitometry,41 infrared spectrometry,43 and solid-state nuclear magnetic resonance experiments.44 With the use of differential scanning calorimetry (DSC), the degree of crystallinity is converted from the melting enthalpy, which is derived from the area enclosed by the endothermic curve and by baseline extension.45,46 Supposing that each molecule in a mixture of multiple molecules exhibits only a single polymorph, the intensity of each DSC signal would be proportional to the mass amount of the polymorph as the cause of the associated thermograph signal. These procedures are appropriate for their intended purposes. Alternatively, there are circumstances where a single molecule (or multiple molecules) may contain multiple polymorphs. The appearance of an exothermic phase transformation peak from a metastable polymorph to a more stable polymorph interrupts the endothermic peaks of the polymorphs. In addition, positive and negative enthalpy changes derived from endo- and exothermal signals should be assigned to the melting of polymorphs and transformation among forms. However, the income and expenditure of endo- and exothermal heat are quantitatively inconsistent because the melting and transformation processes progress at different temperatures. In principle, it is unacceptable to directly compare enthalpy changes at different temperatures.46
In the current study, both the endothermal heat for melting the α- and γ-forms and the exothermal heat for the α/γ-phase transition were measured in a prudent manner. The melting entropy (ΔfusS0) was assumed to be proportional to the mass of the individual polymorph, maintaining its regular structure regardless of the temperature. Since the melting process should occur at a constant melting point temperature, the experimentally observed increase in temperature is an artifact of the measurement using the DSC instrument. Corresponding to these hypotheses, we determined that the melting and transformation enthalpies could be obtained using the classical definition of ΔfusS0, which is equivalent to the net amount of heat divided by the constant Tm. We then obtained the dissolving enthalpy values of the α- and γ-forms, further confirming the difference in the contribution of the dissolution of their crystals at the standard temperature. Subsequently, we evaluated the magnitude fluctuations of the polymorphs under the influence of the solubilizers using Setschenow coefficients.
2. Experimental section
2.1. Materials
INM, LDC, CNS, and APM were purchased from Wako Pure Chemical Industries, Ltd (Osaka, Japan). DTZ hydrochloride was purchased from Tokyo Chemical Industry Co. (Tokyo, Japan). All reagents were of the highest commercially available grade (purity > 98%). While the commercially available polymorph of INM is a purified γ-form, the α-form was prepared as per the protocols described by Hamdi et al.47 After completely dissolving the purchased INM powder in ethanol, the solvent was gradually evaporated. The α-form crystals were collected and stored on silica gel at an ambient temperature. Before the analysis, the purity of the purchased or prepared polymorphs was confirmed using the XRPD diffractogram of published data. Furthermore, only a single trough sandwiched between the two peaks was observed in the second derivative of the DSC thermogram, indicating neither contaminants nor shoulders.2.2. Scanning electron microscopy of polymorphic crystals of INM
The powder samples were mounted on a sample holder stage using double-sided adhesive tape. After adhesion, the samples were imaged using a JSM-6060LA scanning electron microscope (SEM) (JEOL Co., Tokyo, Japan) at 20 kV without coating the crystal surface.2.3. XRPD diffractometry of polymorphic and mixed crystals of INM
XRPD pattern measurements were performed using a RINT 2000 X-Ray Diffractometer (Rigaku Co., Tokyo, Japan), with a Cu Kα radiation source and a Ni filter as the X-ray source, at a voltage of 40 kV and a current of 40 mA. The X-ray irradiation followed the parallel-beam method in the 2θ range from 5° to 40°, with a scanning velocity of 0.02 steps. The presented spectra are the average of five scans, and the scanning was conducted in triplicate or more replicates. The INM crystals were crushed in an agate mortar using a pestle, and the resulting powders were mixed. Mixtures of α- and γ-form crystals with various molar ratios were prepared using a metal needle, without applying any pressure. The samples were prepared immediately before use. To identify the polymorphs, the diffractograms of the INM single-crystal structures were compared with published diffractograms. The reproduced diffractogram was calculated from the 3D crystalline structure published in the Reflex Module of Powder Diffraction in BIOVIA Materials Studio 2020 (Dassault Systems). The 3D crystalline structures of the γ-form (reference code: INDMET) and α-form (reference code: INDMET04) were retrieved from the Cambridge Crystallographic Data Centre (CCDC).2.4. Attenuated total reflection-Fourier transform infrared (ATR-FTIR) spectrometry of polymorphic and mixed crystals of INM
ATR-FTIR spectra were recorded using an FTIR spectrometer (PerkinElmer Co., Waltham, MA, USA) equipped with a universal attenuated total reflectance accessory. The samples were measured over a wavelength range of 4000–400 cm−1. A force of 100 N was applied to the sample at standard temperature. The spectra were the average of 16 scans taken at 1 cm−1 resolution. Experiments were conducted at least in triplicates. The samples were prepared as described in the previous section.2.5. Thermal analyses of polymorphic and mixed crystals of INM
DSC was performed using a DSC8230 instrument (Rigaku Co.) with INM samples having a total mass of 5.0 mg (containing various ratios of the α- and γ-forms), which were placed in an aluminum pan and sealed. The temperature was changed from 303 to 453 K at a fixed rate (5.0 K min−1) under a nitrogen gas flow of 30 mL min−1. The Tm was adopted as the melting start temperature obtained from the intersection of the extension of the baseline and that of the point of maximum slope of the peak using Thermo Plus 2 software (Rigaku Co.).41,45 The experiments were conducted at least in triplicate.If the obtained thermogram had a simple endothermic peak, the area enclosed by the endothermic curve and baseline was converted to the total melting enthalpy (ΔfusH) for the mass of the content component through compensation with an instrumental coefficient.42,45 The total melting entropy (ΔfusS) for the mass of the component was simultaneously approximated by dividing the quotient of ΔfusH by Tm, according to the classical definition of Clausius.18,19
An endothermic trough and a subsequent exothermic peak were observed for the mixture of polymorphs, followed by an endothermic trough. These troughs at low and high temperatures corresponded to the melting heat of the α- and γ-polymorphs, respectively. The peak sandwiched between these troughs correlates with the phase transition from the α-form to the γ-form. In such thermograms, the area of the exothermal peak must be larger than the observed area because the preceding endothermal trough is redundant. Herein, the amount of the γ-form was the sum of the initially contained quantity and that added during the phase transition of the α-form. As the former quantity can be estimated from the part brought in, while the latter additions were calculated based on the difference in the areas of this part brought in from the observed endothermic trough. A comparison of the contribution of the phase transition of the α-form and the observed area of exothermal heat provided the proportion of the direct melt and the phase transition of the α-form. Because the melting temperature of the γ-form is different from the temperature of the phase transition from the α-form, the enthalpy changes, which are the heat amounts, were not suitable for calculation. Therefore, these calculations were performed using entropy changes, obtained by dividing the amount of heat by the temperature.
2.6. Thermodynamic parameters for dissolution of INM in aqueous solutions
An excess amount of INM powder (10 mg), crushed in an agate mortar with a pestle immediately before use, was added to screw-capped vials containing 5 mL of 25 mM KH2PO4/Na2HPO4 buffer (PB) at pH 6.8. The INM solutions were shaken at 278, 298, and 313 K for 0, 10, 20, 30, 60, and 120 min. Their samples were filtered using a 0.22 mm polytetrafluoroethylene membrane filter. The concentration of INM was determined using an SPD-20A high-performance liquid chromatography (HPLC) system (Shimadzu Co., Kyoto, Japan). The mobile phase mixture contained HPLC-grade methanol and PB at a volume ratio of 7:3, and the injection volume of each sample was 10 μL. Separation was conducted on an Inert Sustain Swift C18 column (5 μL, 150 × 4.6 mm; GL Sciences Inc., Tokyo, Japan) at a flow rate of 0.5 mL min−1 at 313 K, and the elution absorbance was measured at a wavelength of 320 nm. A series of INM solutions of known concentrations in equal volumes of acetonitrile and water were measured to obtain standard peak areas. The mobile phase and washing flow, which were of HPLC analytical grade, were passed through membrane filters. Each plot was analyzed at least in triplicate. The equilibrium concentrations of the α- and γ-forms of INM were estimated by calculating the saturated concentration of INM (CS) using the Noyes–Whitney equation,17,23,29 as shown in eqn (1):| C = CS − (CS − C0)exp(−kSt), | (1) |
 | (2) |
2.7. Dissolution of INM α and γ forms in aqueous solution of solubilizers
LDC, DTZ, CNS, and APM (final concentration of 10 mM) were prepared as solubilizer solutions in 25 mM PB (pH 6.8 (Scheme 1)). Pure PB was used as the control. An excess amount of INM powder (10 mg), crushed in an agate mortar with a pestle immediately before use, was added to screw-capped vials containing 5 mL of the solubilizer solutions described above. The solutions were shaken at 298 K and the solubility was analyzed at 0, 10, 20, 30, 60, and 120 min. The concentration was determined using HPLC, as described in section 2.6. The apparent solubility of the α- and γ-forms of INM was determined by calculating CS using the Noyes–Whitney equation. The Setschenow coefficients were determined using eqn (3):26,50
 | (3) |
2.8. Quantum chemical calculations
The crystal structures of the α- and γ-forms were extracted from the CCDC database using the reference codes INDMET04 and INDMET. To obtain the entropy of the fluctuations in the crystal structure, the crystal lattice energies of the polymorphs were calculated using the DMol3 program in BIOVIA Materials Studio 2020. The Perdew–Wang (PWC) local density approximation (LDA)51 exchange–correlation density functional method was applied. Two types of numerical basis sets, the double numerical plus d-function (DND), that is, 6-31G (d), double numerical plus polarization (DNP), that is, 6-31G (d,p), and double numerical plus polarization with addition of diffuse functions (DNP+), that is, 6-31+G (d,p), were used to verify the effects of the basis sets.2.9. NMR
The precipitate after shaking α-form of INM in 25 mM KH2PO4/Na2HPO4 buffer (pH 6.8) of 1H-NMR measurements were dissolved in DMSO-d6. The NMR spectra of the neat drugs and their mixtures at 298 K were recorded on a 400 MHz spectrometer (JNMECZ400, JEOL Ltd, Tokyo, Japan). Spectral analyses were performed using Delta NMR processing software version 5.2.0 (JEOL USA, Inc., Peabody, MA, U.S.A.).3. Results and discussion
3.1. Identification of INM polymorphs
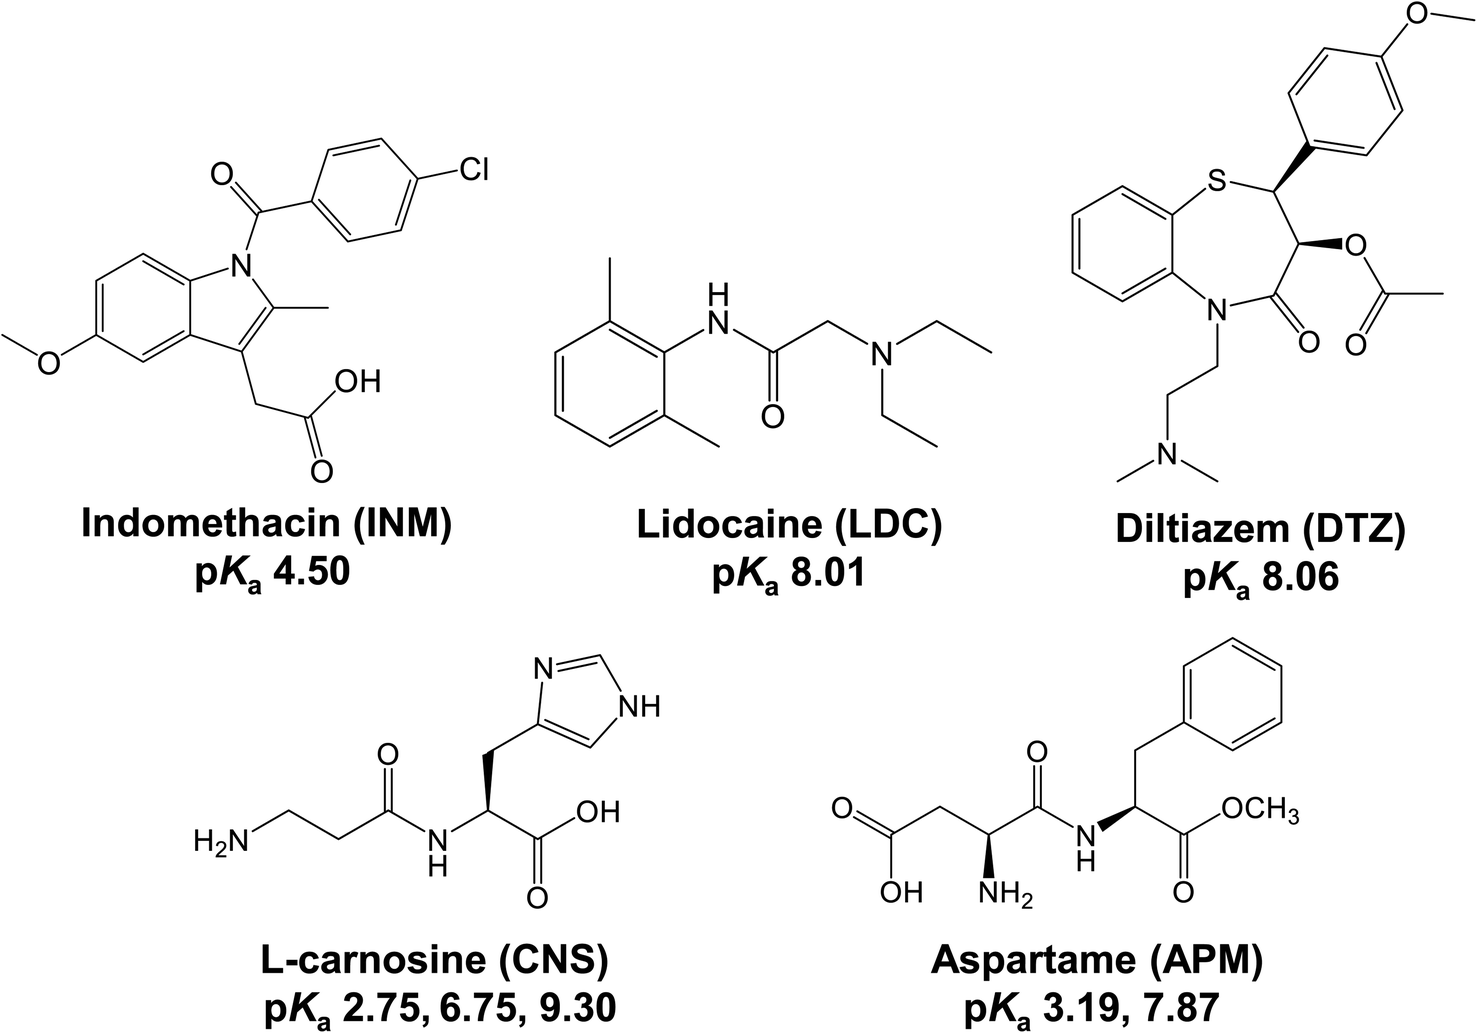
The metastable α-form of INM was prepared and identified using SEM, DSC, ATR-FTIR, and XRPD analyses. Fig. 1 shows an SEM image of INM. The neat γ-form was granular (maximum or minimum size approximated by projected area diameter: 44.38 and 5.92 μm, respectively), and the prepared α-form was needle-shaped (maximum or minimum size of length × width: 88.75 × 1.18 and 11.24 × 0.59 μm, respectively). The observed morphology was significantly congruous with images of the γ- and α-forms reported by Štukelj et al.52 DSC thermal analyses and FTIR spectrometry data of the samples are summarized in Table S1.† The melting points of the α- and γ-forms determined by DSC were 426 and 433 K, respectively. There was a large difference between the polymorphs in the ATR-FTIR spectra, especially in the 1800–1600 cm−1 range, corresponding to the differential C![[double bond, length as m-dash]](https://www.rsc.org/images/entities/char_e001.gif) O stretching vibration depending on the hydrogen bonds in the crystal.27,53,54 Both the thermograms and spectra of the samples were in good agreement with previously reported data on the α- and γ-forms, indicating that two pure polymorphic forms of INM were obtained. The measured and published XRPD diffractograms of the α- and γ-forms are confirmed as described in Materials and Methods in Fig. S1† [reference codes: INDMET, INDMET04, and CCDC].
O stretching vibration depending on the hydrogen bonds in the crystal.27,53,54 Both the thermograms and spectra of the samples were in good agreement with previously reported data on the α- and γ-forms, indicating that two pure polymorphic forms of INM were obtained. The measured and published XRPD diffractograms of the α- and γ-forms are confirmed as described in Materials and Methods in Fig. S1† [reference codes: INDMET, INDMET04, and CCDC].
 | ||
| Fig. 1 SEM images of INM; α-form (left) and γ-form (right). | ||
3.2. Interaction between INM α- and γ-form mixtures at standard temperature
Prior to verifying the thermodynamic transition from α- to γ-forms of INM, we needed to ensure that the spontaneous transformation of these polymorphs never progresses at ambient temperature because of physical or chemical interactions or reactions. For this purpose, mixtures of the α- and γ-forms in various proportions were investigated using XRPD diffractometry and ATR-FTIR spectrometry.The XRPD diffractograms for the pure crystals and mixtures of α- and γ-forms in various mole fractions were measured at 298 K, as shown in Fig. 2a. Signals at 2θ angles of 6.92° (hkl = 020), 8.46° (021), and 14.54° (003) were observed in the diffractogram of the pure α-form (proportion of 1:0). The higher the proportion of the γ-form in the mixture, the greater the decrease in the signals inherent to the α-form in the diffractograms. Signals at 11.64° (101), 12.76° (110), 16.74° (021), and 21.88° (022) were observed for the pure γ-form (0:1). The intensities of these signals gradually decreased as the γ-form content decreased. As depicted in Fig. 2b, the reflection intensities of the signals at 8.46° and 12.76°, which are unique to the α- and γ-forms, respectively, are significantly proportional to the mole fractions of the α- and γ-forms.
 | ||
| Fig. 2 (a) XRPD diffractograms of INM at various mole fractions of α- and γ-forms. (b) Intensity of XRPD diffractograms at 2θ = 8.46° (circles) and 2θ = 12.76° (squares) (n = 3). (c) IR spectra of INM at various mole fractions of α- and γ-forms (n = 3). (d) Absorbance of IR spectra at 1649 cm−1 (open triangles), 1680 cm−1 (closed triangles), 1713 cm−1 (closed squares), and 1734 cm−1 (closed circles) (n = 3). | ||
Subsequently, we examined the ATR-FTIR spectra of the mixtures in the same mole fractions at 298 K and extracted peaks in the wavenumber range of 1800–1660 cm−1 (Fig. 2c). Isolated peaks for the pure α-form sample (1:0) were observed at wavenumbers of 1,734, 1,689, 1,680, and 1649 cm−1. The peaks at 1734 and 1689 cm−1 were assigned to the O–CO bending vibrations of carboxylic acid. The peaks at 1649 and 1680 cm−1 corresponded to the CO stretching vibrations of the benzoyl group.53,54 Isolated peaks for the pure γ form sample (0:1) were at 1713 and 1690 cm−1, which were assigned to the CO stretching vibration of the benzoyl group and the O–CO bending vibration, respectively.53,54 In Fig. 2d, these peaks are plotted as the graph of the absorbance to the mole fraction of the α-form, except for those at 1689 or 1690 cm−1, with a slight fluctuation. The linear correlations in these plots were dependent on the mole fractions of the α- and γ-forms. At standard temperatures, no crystallographic transitions in the mixtures were observed in the XRPD experiments. Moreover, no intra- or inter-molecular interactions were detected in the mixtures following ATR-FTIR spectrometry. Generally, the mixing process induces neither physical nor chemical changes during the experimental period.
3.3. Phase transition of the INM α- and γ-form mixtures at melting temperature
Although INM is poorly aqueous soluble, its α-form is slightly more water-soluble than the γ-form. However, this metastable α-form maintains poor stability. To verify the thermodynamic stability of the polymorphic forms, we quantitatively examined the thermal stability of the mixtures using DSC. To determine the experimentally appropriate heating rate, INM melting was measured at various heating rates, as shown in Fig. S2.† The thermograms for the α-form constituted peaks observed at the melting temperatures of 425 and 432 K at heating rates of 1.0 and 3.0 K min−1, respectively. In contrast, peaks were obtained at a melting temperature of 425 K and heating rates of 5.0 and 10.0 K min−1. Hamdi et al.47 and Štukelj et al.52 reported melting temperatures of approximately 426 and 432 K, corresponding to α- and γ-forms, respectively. If the α-form was annealed at 423 K for 20 min, a transition to the γ-form occurred, as reported by Qi and Craig.55 Therefore, we considered that the rate of crystalline nucleation was accelerated, and the α/γ-phase transition reduced the apparent melting temperature as the temperature rise rate was extremely slow, such as 1.0 and 3.0 K min−1. In addition, when α- and γ-forms were mixed, the melting point of the γ-form was 433 K at 10.0 K min−1. The final melting temperature of the α-form at 10 K min−1 was 434 K, which exceeded the melting start temperature of the γ-form, making it difficult to separate the endothermic peaks of the α- and γ-forms.Therefore, the recommended heating rate is 5.0 K min−1. The melting point and entropy of the fusion of γ-form were 62.7 J K−1 mol−1 at 433.4 K, whereas those of the α-form were 54.6 J K−1 mol−1 at 425.8 K. Successively, the DSC thermograms of the pure crystals and mixtures of α- and γ-forms with various ratios were measured at a heating rate of 5.0 K min−1, as shown in Fig. 3a. For the mixtures, endothermic peaks were observed at melting start temperatures of 425 and 432 K, and exothermic peaks were observed at 428 K. This indicates that no phase transition beyond polymorphs occurs with the α-form crystal alone, but the transition occurs in cases containing both α- and γ-forms. In the simultaneous DSC-XRD measurement, the thermograms of α:γ = 1:1 showed the exothermic peak at 430.5 K (Fig. S4c†). This corresponds to the exothermic peak at 428 K in the DSC measurement. In the diffractogram in the temperature range of the exothermic peak, the α-form signal disappeared and only the γ-form signal was observed.
 | ||
| Fig. 3 (a) Differential scanning calorimetry (DSC) thermograms of INM at various mole fractions of α- and γ-forms. The temperature was raised at a rate of 5.0 K min−1, and the sample volume was 5 mg (n = 3). (b) Entropy of fusion of α- and γ-forms at various mole fractions of polymorphs; measured ΔfusSα (closed circles), ΔtrnSα→γ (open triangles), ΔfusSα (open circles), measured ΔfusSγ (closed squares), ΔfusSγ (dotted line). (c) Entropy changes of the α/γ-phase transition at various mole fractions of polymorphs (solid line), obtained by the sum of the mixing entropy (dashed line) and the asymmetric equation (dashed-dotted line), considering the site percolation model. | ||
Fig. 3b shows the entropy changes (J K−1 for the α-form) derived from the experimental peak areas at 428 K (closed circles) and those (J K−1 for the γ-form) derived from the peak areas at 432 K (closed squares), which are illustrated as functions of the mole fraction of the α-form. We superimposed the differences (open triangles) obtained by subtracting the contributions (dashed line) corresponding to the added amount of the γ-form from the entropy changes observed at 432 K. As a result, we found that the differences (open circles) obtained by subtracting the closed triangles from the closed circles were proportional to the mole fraction of the α-form. This means that the entropy change obtained at 428 K corresponds to the endothermic heat for melting of the α-form and the exothermal heat for the α/γ-phase transition.
3.4. Entropic contributions of mixing and geometry based on the site percolation theory
According to balance calculations, entropy changes are quantitatively available to the income and expenditure of heat for phase transitions at various temperatures. Crystallinity is frequently estimated using adjusted balance calculations of enthalpy changes at various temperatures. In principle, this may deviate from the definition of enthalpy change. As the melting entropy of organic compounds is considered to be slightly variable according to Walden's rule,56 differences in the number of polymorphs can be approximated by any arithmetic method based on apparent enthalpy changes (ΔfusH0 = TmΔfusS0). Polymorphism can be caused by slight differences in conformation and intermolecular interactions; therefore, such an approximation might not cause any serious issues. In contrast, entropy change is strictly proportional to the amount of state and the volume of the materials, because densities of the α- and γ-forms were different, even if the temperature changes. Therefore, crystallinity must eventually be associated with the entropy change in the material state and volume. An equal mixing of the two components is theoretically expected to produce an entropy that is symmetric to the contained proportion.57 This is described by eqn (4):|
ΔmixS = −R(xαlnxα − xγlnxγ),
| (4) |
In the present study on INM polymorphism, we assumed that the amount of contact between the α-form phase and the γ-form regulates whether the α/γ-phase transition is simply melted or progressed. Heat is believed to form a frontier surface that propagates through a material. Therefore, phase transitions and crystal melting occurred on the frontier surface. If the material consists of multiple phases, the phase with the lowest melting temperature initially melts and subsequently engulfs the other phases, which remain in their solid states, resulting in the formation of mixtures of S-ibuprofen (IBP, Tm = 325 K) and LDC in this study. INM melting behavior is dependent on the populations of phases that are easy and difficult to melt on the frontier surface. Therefore, the α/γ-phase transition can be interpreted using the two-dimensional percolation theory, which depends on the volume ratio.23,29,30 Assuming that the α- and γ-forms are in contact with each other in a hexagonal close-packed arrangement, they have a two-dimensional honeycomb geometry. It is reasonable to assume that the α/γ-phase transition is most prominent when the mole fraction of the α-form is around 1/3. Assuming this site percolation model (honeycomb model), we constructed an asymmetric equation as a function of the mole fraction, as shown in eqn (5).
 | (5) |
As can be seen in Fig. 3c, the sum of eqn (4) and (5) was applied to the curve fitting of the experimental entropy changes, yielding p = 3.882, q = 8.506, and an RMS value of 2.21. The curve of eqn (5) showed a peak maximum when the mole fraction of α-form was 68.66%, as calculated from the values of p and q. This result suggests that the melted α-form envelops the γ-form and undergoes a phase transition to realize the arrangement of “islands in the sea.” If the mole fraction is less than approximately 1/3, the melt phase from the α-form cannot effectively be in contact with the γ-form crystals on the frontier surface. Such a threshold that influences propagation is called a critical probability in the site percolation theory, indicating that the entropy changes of the α/γ-phase transition can be explained by the 2-dimensional honeycomb model. In the case of honeycomb structures, the theory predicts that the system properties will dramatically change near the probability of 0.652,59 which corresponds to approximately 1/3 mole fraction.
Kataoka et al.30 proposed different scenarios for the melting processes of mixtures of IBP and LDC depending on their proportions. When the amount of IBP was greater than that of LDC, the melted IBP enclosed the isolated crystalline LDC, and further melting of the LDC progressed with zero-order kinetics. If the amount of IBP was less than that of LDC, the melted IBP accelerated in the matrix on the LDC solid and penetrated it to form a liquid network. Melting accelerated with increasing temperature, resulting in negative 1/2 order kinetics. In the current study, the exact same mechanism was observed for the α- and γ-forms of INM. The melting process is kinetically regulated by the proportions of the two components with different melting points. Therefore, the most efficient phase transition appeared at approximately 1/3 the mole fraction of the α-form, which was predicted by the two-dimensional site percolation theory.
Fujita et al.29 reported that the most stable crystals of PRX cause supersaturation during dissolution for long periods, which is known as the parachute effect. As there were more stable hydrate crystals of PRX, the PRX solute maintained equilibrium not only immediately with the anhydrate crystals but also unhurriedly with the hydrate crystals. This was elucidated by adding a hydrate crystal as a seed to terminate supersaturation. Recrystallization of the anhydrate crystal via the unimolecular process would be kinetically prioritized over that of the hydrate crystal via the multimolecular processes of PRX and water(s), even if the hydrate crystal is thermodynamically stable. Such surface phenomena on solids may be regulated by most of their total surface areas. Here, the contribution of the two-dimensional site percolation theory intervenes. Both dissolution and heat conduction may have occurred at the frontier surface.
3.5. Dissolution enthalpy of the INM polymorphs
In the previous section, DSC thermograms were used to quantify the mole melting entropies of the α- and γ-forms. In this section, it is confirmed that these are different from those obtained using DSC. Eqn (2) is equivalent to the Van't Hoff reaction isochore equation, but its integral constant is interpreted as the dissolution enthalpy ΔdissH0 divided by the product of the gas constant R and the melting temperature of the solute Tm.48,49 For data processing using the eqn, the equilibrium concentrations of INM and its crystal were investigated in 25 mM PB (pH 6.8) at temperatures of 278, 298, and 313 K. Excess amounts of α- and γ-form crystals (10 mg) were added to 5 mL of the buffer solution, and the samples were shaken for individually determined periods. As shown in Fig. 4a, the dissolution curves for the α- and γ-forms at various temperatures were determined, and the nonlinear approximation curves were optimized to fit eqn (1). Table 1 lists the optimized parameters, C0, CS, and kS. CS of the α-form was 0.63, 1.45, and 2.45 mM, and that of the γ-form was 0.39, 1.01, and 1.78 mM at 278, 298, and 313 K, respectively. The CS were in agreement with the value reported by Kaneniwa et al.60 | ||
| Fig. 4 (a) INM dissolution behaviors in 25 mM KH2PO4/Na2HPO4 buffer at pH 6.8 (n = 3); α-form at 313 K (open squares), γ-form at 313 K (closed squares), α-form at 298 K (open circles), γ-form at 298 K (closed circles), α-form at 278 K (open triangles), γ-form at 278 K (closed circles). (b) Van't Hoff plots of INM; α-form (circles) and γ-form (squares). | ||
| α-Form | γ-Form | |||||||
|---|---|---|---|---|---|---|---|---|
| C0/mM | CS/mM | kS/min−1 | SS | C0/mM | CS/mM | kS/min−1 | SS | |
| 278 K | 0.16 ± 0.12 | 0.63 ± 0.01 | 0.17 ± 0.05 | 6.6 × 10⁻⁴ | 0.07 ± 0.06 | 0.39 ± 0.02 | 0.10 ± 0.04 | 9.4 × 10⁻⁴ |
| 298 K | 0.23 ± 0.10 | 1.45 ± 0.03 | 0.18 ± 0.04 | 6.2 × 10⁻³ | 0.13 ± 0.04 | 1.01 ± 0.05 | 0.20 ± 0.05 | 6.7 × 10⁻⁴ |
| 313 K | 0.32 ± 0.08 | 2.45 ± 0.18 | 0.14 ± 0.04 | 2.4 × 10⁻² | 0.15 ± 0.05 | 1.78 ± 0.16 | 0.14 ± 0.07 | 5.2 × 10⁻² |
Regression CS values were obtained, which increased in a temperature-dependent manner. As shown in Fig. 4b, the natural logarithms of the saturated concentration logCS were plotted as a function of the reciprocal of temperature 1/T. The slopes of the linear regressions for the α- and γ-forms involved the dissolution enthalpies of 28.2 ± 0.1 kJ mol−1 and 31.2 ± 0.8 kJ mol−1, respectively, where the difference between the dissolution enthalpy of the γ-form and that of the α-form was calculated as +3.0 ± 0.8 kJ mol−1, considering error propagation.
According to the Hildebrand model, the dissolution enthalpy consists of three terms: (i) the enthalpy to release a solute molecule from the solid crystal, (ii) the enthalpy to crack a hole in the solvent, and (iii) the enthalpy to fix the solute molecule into this hole.17,18 Assuming that the enthalpy change of (i) is comparable to the melting enthalpy, it can be obtained from the product of the experimental temperature and melting entropy, TΔfusS0. The difference in thermodynamic stability between the metastable alpha and the most stable gamma forms results from the solute–solvent interaction, whereas it contributes to the release of INM molecules from solids (ii) and (iii) does not affect enthalpy changes.
Cong et al.61 reported that the solubility of indapamide in various solvents was analyzed using KAT-LSER model with solubility parameters. The contribution of the solvent–solvent interaction corresponding to (ii) in the Hildebrand model was 1.97%, which was very small. In addition, since this term is derived from the activity coefficient,18 the effect of the activity coefficient is similarly small. At the stage where a solute is solvated, the ease with which a solvation layer is formed is determined by the clogging of molecules due to their attractive and repulsive forces.62 This determines the enthalpy change in (ii) of the Hildebrand model. Surface phenomena on solids, such as the transition from anhydrous crystals to hydrate crystals of PRX,29 cause differences in the formation of hydrated structures at the solid–liquid interface, and the enthalpy change cannot be ignored. However, since the INM polymorphs are anhydrous and have sufficiently high hydrophobicity, it is expected that there will be no major difference in the formation of the hydrated structure (ii) between the α and γ forms.
Thus, we express the sum of (ii) and (iii) as Δh. The dissolution enthalpy in the model can thus be represented as (TΔfusS0 + Δh). Since the melting entropy of the α-form is 54.6 ± 4.7 J K−1 mol−1, the values of TΔfusS0 were calculated as 16.3 ± 1.4 kJ mol−1 at 298 K. The melting entropy of the α-form of 62.7 ± 7.9 J K−1 mol−1 resulted in a TΔfusS0 of 18.7 ± 2.3 kJ mol−1. The calculated difference between the dissolution enthalpy (TΔfusS0 + Δh) of the γ-form and that of the α-form was +2.4 ± 0.3 kJ mol−1, considering error propagation. This is in agreement with the previous value of +3.0 ± 0.8 kJ mol−1 obtained from dissolution experiments. These results indicate that the mole melting entropies for the α- and γ-forms were quantitatively confirmed by dissolution experiments.
Furthermore, the dependence of the molecular emissivity of the solute on the energy level of the crystal was determined by energy calculations using the DMol3 module. The periodic boundary cells of the α- (lattice mass: 2146.75 amu) and γ- (lattice mass: 715.58 amu) forms are shown in Scheme S1.† The thermodynamic parameters were obtained by the DMol3 module using the LDA-PWC method and DND or DNP basis sets. For comparison with the enthalpy of dissolution (TΔfusS0 + Δh), we calculated the product of the entropy at 298.15 K and its temperature (TS). The difference in TS between α and γ forms was −1.1805 kJ mol−1 for LDA-PWC/DND, that for LDA-PWC/DNP was 2.7479 kJ mol−1, and that for LDA-PWC/DNP+ was 2.5133 kJ mol−1 (Table 2). The TS value for LDA-PWC/DNP+ was consistent with ΔdissH0 and TΔfusS0. The difference in energy levels between the α- and γ-forms is directly reflected in the molecular release of solutes in a solution. As the approximation accuracy in quantum computations improves, the calculated values tend to converge towards the true energy state. Luo et al.63 compared the theoretical atomization energies (D0) of 44 molecules obtained using four different numerical basis sets: DN, DND, DNP, and TNP. Their findings suggested that the DNP basis set is sufficiently accurate for predicting D0 at an affordable computational cost.
3.6. Influence of solvation modified by solubilizers on the dissolution of INM polymorphs
In section 3.5, we defined Δh as the enthalpy change that encompasses various factors, including (ii) the enthalpy of opening a hole in the solvent and (iii) the enthalpy of fixing the solute molecule in this hole. In this section, we will further discuss the significance of Δh in relation to the dissolution process. Δh was introduced as an invariable under the conditions described in the previous section. Even if Δh is independent of the release of the solute, modification of the solute using a solubilizer has not yet been determined. The dissolution curves of the INM polymorphs were obtained in the presence and absence of LDC and DTZ as solubilizers, as shown in Fig. 5a. The saturated concentrations of the α- and γ-forms of INM were obtained by curve fitting using eqn (1) (Table 3). Whilst the addition of 10 mM LDC provided saturated concentrations 2.5-fold those of controls for both the α- and γ-forms of INM, the addition of 10 mM DTZ decreased the obtained saturated concentrations to 1/5 of controls for both forms. Increments and decrements in the saturated concentrations were conserved for INM for both the α- and γ-forms, and changes in Δh were completely independent of the release of the solute.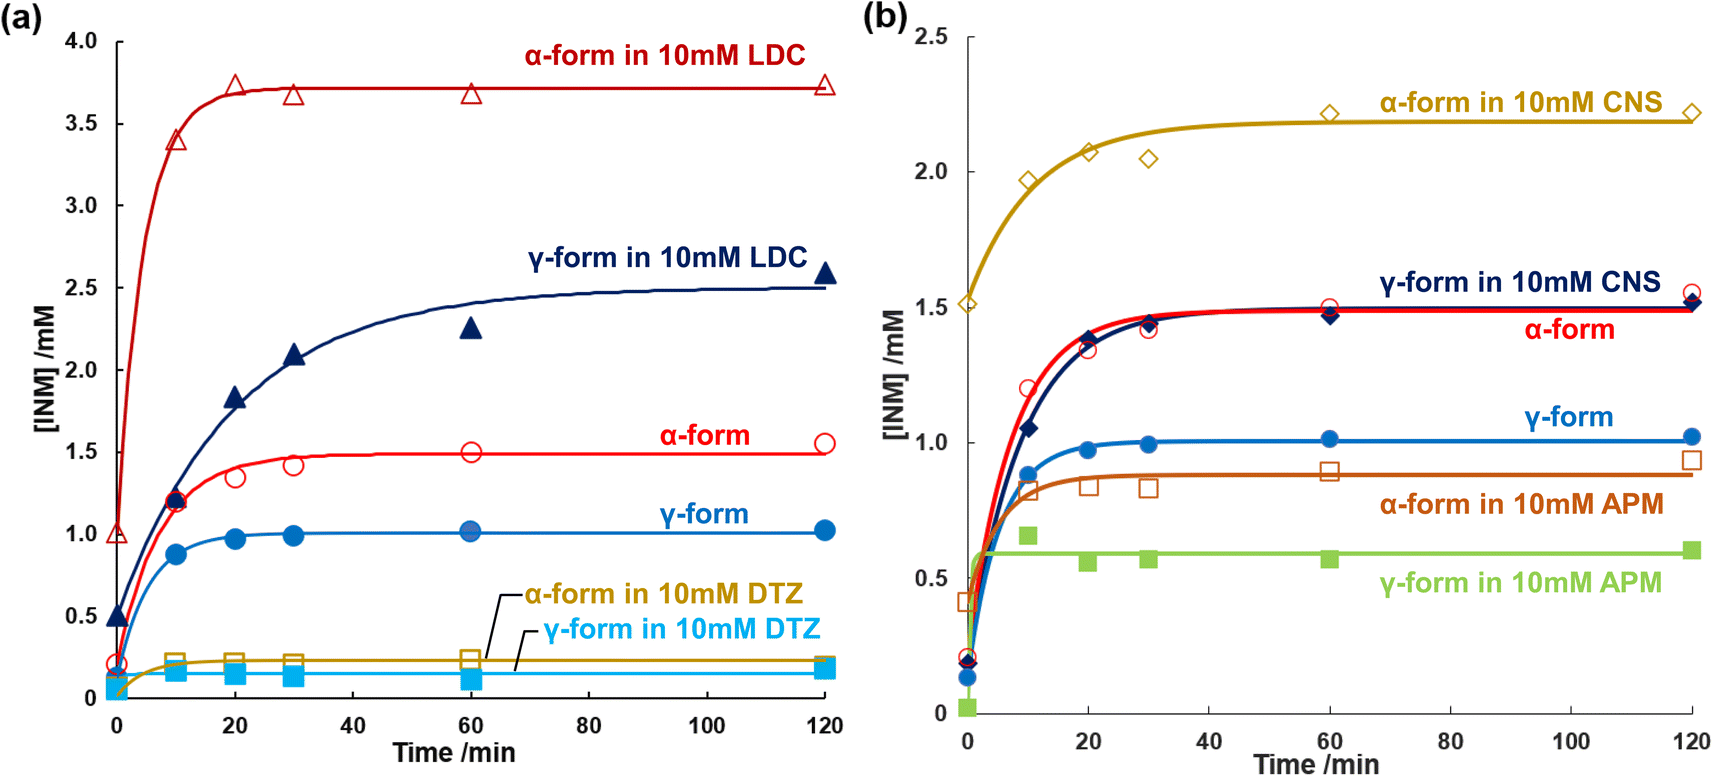 | ||
| Fig. 5 (a) INM dissolution behaviors in phosphate buffer (pH 6.8) at 298 K; α-form in 10 mM LDC (open triangles), γ-form 10 mM LDC (closed triangles), α-form in the absence of additives (open circles), γ-form in the absence of additives (closed circles), α-form in 10 mM DTZ (open squares), γ-form in 10 mM DTZ (closed squares). (b) INM dissolution behaviors in phosphate buffer (pH 6.8) at 298 K; α-form in 10 mM CNS (open diamonds), γ-form in the absence of CNS (closed diamonds), α-form in the absence of additives (open circles), γ-form in the absence of additives (closed circles), α-form in 10 mM APM (open squares), γ-form in 10 mM APM (closed squares). | ||
| α-Form | γ-Form | |||||||
|---|---|---|---|---|---|---|---|---|
| C0/mM | CS/mM | kS/min−1 | SS | C0/mM | CS/mM | kS/min−1 | SS | |
| LDC | 0.27 | 3.72 | 0.22 | 5.4 × 10⁻³ | 0.20 | 2.50 | 0.050 | 4.0 × 10⁻² |
| DTZ | 0.066 | 0.23 | 0.22 | 5.8 × 10⁻³ | 0.36 | 0.15 | 1.37 | 2.9 × 10⁻³ |
| CNS | 0.70 | 2.18 | 0.092 | 1.3 × 10⁻² | 0.12 | 1.50 | 0.11 | 2.3 × 10⁻³ |
| APM | 0.47 | 0.88 | 0.18 | 6.6 × 10⁻³ | 0.030 | 0.59 | 2.64 | 6.7 × 10⁻³ |
To avoid the possibility that this effect would be specific to basic drugs, peptides were selected for examination as amphoteric electrolyte solubilizers. We found that CNS increased but APM decreased at saturated concentrations of the α- and γ-forms of INM, as summarized in Fig. 5b. Previous studies have reported that various amino acids do not improve the solubility of INM,12 and that CNS and APM increase and decrease the saturation concentration of INM, respectively. The effects of the dipeptides were conserved in both the α- and γ-forms. Yet again, the changes in Δh with the addition of the solubilizers LDC, DTZ, CNS, and APM were completely independent of the solute release.
In addition, we confirmed that the hydrotropes did not affect solute release. The precipitate obtained after shaking INM in 25 mM PB (pH 6.8) was analyzed using 1H-NMR spectroscopy. The results of this analysis are shown in Fig. S5.† No hydrotrope signal was observed in the precipitate of the solution containing LDC, CNS, or APM; only the INM signal was observed. According to the integral values of protons, it was confirmed that DTZ:INM was present in the precipitate at a ratio of 1:7.5; however, DTZ and INM signals did not change. These findings suggest that there is no physicochemical interaction between DTZ and INM and that each was simply precipitated.
The effect of the solubilizer on the saturated concentration can often be described by the Setschenow coefficient of hydrotropy.11–13 Alsalhi and Chan12 reported the effects of amino acid hydrotropes on the solubility of acidic INM and neutral carbamazepine. As tryptophan could enhance the solubility of INM, this heterocyclic amino acid may act as an effective solubilizer, similar to CNS. Abranches et al.13 investigated the effect of ionic liquid components on the solubility of naproxen and IBP using the Setschenow coefficients. A positive value of the Setschenow coefficient indicates that the solubilizer decreased the solubility of the electrolyte, stated as the “salting-out” effect. In contrast, its negative value illustrates an increase in electrolyte solubility, described as “salting-in.” In this study, the saturated concentrations obtained were rearranged using the Setschenow coefficients. The Ksalt values for LDC were consistent at −39.7 and −39.6 for the α- and γ-forms, respectively. The values for DTZ showed non-significant differences of +80.4 and +82.9, respectively. Those for CNS were −16.7 and −17.3, respectively, indicating improved solubility of the INM polymorphs at the same level. Those for APM were +22.7 and +23.2, respectively, indicating reduced solubility. All the obtained Setschenow coefficients were in agreement with the α- and γ-forms of INM. Because the solubility of INM was dependent on the source crystals, it was not determined by the formation of a soluble complex; instead, it was dominated by the chemical potential of the solvent with additives and buffers.
In the approach by Shimada et al.25 to determine the role of solubilizers LDC, local anesthetics, and DTZ on the solubility of INM, the authors used the parameter (ξ) with a definition similar to that of the Setschenow coefficients and a quantitative structure–property relationship study. They found that the effect of the solubilizer was correlated with the hydrophobicity of the solubilizer and the difference between the melting temperatures of INM and that of the eutectic mixture of INM and the solubilizer. They concluded that the latter corresponds to the stability of the solute in the liquid phase. In the present study, the Setschenow coefficients influenced the changes in Δh but not those of the solute polymorphs nonlinear regression, supporting Shimada's conclusion. However, the effects of these solubilizers are yet to be investigated. The inclusion of HP-β-CD provides a phase transition to the metastable polymorph of INM and supersaturation under acidic conditions.22 Though Kataoka et al.30 elucidated the melting process of the IBP and LDC mixture, the authors could not explain why LDC-facilitated melting of IBP decreases the solubility of IBP. Chatani et al.23 reported that the solubility of a drug is influenced by buffer components, such as phosphate, Britton–Robinson universal prescription, imidazolium salt, and a variety of Good's buffers. Kinoshita et al.27 claimed the entropy-enthalpy compensation of variable combinations of solubilizers to prevent the formation of a soluble complex. Hereafter, it is expected to yield a solution under the conditions of a thermodynamically homogeneous solute dissolved from heterogeneous polymorphic crystals.
4. Conclusion
Polymorphs of the α- and γ-forms of INM were prepared and confirmed to be stable through XRPD diffractograms and ATR-FTIR spectra analysis at standard temperature. The pure crystals and mixtures were analyzed using DSC; their melting processes and α/γ phase transitions were determined. The thermodynamic balances were calculated for the melting entropy of the α- and γ-forms and the thermodynamic parameters obtained were 54.6 and 62.7 J K−1 mol−1 for the α- and γ-forms, respectively. Dissolution is explained to consist of the step of releasing a single molecule from the crystal, accepting it into the solvent and forming an intermolecular interaction by Hildebrand's regular solution theory. The dissolution phenomenon of crystals consists of releasing a single molecule from the crystal, accepting it into the solvent and forming intermolecular interactions. According to the Van't Hoff plot for the dissolution experiment of the α- and γ-forms in 25 mM PB at pH 6.8, their dissolution enthalpy values were estimated as 28.2 and 31.2 kJ mol−1, respectively. The obtained dissolution enthalpy was explained by both the melting entropy values obtained from DSC thermal analyses and the thermodynamic contribution of the solute, which was regulated by solubilizers of the basic drugs (LDC and DTZ) and amphoteric dipeptides (CNS and APM). Changes in Δh with these solubilizers were observed in both α and γ forms and were found to be independent of solute release. The contribution derived from the melting entropy of solute INM and the independent contribution of the solvent with solubilizers could be divided, and it was confirmed that the contribution from the melting entropy of the solute was conserved for the α- and γ-forms of INM. These findings are expected to improve the current understanding of the characterization of solvents containing additives and buffers using solutes from different polymorphic crystals.Author contributions
Kanji Hasegawa: investigation, visualization, writing – original draft. Satoru Goto: investigation and supervision. Hikaru Kataoka: review, and editing. Hitoshi Chatani: review, and editing. Takatoshi Kinoshita: review, and editing. Hideshi Yokoyama: review, and editing. Tomohiro Tsuchida: review, and editing.Conflicts of interest
There are no conflicts to declare.References
- A. S. Raw, M. S. Furness, D. S. Gill, R. C. Adams, F. O. Holcombe and L. X. Yu, Adv. Drug Delivery Rev., 2004, 56, 397–414 CrossRef CAS PubMed.
- L. Wu, J. Zhang and W. Watanabe, Adv. Drug Delivery Rev., 2011, 63, 456–469 CrossRef CAS PubMed.
- M. Banerjee, K. Nimkar, S. Naik and V. Patravale, J. Controlled Release, 2022, 348, 456–469 CrossRef CAS PubMed.
- Y. Otsuka and S. Goto, J. Drug Delivery Sci. Technol., 2022, 67, 102918 CrossRef CAS.
- S. Baghel, H. Cathcart and N. J. O'Reilly, J. Pharm. Sci., 2016, 105, 2527–2544 CrossRef CAS PubMed.
- K. Löbmann, R. Laitinen, H. Grohganz, K. C. Gordon, C. Strachan and T. Rades, Mol. Pharm., 2011, 8, 1919–1928 CrossRef PubMed.
- N. R. Goud, K. Suresh, P. Sanphui and A. Nangia, Int. J. Pharm., 2012, 439, 63–72 CrossRef CAS PubMed.
- S. Cherukuvada and A. Nangia, Chem. Commun, 2014, 50, 906–923 RSC.
- C. Leuner and J. Dressman, Eur. J. Pharm. Biopharm., 2000, 50, 47–60 CrossRef CAS PubMed.
- T. N. Hiew and L. S. Taylor, J. Controlled Release, 2022, 352, 47–60 CrossRef CAS PubMed.
- C. V. Subbarao, I. P. K. Chakravarthy, A. V. S. L. Sai Bharadwaj and K. M. M. Prasad, Chem. Eng. Technol., 2012, 35, 225–237 CrossRef CAS.
- M. S. Alsalhi and K. L. A. Chan, Int. J. Pharm., 2022, 617, 121591 CrossRef CAS PubMed.
- D. O. Abranches, J. Benfica, B. P. Soares, A. M. Ferreira, T. E. Sintra, S. Shimizu and J. A. Coutinho, Chem. Commun, 2021, 57, 2951–2954 RSC.
- K. Kawakami, Adv. Drug Delivery Rev., 2012, 64, 480–495 CrossRef CAS PubMed.
- S. Shimizu, A. Wada-Hirai, Y. Li, Y. Shimada, Y. Otsuka and S. Goto, J. Pharm. Sci., 2020, 109, 2206–2212 CrossRef CAS PubMed.
- S. Venkatesh, J. Li, Y. Xu, R. Vishnuvajjala and B. D. Anderson, Pharm. Res., 1996, 13, 1453–1459 CrossRef CAS PubMed.
- A. T. Florence and D. Attwood, in Physicochemical Principles of Pharmacy: In Manufacture, Formulation and Clinical Use, Pharmaceutical Press, 2015, pp. 141–143 Search PubMed.
- D. J. Grant and T. Higuchi, in Solubility Behavior of Organic Compounds, John Wiley & Sons, 1990, vol. 21, pp. 46–54 Search PubMed.
- G. L. Amidon, H. Lennernäs, V. P. Shah and J. R. Crison, Pharm. Res., 1995, 12, 413–420 CrossRef CAS PubMed.
- H. M. Varshney and A. Chatterjee, Int. J. Ther. Appl., 2012, 6, 13 Search PubMed.
- C. C. Sun, J. Pharm. Sci., 2009, 98(5), 1671–1687 CrossRef CAS PubMed.
- A. Wada-Hirai, S. Shimizu, R. Ichii, C. Tsunoda, R. Hiroshige, M. Fujita, Y.-P. Li, Y. Shimada, Y. Otsuka and S. Goto, J. Pharm. Sci., 2021, 110, 3623–3630 CrossRef CAS PubMed.
- H. Chatani, S. Goto, H. Kataoka, M. Fujita, Y. Otsuka, Y. Shimada and H. Terada, Chem. Phys., 2019, 525, 110415–110417 CrossRef CAS.
- T. Kasai, K. Shiono, Y. Otsuka, Y. Shimada, H. Terada, K. Komatsu and S. Goto, Int. J. Pharm., 2020, 590, 119841 CrossRef CAS PubMed.
- Y. Shimada, S. Goto, H. Uchiro, H. Hirabayashi, K. Yamaguchi, K. Hirota and H. Terada, Colloids Surf., B, 2013, 102, 590–596 CrossRef CAS PubMed.
- Y. Shimada, R. Tateuchi, H. Chatani and S. Goto, J. Mol. Struct., 2018, 1155, 165–170 CrossRef CAS.
- T. Kinoshita, C. Tsunoda, S. Goto, K. Hasegawa, H. Chatani, M. Fujita, H. Kataoka, Y. Katahara, Y. Shimada, Y. Otsuka, K. Komatsu and H. Terada, Chem. Pharm. Bull., 2022, 70, 120–129 CrossRef CAS PubMed.
- R. Tateuchi, N. Sagawa, Y. Shimada and S. Goto, J. Phys. Chem. B, 2015, 119, 9868–9873 CrossRef CAS PubMed.
- M. Fujita, S. Goto, H. Chatani, Y. Otsuka, Y. Shimada, H. Terada and K. Inoo, J. Phys. Chem. B, 2015, 119, 9868–9873 CrossRef PubMed.
- H. Kataoka, Y. Sakaki, K. Komatsu, Y. Shimada and S. Goto, J. Pharm. Sci., 2017, 106, 3016–3021 CrossRef CAS PubMed.
- Y. P. Lee, S. Goto, Y. Shimada, K. Komatsu, Y. Yokoyama, H. Terada and K. Makino, J. Phys. Chem. Biophys., 2015, 5, 1000187 Search PubMed.
- K. Ikeda, M. Maruyama, Y. Takahashi, Y. Mori, H. Y. Yoshikawa, S. Okada, H. Adachi, S. Sugiyama, K. Takano, S. Murakami, H. Matsumura, T. Inoue, M. Yoshimura and Y. Mori, Appl. Phys. Express, 2015, 8, 045501 CrossRef.
- S. Wada, S. Kudo and H. Takiyama, J. Cryst. Growth, 2016, 435, 37–41 CrossRef CAS.
- T. Xu, K. Nahar, R. Dave, S. Bates and K. Morris, Pharm. Res., 2018, 35, 140 CrossRef PubMed.
- M. Hugo Silva, A. Kumar, B. K. Hodnett, L. Tajber, R. Holm and S. P. Hudson, Cryst. Growth Des., 2022, 22, 6056–6069 CrossRef CAS PubMed.
- T. Van Duong, D. Lüdeker, P.-J. Van Bockstal, T. De Beer, J. Van Humbeeck and G. Van den Mooter, Mol. Pharm., 2018, 15, 1037–1051 CrossRef CAS PubMed.
- S. Tanabe, K. Higashi, M. Umino, W. Limwikrant, K. Yamamoto and K. Moribe, Int. J. Pharm., 2012, 429, 38–45 CrossRef CAS PubMed.
- S. H. Yalkowsky, in Solubility and Solubilization in Aqueous Media, American Chemical Society, 1999, pp. 73–77 Search PubMed.
- S. A. Surwase, J. P. Boetker, D. Saville, B. J. Boyd, K. C. Gordon, L. Peltonen and C. J. Strachan, Mol. Pharm., 2013, 10, 4472–4480 CrossRef CAS PubMed.
- Y. Kong and J. N. Hay, Polymer, 2002, 43, 3873–3878 CrossRef CAS.
- A. Rudin and P. Choi, Mechanical properties of polymer solids and liquids, in The Elements of Polymer Science & Engineering, Springer, 3rd edn, 2013, pp. 149–229 Search PubMed.
- G. W. H. Höhne, Thermochim. Acta, 1991, 187, 283–292 CrossRef.
- Y. Kann, M. Shurgalin and R. K. Krishnaswamy, Polym. Test., 2014, 40, 218–224 CrossRef CAS.
- W. M. Facchinatto, D. M. dos Santos, A. Fiamingo, R. Bernardes-Filho, S. P. Campana-Filho, E. R. de Azevedo and L. A. Colnag, Carbohydr. Polym., 2020, 250, 116891 CrossRef CAS PubMed.
- G. W. H. Höhne, W. Hemminger and H.-J. Flammersheim, in Differential Scanning Calorimetry: An Introduction for Practitioners, Springer, 1996 Search PubMed.
- V. B. F. Mathot and M. F. J. Pijpers, Thermochim. Acta, 1989, 151, 241–259 CrossRef CAS.
- N. Hamdi, Y. Feutelais, N. Yagoubi, D. de Girolamo and B. Legendre, J. Therm. Anal. Calorim., 2004, 76, 985–1001 CrossRef CAS.
- M. Malinovský and V. Sekerová, Chem. Zvesti, 1979, 33, 15–22 Search PubMed.
- P. Augustijns and M. E. Brewster, in Solvent Systems and Their Selection in Pharmaceutics and Biopharmaceutics, Springer, 2007, vol. 190, pp. 1–27, 221–256 Search PubMed.
- M. Soustelle, in Phase Transformations, Wiley, 2016 Search PubMed.
- J. P. Perdew and Y. Wang, Phys. Rev. B: Condens. Matter Mater. Phys., 1992, 45, 13244 CrossRef PubMed.
- J. Štukelj, S. Svanbäck, J. Kristl, C. J. Strachan and J. Yliruusi, Anal. Chem., 2019, 91, 3997–4003 CrossRef PubMed.
- L. S. Taylor and G. Zografi, Pharm. Res., 1997, 14, 1691–1698 CrossRef CAS PubMed.
- N. Kaneniwa, M. Otsuka and T. Hayashi, Chem. Pharm. Bull., 1985, 33, 3447–3455 CrossRef CAS PubMed.
- S. Qi and D. Q. M. Craig, Mol. Pharm., 2012, 9, 1087–1099 CrossRef CAS PubMed.
- A. Abdelaziz, D. H. Zaitsau, N. V. Kuratieva, S. P. Verevkin and C. Schick, Phys. Chem. Chem. Phys., 2019, 21, 12787–12797 RSC.
- S. H. Yalkowsky and S. Banerjee, in Aqueous Solubility: Methods of Estimation for Organic Compounds, Marcel Dekker, 1992, pp. 11–17 Search PubMed.
- X. Chen, K. R. Morris, U. J. Griesser, S. R. Byrn and J. G. Stowell, J. Am. Chem. Soc., 2002, 124, 15012–15019 CrossRef CAS PubMed.
- M. B. Isichenko, Rev. Mod. Phys., 1992, 64, 961–1043 CrossRef.
- N. Kaneniwa, M. Otsuka, J. Ichikawa, T. Hayashi, K. Hayashi, O. Umezawa, K. Kawakami and H. Asami, J. Soc. Powder Technol., Jpn., 1990, 27(1), 11–17 CrossRef CAS.
- Y. Cong, C. Du, M. Wang, Z. Jiang, K. Xing, Y. Bian and M. Wang, J. Mol. Liq., 2021, 334, 116489 CrossRef CAS.
- J. N. Israelachvili, in Intermolecular and Surface Forces, Academic Press, 2011, pp. 349–354 Search PubMed.
- Y. Luo, S. Yin, W. Lai and Y. Wang, Theor. Chem. Acc., 2014, 133, 1580 Search PubMed.
Footnote |
| † Electronic supplementary information (ESI) available. See DOI: https://doi.org/10.1039/d3ra08481g |
| This journal is © The Royal Society of Chemistry 2024 |