 Open Access Article
Sesquiterpenoids and hexanorcucurbitacin from Aquilaria malaccensis agarwood with anti-inflammatory effects by inhibiting the STAT1/AKT/MAPK/NLRP3 pathway†
Chi Thanh Ma‡
 ab,
Tianqi Huang‡bc,
Jae Sik Yu‡
 b,
Tu Loan Ly
 d,
Kim Long Vu Huynhd,
Sung Won Kwon
 e,
Jeong Hill Park
 e and
Hyun Ok Yang
 *b
*b
aFaculty of Pharmacy, University of Medicine and Pharmacy at Ho Chi Minh City, 41-43 Dinh Tien Hoang St, Dist 1, Ho Chi Minh City 700000, Vietnam. E-mail: mcthanh@ump.edu.vn
bDepartment of Integrative Biological Sciences and Industry & Convergence Research Center for Natural Products, Sejong University, 209, Neungdong-ro, Gwangjin-gu, Seoul 05006, Republic of Korea. E-mail: jsyu@sejong.ac.kr; hoyang@sejong.ac.kr; Fax: +82-02-3408-4336; Tel: +82-02-3408-1959
cKorea Institute of Science and Technology (KIST) School, Korea University of Science and Technology (UST), 5 Hwarang-ro 14-gil, Wolgok 2(i)-dong, Seongbuk-gu, Seoul 02792, Republic of Korea. E-mail: 618509@kist.re.kr
dFaculty of Pharmacy, Ton Duc Thang University, Ho Chi Minh City, Vietnam. E-mail: lytuloan@tdtu.edu.vn; vuhuynhkimlong@tdtu.edu.vn
eResearch Institute of Pharmaceutical Sciences, College of Pharmacy, Seoul National University, 1 Gwanak-ro, Gwanak-gu, Seoul 08826, Republic of Korea. E-mail: swkwon@snu.ac.kr; hillpark@snu.ac.kr
First published on 2nd April 2024
Abstract
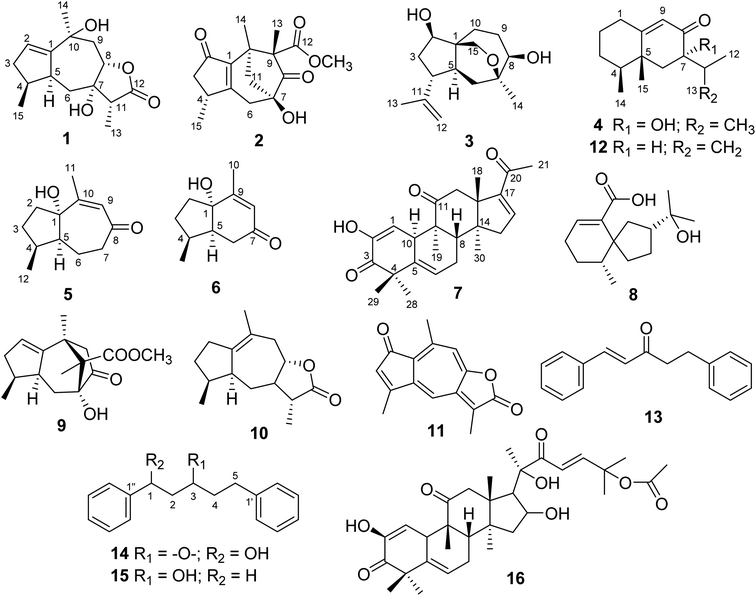
Seven unknown compounds 1–7, including four sesquiterpenoids, one azulene-type, one indene-type, and one rare hexanorcucurbitacin, together with eleven knowns ones (8–16), were isolated from the agarwood chips of Aquilaria malaccensis. The structures of the isolated compounds were elucidated by extensive spectroscopic methods such as mass spectrometry, UV, IR, NMR spectroscopy. The precise stereo-chemical configurations of new compounds were determined by calculated ECD spectra data, as well as a single-crystal X-ray diffraction analysis. The isolated compounds 1–7 were evaluated by estimating the levels of nitric oxide (NO), TNF-α, and the expression of enzyme iNOS, and COX-2. Among them, a rare hexanortriterpenoid (7) derived from a cucurbitane-type triterpenoid showed the significantly attenuated neuro-inflammatory effects via the STAT1/AKT/MAPK/NLRP3 signaling pathway on the mechanistic studies.
Introduction
Inflammation has become a major global health issue in recent years.1 Although inflammation is a normal physiological body response against a toxic stimulus to maintain body homeostasis.2 Emerging evidence has demonstrated that neuroinflammation plays a causal role in the pathogenesis of neurodegenerative diseases in the central nervous system (CNS), including Alzheimer's disease (AD) and Parkinson's disease.3 Pro-inflammatory cytokines production is associated with an increase of Aβ concentration in AD mice models, suggesting Aβ to be a key factor that drives neuroinflammation.4 As the resident phagocytes and innate immune cells of the CNS, microglia are vital in the progression of neurodegenerative diseases by mediating neuroinflammatory responses.5 Nevertheless, when subjected to prolonged activation, microglia undergo functional alterations, notably an excessive production of pro-inflammatory cytokines. Therefore, targeting microglia-mediated neuroinflammation may be an effective therapy to protect neurons in neurodegenerative disease.Natural compounds derived from plant species have been proven to have various biological functions, including immune regulation, antitumor, and other health benefits with low toxicity.6 Many types of phytochemicals can regulate inflammation in CNS by regulating oxidative stress, and signal transduction of inflammatory pathways.7 Therefore, they have long been widely used in the medical field, the catering industry, and other areas of human life. The pathogenesis of neurodegenerative disease is associated with immune disorders and inflammation, oxidative stress,8 which indicates that plant compounds may potentially be developed as a therapeutant.
A. malaccensis, known as agarwood, belongs to the Thymelaeaceae family, which is widely spread in South Asia. A. malaccensis is used in traditional herbal medicine to relieve epilepsy, rheumatism, inflammation, weakness, bronchitis, and in the treatment of snake bites.9 And recently, in vivo and in vitro studies reported the phytomedicinal uses of agarwood of anti-inflammatory, immunomodulatory, anti-obesity, antidiabetic activity in asthma, neurological disorders, stress and anxiety reduction, cancer, and others.10 While A. malaccensis and agarwood have shown potential in various areas of traditional medicine, scientific research is still ongoing to validate these claims and to better understand the specific bioactive compounds responsible for these effects.
Hence, this study demonstrates the phytochemical investigation of the extract of A. malaccensis and the pharmacological activities of seven previously undescribed compounds. The isolated novel compounds were investigated for their potential to attenuate NO production and signalling from LPS-stimulated BV-2 cell in the present study.
Results and discussion
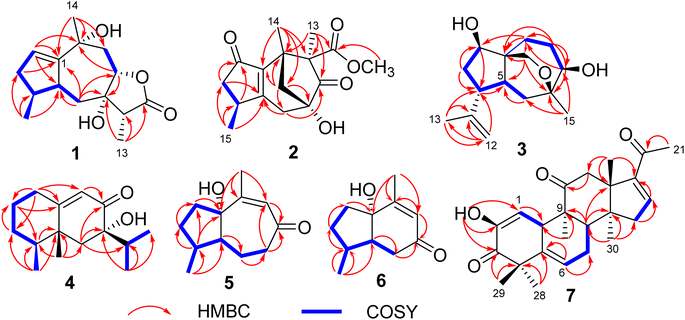
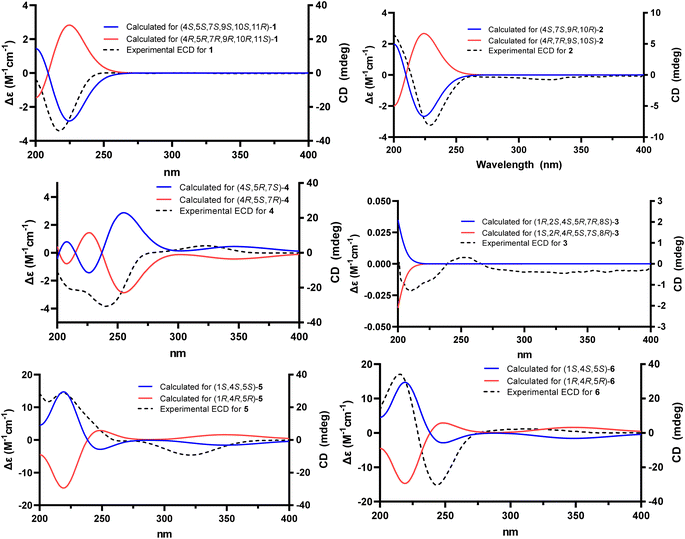
Compound 1 was obtained as a colorless oil with specific optical rotation [α]20D −81.2 (c 0.1, MeOH). The HRESI-MS spectrum of 1 showed a positive ion peak at m/z 249.1479 [M + H]+ (calcd for C15H21O3, 249.1485), corresponding to the molecular formula C15H20O3, implying 5 degrees of unsaturation. The measured CD spectrum of 1 exhibited a negative cotton effect around 220 nm due to the n → π* transition of the ketone group. The 1H NMR data (Table 1) revealed the presence of one olefinic (δH 5.82 dd, J = 4.0, 1.6 Hz, H-2), one oxymethine (δH 4.22, dd, J = 12.0, 1.6 Hz, H-8), three aliphatic methines (δH 2.58 (H-11), 2.56 (H-5), and 2.39 (H-4)), and three methyl groups (δH 1.32 (H3-14), 1.12 (H3-13), and 1.05 (H3-15)). The 13C NMR data (Table 2) showed the presence of 15 carbon signals, including one carbonyl group at δC 181.7 (C-12), three nonprotonated carbons at δC 158.6 (C-1), 79.8 (C-1), and 73.4 (C-1), five methine carbons at δC 127.7 (C-2), 84.6 (C-8), 50.1 (C-11), 44.5 (C-5) and 41.8 (C-4), three methylene carbons at δC 40.2 (C-9), 39.1 (C-3), and 36.7 (C-6), and three methyls at δC 33.1 (C-14), 16.4 (C-15), and 8.23 (C-13). These data suggest that 1 is a guaiane-type sesquiterpene lactone. The 1H–1H COSY spectrum revealed the correlations of two spin-coupling systems of H-2/H2-3/H-4(/H3-15)/H-5/H2-6 and H-8/H2-9 (Fig. 2). The key HMBC correlations were observed from H-2 to C-1/C-3/C-4/C-5/C-10, from H2-3 to C-1/C-2/C-4/C-5/C-15, from H-4 to C-3/C-5/C-6/C-15, from H2-6 to C-1/C-4/C-5/C-7/C-8/C-11, from H-8 to C-7/C-9/C-10, from H2-9 to C-1/C-7/C-8/C-10, from H-11 to C-6/C-7/C-8/C-12/C-13, from H3-13 to C-7/C-11/C-12, from H3-14 to C-1/C-9/C-10, and from H3-15 to C-3/C-4/C-5 (Fig. 2). The NOESY correlations were observed between H-4 and H-3a/H-5, between H-6a and H-5/H3-13, between H-9a and H3-14 suggest that H-3a, H-4, H-5, H-6a, H-9a, H3-13, and H3-14 were in α-orientation. Correlations between H-8 and H-6b/H-9b/H-11, between H3-15 and H-3b in the NOESY spectrum, indicated that H-8, H-11, and H3-15 were in the β-orientation (Fig. S6†). The absolute configuration of 1 was assigned as 4S,5S,7S,8S,10S,11R by the comparison of calculated and experimental ECD spectra, as shown in Fig. 3. Therefore, the structure of 1 was elucidated as 7α,10β-dihydroxy-4αH,5αH,8βH,11βH-guaia-1(2)-en-12,8α-olide.| No. | 1 (CD3OD)c | 2 (CD3OD)a | 3 (CDCl3)c | 4 (CDCl3)b | 5 (CDCl3)c | 6 (CDCl3)c |
|---|---|---|---|---|---|---|
| δH mult (J, Hz) | δH mult (J, Hz) | δH mult (J, Hz) | δH mult (J, Hz) | δH mult (J, Hz) | δH mult (J, Hz) | |
| a Data were measured at 400 MHz (1H) and 100 MHz (13C).b Data were measured at 500 MHz (1H) and 125 MHz (13C).c Data were measured at 800 MHz (1H) and 200 MHz (13C). | ||||||
| 1a | — | — | — | 2.24 m | — | |
| 1b | — | — | — | 2.30 ddd (14.5, 5.5, 2.0) | — | |
| 2a | 5.82 dd (4.0, 1.6) | — | 4.00 dd (9.6, 6.4) | 1.85 dddd (12.0, 8.0, 5.5, 3.0) | 1.97 m | 1.97 m |
| 2b | — | — | 1.42 m | 1.93 m | ||
| 3a | 2.23 ddd (16.0, 7.2, 3.2) | 2.70 dd (18.8, 6.4) | 1.96 ddd (13.6, 8.8, 7.2) | 1.43 m | 1.91 m | 2.05 m |
| 3b | 1.98 ddt (16.0, 10.4, 1.6) | 1.98 dd (18.8, 1.2) | 1.80 ddd (13.6, 9.6, 6.4) | 1.54 ddd (12.0, 8.0, 5.0) | 1.24 m | 1.47 m |
| 4 | 2.39 m | 2.79 m | 2.57 m | 1.42 m | 2.72 m | 2.71 m |
| 5 | 2.56 m | — | 1.87 m | 1.78 ddd (11.2, 5.6, 1.6) | 2.29 dt (12.8, 6.4) | |
| 6a | 1.90 dd (13.6, 3.2) | 2.59 d 14.4 | 1.85 dd (20.0, 10.4) | 1.99 dd (13.0, 4.5) | 1.75 dtd (14.4, 4.0, 1.6) | 2.09 dd (16.0, 12.8) |
| 6b | 1.27 t (12.8) | — | 1.53 dd (20.0, 9.6) | 1.44 m | 1.37 dddd (14.4, 12.8, 11.2, 5.6) | 2.38 dd (16.0, 6.4) |
| 7a | — | — | — | 2.60 dt (18.4, 4.0) | ||
| 7b | — | — | 2.46 ddd (18.4, 12.8, 4.0) | |||
| 8 | 4.22 dd (12.0, 1.6) | — | 3.48 overlap | 5.74 s | ||
| 9a | 2.57 dd (14.4, 11.2) | — | 1.74 m | 5.68 d (2.0) | 5.74 s | |
| 9b | 1.88 dd (14.4, 1.6) | — | 1.68 m | |||
| 10a | — | — | 2.10 td (13.6, 4.0) | 2.00 d (1.0) | ||
| 10b | 1.56 m | |||||
| 11a | 2.58 q (7.2) | 2.48 dd (11.6, 1.2) | 2.50 dd (15.0 4.5) | 1.99 s | 0.93 d (7.2) | |
| 11b | — | 2.03 d (11.6) | ||||
| 12a | — | — | 4.71 d (1.6) | 1.20 d (2.5) | 1.00 d (7.2) | |
| 12b | 4.73 d (1.6) | |||||
| 13 | 1.12 d (6.4) | 1.04 s | 1.69 s | |||
| 14 | 1.32 s | 1.38 s | 1.18 s | |||
| 15a | 1.05 d (7.2) | 1.06 d (7.2) | 3.96 dd (10.4, 1.6) | |||
| 15b | 3.62 dd (10.4, 1.6) | |||||
| 13-OCH3 | 3.68 s | |||||
| No. | 1 (CD3OD)c | 2 (CD3OD)a | 3 (CDCl3)c | 4 (CDCl3)b | 5 (CDCl3)c | 6 (CDCl3)c |
|---|---|---|---|---|---|---|
| δC | δC | δC | δC | δC | δC | |
| a Data were measured at 100 MHz (13C).b Data were measured at 125 MHz (13C).c Data were measured at 200 MHz (13C). | ||||||
| 1 | 158.6 | 143.3 | 46.4 | 32.9 | 86.4 | 82.5 |
| 2 | 127.7 | 206.8 | 82.5 | 26.2 | 37.0 | 36.8 |
| 3 | 39.1 | 44.7 | 38.9 | 30.3 | 29.3 | 30.4 |
| 4 | 41.8 | 34.3 | 51.7 | 43.6 | 35.8 | 34.7 |
| 5 | 44.5 | 178.1 | 38.8 | 39.6 | 55.9 | 52.9 |
| 6 | 36.7 | 39.9 | 35.9 | 38.6 | 18.3 | 36.7 |
| 7 | 79.8 | 77.6 | 73.4 | 72.5 | 42.9 | 198.7 |
| 8 | 84.6 | 217.1 | 75.3 | 203.5 | 203.6 | 125.4 |
| 9 | 40.2 | 64.7 | 30.1 | 124.6 | 126.2 | 164.1 |
| 10 | 73.4 | 42.5 | 33.8 | 172.0 | 155.5 | 19.1 |
| 11 | 50.1 | 45.9 | 146.1 | 51.2 | 22.6 | 14.9 |
| 12 | 181.7 | 171.1 | 110.3 | 24.6 | 15.8 | |
| 13 | 8.23 | 14.9 | 19.9 | 28.3 | ||
| 14 | 33.1 | 16.0 | 28.1 | 15.2 | ||
| 15 | 16.4 | 17.9 | 67.4 | 15.9 | ||
Compound 2 was isolated as colorless oil with specific optical rotation [α]20D −98.0 (c 0.1, MeOH). Its molecular formula was C15H24O2 based on the HRESI-TOF/MS ion peak at m/z 293.1380 [M + H]+ (calcd for C16H20O5, 293.1384), indicating seven degrees of unsaturation. The UV spectrum of 2 revealed the presence of conjugated carbonyl chromophores of absorption maxima at λmax 240 nm. The measured CD spectrum of 2 exhibited a negative cotton effect around 230 nm due to the n → π* transition of the ketone group. The 1H NMR spectrum of 2 showed the signals of one methine at δH 2.79 (H-4), three methylenes, three methyls [δH 1.38 (s, CH3-14), 1.06 (d, J = 7.2, CH3-15), and 1.04 (s, CH3-13)], and one methoxy at δH 3.68 (12-OCH3). The 13C NMR spectrum of 2 revealed the presence of 16 carbon signals, including two ketone groups at δC 217.1 (C-8) and 206.8 (C-2), one carbonyl (δC 171.1, C-12), one aliphatic methine carbon (δC 34.3 (C-4)), five non-protonated carbons (δC 178.1 (C-5), 143.3 (C-1), 77.6 (C-7), 64.7 (C-9), and 42.5 (C-10)), three methylene carbons (δC 45.9 (C-11), 44.7 (C-3), and 39.9 (C-6)), three methyls (δC 17.9, 16.0 and 14.9), and one methoxy group (δC 51.4). The afore-mentioned data suggested that 2 was a guaiane-type sesquiterpenoid. The 1H–1H COSY revealed the correlations of consecutive aliphatic protons of H2-3/H-4/H3-15 (Fig. 2). The key HMBC correlations were observed from H2-2 (δH 2.70, dd, J = 18.8, 6.4 Hz and 1.37, dd, J = 18.8, 1.2 Hz) to C-2/C-4/C-5/C-15, from H-4 and C-3/C-5/C-15, from H2-6 (δH 2.59, d, J = 14.4 Hz) to C-1/C-5/C-7/C-8/C-11, from H2-11 (δH 2.48, dd, J = 11.6, 1.2 Hz and 2.03, d, J = 11.6 Hz) to C-1/C-6/C-7/C-8/C-9/C-10/C-14, from H3-15 to C-3/C-4/C-5 (Fig. 2). In addition, the HMBC cross-peaks of CH3-13 with C-8, C-9, C-10, and C-12, and of H3-14 with C-1, C-9, C-10, and C-11, which exhibited the linkage of the carbon bridge between C-7 and C-10 and methylene group of CH2-11 on the bridge (Fig. 2). The 13C NMR and 1H NMR data of 2 were similar to those of chamaejasmone C11 except that the number of 13C NMR signals of 3 was 16 in total, while chamaejasmone C showed 15 13C signals. The main difference was that the methylene group at C-12 in chamaejasmone C changed to the acetyl group (δC 171.1, C-12) in 3. The relative configuration of 2 was assigned from the NOESY spectrum. The NOESY correlations between H3-15 and H-3b, H2-6, between H2-11 and H2-6, H3-14, suggested that these protons are the same β-orientation. The absolute configuration of 2 was assigned as 4R,7R,9S,10S by the comparison of calculated and experimental ECD spectra, as shown in Fig. 3. Thus, the structure of 2 was determined and named as chamaejasmone G.
Compound 3 win obtained as colorless oil with specific optical rotation [α]20D −73.0 (c 0.1, MeOH). Its positive HRESI-TOFMS spectral data exhibited the pseudomolecular ion peak at m/z 253.1790 [M + H]+, consistent with the molecular formula of C15H24O3 (calcd for C15H25O3, 237.1798), indicating four degrees of unsaturation. The 1H NMR spectrum of 3 showed six methylenes (including one oxymethylene and one terminal methylene), four methines, and two methyls (δH 1.69 s, H3-13 and 1.18 s, H3-14). The 13C NMR spectrum of 3 exhibited the presence of 15 carbon signals, including one olefinic carbon (δC 110.3, C-12), three non-protonated carbons (δC 146.1 (C-11), 73.4 (C-7), and 46.4 (C-1)), four aliphatic methine carbons (δC 82.5 (C-2), 75.3 (C-8), 51.7 (C-4), and 38.8 (C-5)), five methylene carbons (δC 67.4 (C-15), 38.9 (C-3), 35.9 (C-6), 33.8 (C-10), and 30.1 (C-9)), and two methyl groups (δC 28.1 (C-14) and 19.9 (C-13)). These data suggested that compound 3 was an isodaucane-type sesquiterpenoid. The 1H–1H COSY spectrum revealed the correlations of two-spin systems of H-2/H2-3/H-4/H-5/H2-6 and H-8/H2-9/H2-10. The key HMBC spectrum exhibited the correlations from H2-9 (δH 1.74 and 1.68) to C-1/C-7/C-8/C-10, from H2-10 (δH 2.10 and 1.56) to C-1/C-2/C-5/C-8/C-9/C-15, from H-2 (δH 4.00, dd, J = 9.6, 6.4 Hz) to C-4/C-10/C-15, from H2-3 (δH 1.96, ddd, J = 13.6, 8.8, 7.2 Hz and 1.80, ddd, J = 13.6, 9.6, 6.4 Hz) to C-1/C-2/C-4/C-5/C-11, from H-4 (δH 2.57) to C-3/C-5/C-6/C-12/C-13, from H2-6 (δH 1.85 and 1.53) to C-4/C-5/C-7/C-8/C-14, from H2-12 to C-4/C-11/C-13, from H3-13 to C-4/C-11/C-12, H3-14 to C-6/C-7/C-8 (Fig. 2). Furthermore, correlations were observed from H2-15 to C-1/C-5/C-7/C-10, which established the carbon bridge between C-1 to C-7 via oxymethylene C-15. The relative configuration of 3 was assigned from NOESY correlations. The cross-peak correlations were observed between H-4 and H-3a/H-3b/H-6b/H-11a/H2-12, between H-15a and H-3b/H-4/H-6b, suggested that these protons were on the same site β-orientation. The NOESY spectrum showed the correlations between H-2 and H-3a/H-6a/H-10b, indicated that these protons were on α-orientation. The absolute configuration of 3 were confirmed by comparison of the experimental and calculated ECD spectra data. The experimental ECD curve of 3 was identical with the calculated for (1S,2R,4R,5S,7S,8R) as shown in Fig. 3. Hence, compound 3 was identified and named as isodaucanranol A.
Compound 4 was isolated as colorless oil with specific optical rotation [α]20D −69.0 (c 0.07, MeOH). Its molecular formula was C15H24O2 based on the HRESI-TOF/MS ion peak at m/z 237.1839 [M + H]+ (calcd for C15H25O2, 237.1855), indicating four degrees of unsaturation. The 1H NMR data of 4 displayed signal resonances for an olefinic proton (δH 5.68, d, J = 2.0, H-9) and four methyls (δH 1.20, 1.19, 1.11 and 0.91). The 13C NMR spectrum (Table 2) revealed 15 carbon signals, including four methyls (δC 28.3 (C-13), 24.6 (C-12), 15.9 (C-8), and 15.2 (C-14)), four methylenes (δC 38.6 (C-6), 32.9 (C-1), 30.3 (C-3), and 26.2 (C-2)), three methines (one olefinic), and three non-protonated carbons (one oxygenated, one olefinic), and a ketone group (δC 203.5, C-8). The 1D NMR spectroscopic data closely resembled to those of neopetasane (12),12 an eremophilane sesquiterpene isolated from this plant. The main difference was that the terminal methylene in neopetasane was replaced by the methyl group in 4 and the presence of a hydroxyl group linked to C-7 in 4. The structure of 4 was elucidated by the HMBC correlations from H2-1 to C-2/C-3/C-9/C-10, H-6 to C-5/C-7/C-8/C-11/C-15; H-9 to C-1/C-5/, H-11 to C-6/C-7/C-8/C-12/C-13, H3-15 to C-4/C-5/C-6/C-10 as depicted in Fig. 2. In the NOESY spectrum, the correlations between H-11/H3-15/H3-14 revealed that these protons were on β-orientation, whereas H-4 and 7-OH were on the opposite site α-orientation. The absolute configuration of 4 was confirmed to be (4S,5R,7S) by comparison of ECD calculated values to experimental data (Fig. 3). Therefore, compound 4 was assigned as 7α-hydroxy-9(10)-ene-8-oxoeremophilane.
Compound 5 was obtained as a colorless oil. The molecular formula was elucidated from HRESI/TOF-MS as C12H18O2 based on the ion peak at m/z 217.1180 [M + Na]+ (calcd for C12H18O2Na, 217.1204). The 1H NMR spectrum (Table 1) displayed signals of an olefinic proton (δH 5.74, s), two methyl groups (δH 1.00 and 1.99). The 13C NMR spectrum presented 12 carbon signals including three non-protonated carbons (one carbonyl and one oxygenated carbon), three methines (δC 126.2 (C-9), 55.9 (C-5), and 35.8 (C-4)), four methylenes (δC 42.9 (C-7), 37.0 (C-2), 29.3 (C-3), and 18.3 (C-6)), and two methyls. The spectroscopic data of 5 closely resembled to those of phaeocaulisin J,13 a sesquiterpene isolated from Curcuma phaeocaulis and the difference from phaeocaulisin J was the absence of hydroxy group located at carbon C-4 in 5. The planar structure of 5 was assigned by the HMBC correlations from H3-12 to C-3/C-4/C-5, from CH3-11 to C-1/C-9/C-10, from H2-2 to C-1/C-3/C-4/C-5/C-9, from H-6 to C-1/C-4/C-5/C-7/C-8, and from H-9 to C-1/C-7/C-10/C-12 (Fig. 2). The relative configuration was solved by the NOESY correlations between H-4, H-5, and H3-12. The key NOESY correlations were observed between H-4/H-5, H-5/H6b/H-7b, indicated that CH3-12 was on β-orientation while H-4, H-5 were on α-orientation. The experimental ECD spectrum was highly consistent with the calculated for (1S,4S,5S) as shown in Fig. 3. Thus, the absolute configuration of 5 was identified as (1S,4S,5S)-1-hydroxy-4,10-dimethyl-hexahydro-azulen-8-one.
Compound 6 was isolated as a colorless oil, of which molecular formula was determined as C11H16O2 from the HRESI-TOF/MS by positive ion peak at m/z 181.1222 [M + H]+, (calcd for C11H17O2, 181.1229). The UV spectrum showed an absorption maximum at 235 nm, suggesting the presence of an α,β-unsaturated carbonyl moiety. The 1H NMR data (Table 1) of 6 exhibited the signals of an olefinic proton (δH 5.74, s), two methyl groups (δH 0.93 and 2.00). The 13C NMR (Table 2) and HSQC data of 6 showed 11 carbon signals including one ketone group (δC 198.7, C-7), one olefinic quaternary carbon (δC 164.1, C-9), one oxygenated carbon (δC 82.5, C-1), three methylenes (δC 36.8 (C-2), 36.7 (C-6), and 30.4 (C-3)), three methines (δC 125.4 (C-8), 52.9 (C-5) and 34.7, C-4), and two methyls (δC 19.1, C-10 and 14.9, C-11). The 1H–1H COSY spectrum revealed the existence of a spin coupling system of H2-2/H2-3/H-4/H-5/H2-6. Correlations were observed from H3-11 to C-3/C-4/C-5, H3-10 to C-1/C-8/C-9, H2-2 to C-1/C-3/C-4/C-5/C-9; H-5 to C-1/C-2/C-3/C-4/C-6/C-7, and H-8 to C-1/C-6/C-7/C-9/C-10 in HMBC spectrum (Fig. 2). The cross peaks were observed in the NOESY spectrum between H-4 and H-3b/H-5/CH3-11, CH3-11 and H-3a/H-4/H2-6. The absence of correlations between CH3-11 and H-5 suggested that H-3b, H-4 and H-5 are in α-orientation and that H-3a, CH3-11 are in β-orientation. The absolute configuration was determined based on the experimental ECD spectrum compared with the calculated of two possible enantiomers (Fig. 3). According to the empirical rule for α,β-unsaturated cyclohexanones, the negative cotton effect was observed at 244 nm due to the n – π* transition of ketone group (Fig. 3). Hence, the absolute configuration of 6 was (1S,4S,5S). Therefore, the structure of 6 was identified as (1S,4S,5S)-1-hydroxy-4,9-dimethyl-hexahydro-5H-inden-5-one.
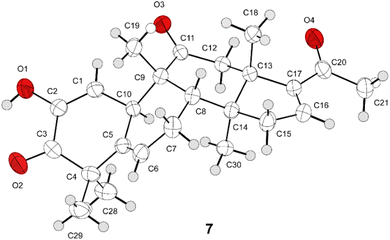
Compound 7 was isolated as a colorless needle, had a molecular formula of C24H30O4 determined from the ESI-TOF/MS by positive ion peak at m/z 383.2204 [M + H]+, with 10 degrees of unsaturation. Three olefinic protons, two aliphatic protons, and six methyl singlet signals were interpreted from 1H NMR spectrum (Table 3). The 13C NMR spectrum (Table 3) of 7 revealed the presence of 24 carbon resonances corresponding to three ketocarbonyl groups, one oxygen-bearing sp2 carbons, and three olefinic carbons. The remaining 17 carbons accounted for two methines, three methylenes, six methyls, and four quaternary carbons based on the HSQC experiment. The 1H and 13C data of 7 was identical to those of hexanorcucurbitacin I, isolated from Ecballium elaterium.14 The only difference from hexanorcucurbitacin I was the hydroxyl moiety at C-16 changed into a double bond Δ16,17 in 7, which was supported by the addition of one degree of unsaturation. The planar structure of 7 was identified by the 1H–1H COSY and HMBC spectral data (Fig. 2). The absolute configuration of 7 was established as (8S,9S,10R,13S,14S) by single-crystal X-ray diffraction analysis (Fig. 4). The structure of 7 was characterized as a rare hexanortriterpenoid derived from a cucurbitane-type triterpenoid, was named as 2-hydroxy-22,23,24,25,26,27-hexanorcucurbit-1,5,16-triene-3,11,20-trione.
| No. | 7 | |
|---|---|---|
| δC | δH mult (J in Hz) | |
| 1 | 115.4 | 6.11 d (2.4) |
| 2 | 144.5 | — |
| 3 | 198.7 | — |
| 4 | 47.5 | — |
| 5 | 136.5 | — |
| 6 | 120.2 | 5.73 dt (4.8, 2.4) |
| 7 | 23.4 | 2.44 ddt (19.6, 8.8, 2.4) |
| 2.03 ddd (19.6, 5.2, 2.4) | ||
| 8 | 40.6 | 2.29 m |
| 9 | 49.0 | — |
| 10 | 35.3 | 3.44 p (2.4) |
| 11 | 212.6 | — |
| 12 | 44.6 | 3.16 d (15.2) |
| 3.02 d (15.2) | ||
| 13 | 49.8 | — |
| 14 | 52.2 | — |
| 15 | 42.8 | 2.30 dt (16.8, 2.4) |
| 2.20 dd (16.8, 4.0) | ||
| 16 | 143.7 | 6.68 dd (4.0, 2.4) |
| 17 | 151.2 | — |
| 18 | 22.8 | 0.96 s |
| 19 | 20.9 | 1.09 s |
| 20 | 196.2 | — |
| 21 | 26.9 | 2.28 s |
| 28 | 27.5 | 1.19 s |
| 29 | 20.2 | 1.32 s |
| 30 | 19.0 | 1.16 s |
| 2-OH | 5.84 s | |
Nine known compounds were identified as baimuxinic acid (8),15 stelleraterpenoid B (9),16 dihydrocollumellarin (10),17 2-oxo-guaia-1(10),3,5,7(11),8-pentaen-12,8-olide (11),18 neopetasane (12),12 1,5-diphenyl-1-penten-3-one (13),19 1-hydroxy-1,5-diphenylpentan-3-one (14),20 1,5-diphenyl-3-pentanol (15),21 cucurbitacin E (16),22 by comparison of physical and spectroscopic data to those of reported in literature (Fig. 1). To the known compounds, 9–11 and 14–15 were first reported in Aquilaria genus.
Evaluation the neuro-inflammatory activities
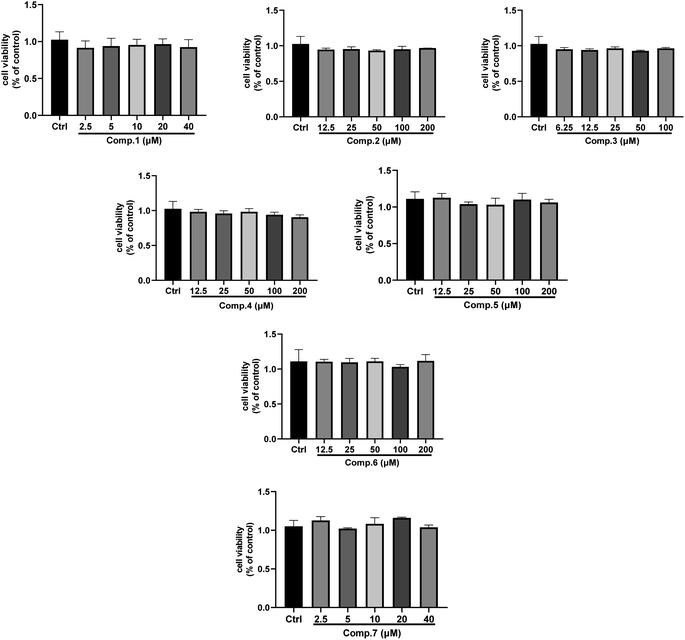
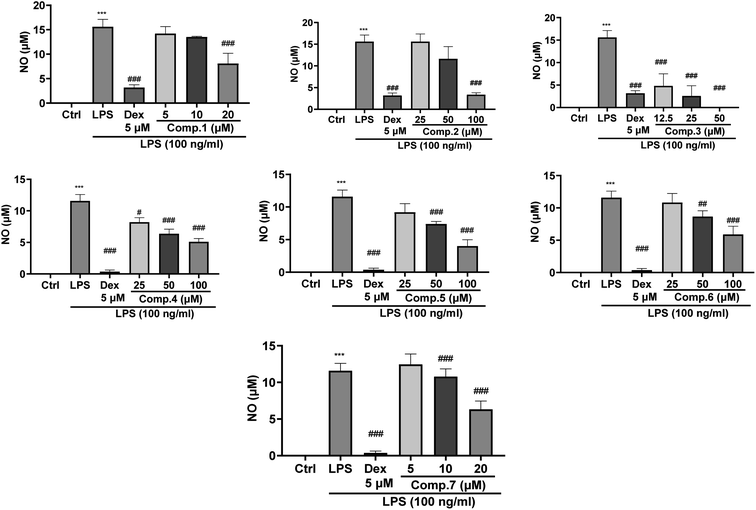
Seven previously undescribed compounds (1–7) were evaluated for their in vitro neuro-inflammatory effects against NO production in LPS-stimulated microglial BV-2 cells.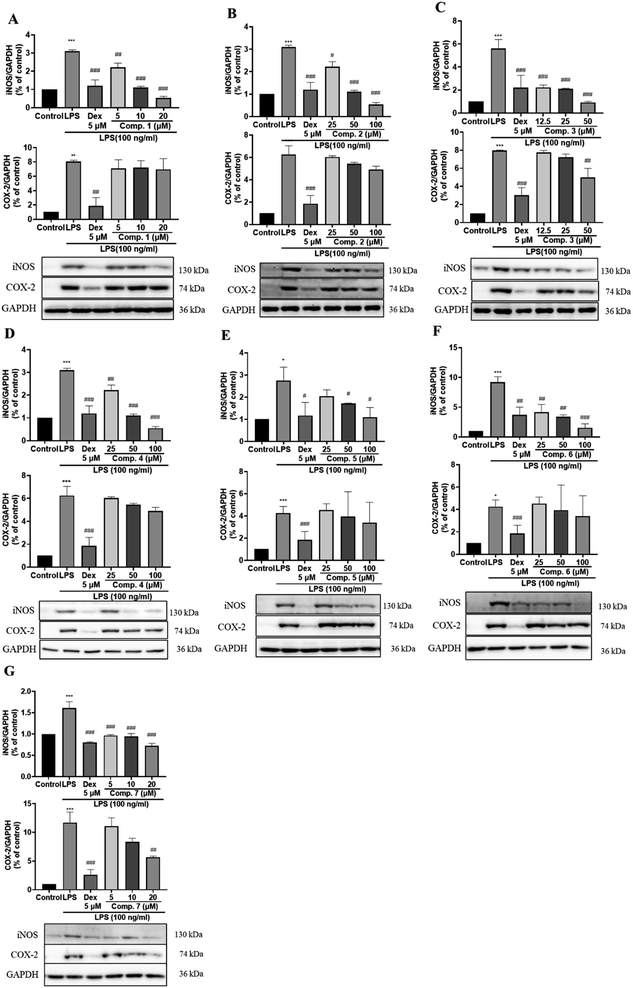 | ||
| Fig. 8 The expression of inflammatory enzymes iNOS and COX-2 by compounds 1–7 (A–G) on LPS-activated microglial cells. | ||
LPS in microglia and epithelial cells induce COX-2, leading to its expression. In acute inflammation, COX-2 plays a role in the generation of TNF-α. The inhibition of the COX-2 activation of A. malaccensis compounds was performed in LPS-induced BV-2 microglia cells. In the present study, 3 and 7 were the most effective compounds by significantly reducing COX-2 expression (Fig. 8C and G). Whereas compounds 1–2 (Fig. 8A and B), and 4–6 (Fig. 8D–F) were not found to be effective in COX-2 inhibition.
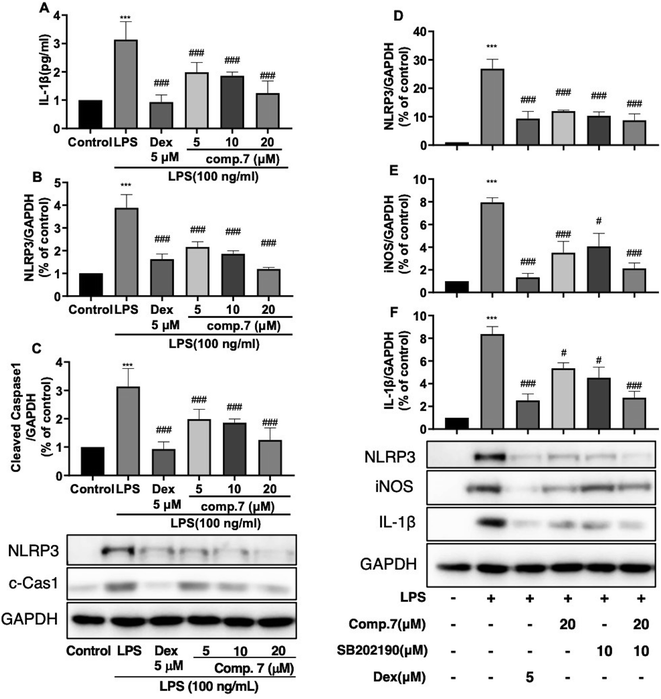
The STAT1/AKT pathway participates in neuro-inflammatory responses.23 To determine the effects of compound 7 on the LPS-activated STAT1/AKT/MAPK signaling pathway, BV2 cells were pre-treated with compound 7 for 1 h, followed by incubation with LPS for 24 h. LPS up-regulated the levels of p-STAT1, p-AKT, p-p38, p-JNK (Fig. 9), whereas the phosphorylation of these molecules was significantly suppressed by compound 7 during LPS stimulation. To the best of our knowledge, MAPK, PI3K/AKT, and STAT1 signaling are strongly integrated with microglia-induced neuroinflammation, which mainly stimulates inflammation via pro-inflammatory cytokines and marker release, apoptosis and oxidative stress.24 Both the PI3K/AKT and MAPK pathways increase the nuclear translocation of the important transcription factor NF-κB, causing downstream NLRP3 inflammasome activation and assemble.25 These results indicated that compound 7 regulated the LPS-induced neuro-inflammatory response by down-regulating the STAT1/AKT/MAPK pathway.
Conclusions
In summary, phytochemical investigation on agarwood chips from A. malaccensis led to the isolation of seven new compounds 1–7, along with eleven previously identified compounds. The precise structures of these undescribed compounds were elucidated using extensive NMR data. The absolute configurations of 1–6 were determined by experimental ECD spectral analysis in comparison with the calculated ECD spectra data, whereas the absolute configuration of 7 was assigned by single-crystal X-ray crystallographic analysis. Isodaucane-type sesquiterpenoid skeleton (3) was first reported from genus Aquilaria. All isolated compounds did not show any cytotoxicity in the two-fold of test concentrations. In vitro assays of neuro-inflammatory targets from the agarwood of A. malaccensis showed that compounds 1–7 intensively inhibited NO production in LPS-treated BV2 microglial cells. Investigation of the expression and secretion of TNF-α, a key proinflammatory factor showed that compounds 2 and 7 significantly decreased levels after treatment with LPS in dose-dependent manner. The suppression of enzymatic activations of iNOS and COX-2 were investigated to demonstrate the pharmacological activity of against LPS-induced neuro-inflammatory responses by western blot analysis. The results showed that compounds 1–7 significantly reduced the expression of iNOS and then decreased NO production, whereas only compounds 2 and 7 were the most effective by significantly reducing COX-2 expression in a dose-dependent manner. In the mechanistic study, compound 7 regulated the LPS-induced neuro-inflammatory response by down-regulating the STAT1/AKT/MAPK pathway and modulates inflammation via the MAPK/NLRP3 signaling pathway. Our findings revealed the potential beneficial effects of A. malaccensis compounds in modulating microglial activation in the neuro-inflammatory treatment strategies, which further suggests the usage of this herbal medicine in traditional medicine by the modern therapeutic evidence.Experimental section
General experimental procedures
Melting points were determined using a Mitamura Riken melting point apparatus (Japan). The optical rotations were measured on a JASCO P-2000 polarimeter (Japan) at 20 °C. IR spectrum was obtained from JASCO FT/IR 4200 (Japan). The ultraviolet (UV) and ECD spectra were measured on a Chirascan plus (Applied Photophysics Ltd, UK). NMR spectra were recorded on JEOL 400 (JEOL, JNM-ECZ400 s, Japan), Bruker AVANCE 500 MHz, and Bruker ASCENE (800 MHz) FT-NMR spectrometer (Germany); NMR solvents were purchased from Sigma-Aldrich (USA). HR-ESIMS were measured on an Agilent 6350 Q-TOF mass spectrometer (Agilent, USA). The X-ray crystallographic data were carried out on an Agilent SuperNova CCD detector system with Cu-Kα radiation (λ = 1.54184 Å). LC analyses were carried out using an Agilent 1260 infinity system (USA) with a Phenomenex Luna 100 RP-C18 (250 × 4.6 mm i.d., 5 μm) column equipped with autosampler, DAD, and column thermostat. Semi-preparative HPLC were performed using a Gilson 321 pump and Gilson UV/VIS-155 detector system (Gilson, Middleton, USA) with a Phenomenex Luna 100 RP-C18 (250 × 10 mm i.d., 5 μm) column, flowrate 2 mL min−1. Column chromatography was performed using silica gel 60 (0.040–0.063 mm; Merck, Germany) and Sephadex LH-20 (Amersham Bioscience AB, Uppsala, Sweden) as stationary phase. TLC was carried out on silica gel 60 F254 plates (Merck, Germany). All solvents used for isolation were purchased from Duksan pure chemical Co. (Gyeonggido, Korea). Solvents for HPLC were provided by J. T. Baker (USA).Reagents and antibodies
SB202190 (S706), dexamethasone (D2915), LPS (Escherichia coli, 0111:B4), dimethyl sulfoxide (DMSO), sulfanilamide, N-(1-naphthyl)ethylenediamine dihydrochloride, and sodium nitrite were bought from Sigma-Aldrich (St. Louis, MO, USA). All the primary antibodies including those against iNOS (#13120), COX-2 (#12282), dehydrogenase (GAPDH) (#2118), Akt (#4685), p-Akt (Ser473) (#4060), JNK (#4672), p-JNK (#4668), NLRP3 (#15101), cleaved caspase1 (#89332), IL-1β (#12703), p-STAT1 (#9167), STAT1 (#9172) as well as the anti-rabbit horseradish peroxidase (HRP)-linked IgG (#7074) antibodies were purchased from Cell Signaling Technology (Beverly, MA, USA).Plant material and isolation methods
The plant materials and separation methods used for the isolation and identification of A. malaccensis compounds are described in detail in the ESI.†![[thin space (1/6-em)]](https://www.rsc.org/images/entities/char_2009.gif) ε): 237 (1.69); ECD (MeOH) λmax (Δε): 229 (−12.3), 325 (−1.15); 1H NMR (400 MHz, CD3OD) and 13C NMR (100 MHz, CD3OD) data: see Tables 1 and 2; HRESI-MS m/z 293.1380 [M + H]+ (calcd for C16H20O5, 293.1384).
ε): 237 (1.69); ECD (MeOH) λmax (Δε): 229 (−12.3), 325 (−1.15); 1H NMR (400 MHz, CD3OD) and 13C NMR (100 MHz, CD3OD) data: see Tables 1 and 2; HRESI-MS m/z 293.1380 [M + H]+ (calcd for C16H20O5, 293.1384).![[thin space (1/6-em)]](https://www.rsc.org/images/entities/char_2009.gif) ε): 242 (3.34), 300 (2.01); ECD (MeOH) λmax (Δε): 240 (−53.2), 324 (6.99); 1H NMR (500 MHz, CDCl3) and 13C NMR (125 MHz, CDCl3) data: see Tables 1 and 2; HRESI-MS m/z 237.1839 [M + H]+ (calcd for C15H25O2, 237.1855).
ε): 242 (3.34), 300 (2.01); ECD (MeOH) λmax (Δε): 240 (−53.2), 324 (6.99); 1H NMR (500 MHz, CDCl3) and 13C NMR (125 MHz, CDCl3) data: see Tables 1 and 2; HRESI-MS m/z 237.1839 [M + H]+ (calcd for C15H25O2, 237.1855).![[thin space (1/6-em)]](https://www.rsc.org/images/entities/char_2009.gif) ε): 236 (2.79), 300 (2.80); ECD (MeOH) λmax (Δε): 220 (18.1), 274 (−0.43), 320 (−5.86); 1H NMR (800 MHz, CDCl3) and 13C NMR (200 MHz, CDCl3) data: see Tables 1 and 2; HRESI-MS m/z 217.1180 [M + Na]+ (calcd for C12H18O2Na, 217.1204).
ε): 236 (2.79), 300 (2.80); ECD (MeOH) λmax (Δε): 220 (18.1), 274 (−0.43), 320 (−5.86); 1H NMR (800 MHz, CDCl3) and 13C NMR (200 MHz, CDCl3) data: see Tables 1 and 2; HRESI-MS m/z 217.1180 [M + Na]+ (calcd for C12H18O2Na, 217.1204).![[thin space (1/6-em)]](https://www.rsc.org/images/entities/char_2009.gif) ε): 235 (2.91), 299 (3.16); ECD (MeOH) λmax (Δε): 215 (23.47), 244 (−20.99); 1H NMR (800 MHz, CDCl3) and 13C NMR (200 MHz, CDCl3) data: see Tables 1 and 2; HREIMS m/z 181.1222 [M + H]+, (calcd for C11H17O2, 181.1229).
ε): 235 (2.91), 299 (3.16); ECD (MeOH) λmax (Δε): 215 (23.47), 244 (−20.99); 1H NMR (800 MHz, CDCl3) and 13C NMR (200 MHz, CDCl3) data: see Tables 1 and 2; HREIMS m/z 181.1222 [M + H]+, (calcd for C11H17O2, 181.1229).![[thin space (1/6-em)]](https://www.rsc.org/images/entities/char_2009.gif) ε): 240 (2.69), 275 (2.68); 1H NMR (800 MHz, CDCl3) and 13C NMR (200 MHz, CDCl3) data: see Table 3; HRESI-MS m/z 383.2204 [M + Na]+, (calcd for C24H31O4, 383.2222).
ε): 240 (2.69), 275 (2.68); 1H NMR (800 MHz, CDCl3) and 13C NMR (200 MHz, CDCl3) data: see Table 3; HRESI-MS m/z 383.2204 [M + Na]+, (calcd for C24H31O4, 383.2222).X-ray crystallographic data analysis for 7
A suitable crystal was selected and measured on a SuperNova, Dual, Cu at zero, AtlasS2 diffractometer with Cu Kα radiation (χ = 1.54184 Å). The crystal was kept at suitable temperature (100 K) during data collection. Using Olex2,28 the structure was solved with the ShelXT29 structure solution program using Direct Methods and refined with the ShelXL30 refinement package using least squares minimization. Crystallographic data for compound 7 have been deposited at the Cambridge Crystallographic Data Centre (7: CCDC 2033830).Orthorhombic, C25H34O5 (M = 414.52 g mol−1); space group P212121 (no. 19), a = 10.0589(2) Å, b = 14.2921(3) Å, c = 15.1181(3) Å, V = 2173.43(8) Å3, Z = 4, T = 99.8(7) K, μ(CuKα) = 0.697 mm−1, Dcalc = 1.267 g cm−3, 21![[thin space (1/6-em)]](https://www.rsc.org/images/entities/char_2009.gif) 475 reflections measured (8.514 ≤ 2Θ ≤ 153.356), 4530 unique (Rint = 0.0390, Rsigma = 0.0242) which were used in all calculations. The final R1 was 0.0369 (I > 2σ(I)) and wR2 was 0.0987 (all data). Flack parameter = −0.01(8)
475 reflections measured (8.514 ≤ 2Θ ≤ 153.356), 4530 unique (Rint = 0.0390, Rsigma = 0.0242) which were used in all calculations. The final R1 was 0.0369 (I > 2σ(I)) and wR2 was 0.0987 (all data). Flack parameter = −0.01(8)
Computational analysis and ECD calculations
All of the conformers of 1–6 in this study were searched using the MacroModel (version 2023-3, Schrödinger LLC) module with ‘Mixed torsional/Low-mode sampling’ in the MMFF force field. The conformational search was implemented in the gas phase with 50 kJ mol−1 energy window limit and 10![[thin space (1/6-em)]](https://www.rsc.org/images/entities/char_2009.gif) 000 maximum number of steps were set to explore the potential conformers. The Polak–Ribiere Conjugate Gradient (PRCG) method was utilized to minimize conformers with 10
000 maximum number of steps were set to explore the potential conformers. The Polak–Ribiere Conjugate Gradient (PRCG) method was utilized to minimize conformers with 10![[thin space (1/6-em)]](https://www.rsc.org/images/entities/char_2009.gif) 000 iterations and a 0.001 kJ (mol Å)−1 convergence threshold on the Root Mean Square (RMS) gradient. From that search, the proposed conformers were selected within 20 kJ mol−1 in the MMFF force field and they were all subjected to geometry optimization using Tmolex 2023 (BIOVIA) with the density functional theory settings at B3-LYP/6-31G(d,p)
000 iterations and a 0.001 kJ (mol Å)−1 convergence threshold on the Root Mean Square (RMS) gradient. From that search, the proposed conformers were selected within 20 kJ mol−1 in the MMFF force field and they were all subjected to geometry optimization using Tmolex 2023 (BIOVIA) with the density functional theory settings at B3-LYP/6-31G(d,p)
The ECD calculations for the possible conformers were performed at an identical theoretical level and basis sets. The calculated ECD spectra were simulated and superimposing each transition, where σ is the bandwidth at height 1/e and ΔEi and Ri are the excitation energy and rotatory strength for transition i, respectively. In this study, the value of σv was 0.2 eV. Boltzmann-averaged based on the calculated Gibbs free energy of each conformer can be found in the ESI† and ECD visualization was performed on GraphPad Prism 8.0 (GraphPad Software, San Diego, CA, USA).
Cell culture experiment
The BV-2 mouse microglia cell line was obtained from the Prof. Lee Sung Jung's research team in College of Medicine, Seoul National University and was cultured in Dulbecco's modified Eagle medium (DMEM; Welgene, South Korea), medium added with 10% fetal bovine serum (FBS; Thermo Fisher Scientific Inc., Lafayette, CA, U.S.A.) and 1% penicillin (Lonza, MD, USA) at 37 °C under a humidified atmosphere containing 5% CO2.![[thin space (1/6-em)]](https://www.rsc.org/images/entities/char_2009.gif) 000 rpm for removal of dead cells. The supernatant medium was collected and mixed with an equal volume (50 μl) of Griess reagents (1% sulfanilamide and N-(1-naphthyl) ethylenediamine dihydrochloride in 2.5% H3PO4) for 10 min incubating under room temperature, and nitric oxide concentration was measured by sodium nitrite standard curve at 540 nm using a microplate reader.
000 rpm for removal of dead cells. The supernatant medium was collected and mixed with an equal volume (50 μl) of Griess reagents (1% sulfanilamide and N-(1-naphthyl) ethylenediamine dihydrochloride in 2.5% H3PO4) for 10 min incubating under room temperature, and nitric oxide concentration was measured by sodium nitrite standard curve at 540 nm using a microplate reader.![[thin space (1/6-em)]](https://www.rsc.org/images/entities/char_2009.gif) 000 rpm for 5 min to remove the dead cell. And after discarding the supernatant, the collected cells were lysed with PRO-PREP protein extraction buffer (iNtRON, Gyeonggi, Republic of Korea) supplemented with PIC set III (Sigma-Aldrich, St. Louis, MO, U.S.A.) for 20 min incubation under 4 °C. The lysates were centrifuged (13
000 rpm for 5 min to remove the dead cell. And after discarding the supernatant, the collected cells were lysed with PRO-PREP protein extraction buffer (iNtRON, Gyeonggi, Republic of Korea) supplemented with PIC set III (Sigma-Aldrich, St. Louis, MO, U.S.A.) for 20 min incubation under 4 °C. The lysates were centrifuged (13![[thin space (1/6-em)]](https://www.rsc.org/images/entities/char_2009.gif) 000 rpm) for 20 min. The quantification of protein was conducted with BCA protein assay kit (Thermo Fisher Scientific Inc., Lafayette, CA, U.S.A). Western blot loading samples were prepared with lysate and an equal volume of 2× NuPAGE LDS sample buffer (Thermo Fisher Scientific, Inc., Lafayette, CA, U.S.A.) with 10% 2-mercaptoethanol and stored at −80 °C until assay.
000 rpm) for 20 min. The quantification of protein was conducted with BCA protein assay kit (Thermo Fisher Scientific Inc., Lafayette, CA, U.S.A). Western blot loading samples were prepared with lysate and an equal volume of 2× NuPAGE LDS sample buffer (Thermo Fisher Scientific, Inc., Lafayette, CA, U.S.A.) with 10% 2-mercaptoethanol and stored at −80 °C until assay.Author contributions
Chi Thanh Ma: conceptualization, data curation, formal analysis, investigation, methodology, validation, visualization, writing – original draft, writing – review & editing. Tianqi Huang: data curation, formal analysis, investigation, methodology, validation, writing – original draft. Jae Sik Yu: data curation, formal analysis, investigation, methodology, software, validation, writing – original draft, writing – review & editing. Tu Loan Ly: conceptualization, investigation, project administration, resources. Kim Long Vu Huynh: methodology, project administration, resources. Sung Won Kwon: investigation, resources, supervision. Jeong Hill Park: investigation, resources, supervision. Hyun Ok Yang: conceptualization, project administration, supervision, writing – review & editing.Conflicts of interest
The authors declare that they have no known competing financial interests or personal relationships that could have appeared to influence the work reported in this paper.Acknowledgements
This research was supported by the Rural Development Administration of Korea (PJ017031 & PJ017076) and by the Ministry of Science, ICT, and Future Planning through the National Research Foundation of Korea (2019K1A3A1A05088041). This work was also supported by a grant of Vietnam National Foundation for Science and Technology Development (NAFOSTED) (grant number 108.05–2019.07).References
- H. S. Kwon and S. H. Koh, Neuroinflammation in neurodegenerative disorders: the roles of microglia and astrocytes, Transl. Neurodegener., 2020, 9, 42 CrossRef PubMed.
- S. Mandrekar-Colucci and G. E. Landreth, Microglia and inflammation in Alzheimer's disease, CNS Neurol. Disord.: Drug Targets, 2010, 9, 156–167 CrossRef CAS PubMed.
- C. S. Subhramanyam, C. Wang, Q. Hu and S. T. Dheen, Microglia-mediated neuroinflammation in neurodegenerative diseases, Semin. Cell Dev. Biol., 2019, 94, 112–120 CrossRef CAS PubMed.
- U. K. Hanisch, Microglia as a source and target of cytokines, Glia, 2002, 40, 140–155 CrossRef PubMed.
- M. B. Graeber, W. Li and M. L. Rodriguez, Role of microglia in CNS inflammation, FEBS Lett., 2011, 585, 3798–3805 CrossRef CAS PubMed.
- R. Fürst and I. Zündorf, Plant-derived anti-inflammatory compounds: hopes and disappointments regarding the translation of preclinical knowledge into clinical progress, Mediat. Inflamm., 2014, 2014, 146832 Search PubMed.
- Q. Zhao, L. Zhu, S. Wang, Y. Gao and F. Jin, Molecular mechanism of the anti-inflammatory effects of plant essential oils: A systematic review, J. Ethnopharmacol., 2022, 301, 115829 CrossRef PubMed.
- L. Qin, X. Wu, M. L. Block, Y. Liu, G. R. Breese, J. S. Hong, D. J. Knapp and F. T. Crews, Systemic LPS causes chronic neuroinflammation and progressive neurodegeneration, Glia, 2007, 55, 453–462 CrossRef PubMed.
- N. Marliani, A review: Aquilaria species as potential of pharmacological, OISAA Journal of Indonesia Emas, 2021, 4, 49–53 CrossRef.
- M. A. Eissa, Y. Z. H. Y. Hashim, S. S. S. Abdul Azziz, H. M. Salleh, M. L. M. Isa, N. M. Abd Warif, F. Abdullah, E. Ramadan and D. M. El-Kersh, Phytochemical Constituents of Aquilaria malaccensis Leaf Extract and Their Anti-Inflammatory Activity against LPS/IFN-γ-Stimulated RAW 264.7 Cell Line, ACS Omega, 2022, 7, 15637–15646 CrossRef CAS PubMed.
- L.-R. Qiao, L. Yang, J.-H. Zou, L. Li, H. Sun, Y.-K. Si, D. Zhang, X. Chen and J. Dai, Neolignans and sesquiterpenes from cell cultures of Stellera chamaejasme, Planta Med., 2012, 78, 711–719 CrossRef CAS PubMed.
- M. Ishihara, T. Tsuneya and K. Uneyama, Fragrant sesquiterpenes from agarwood, Phytochemistry, 1993, 33, 1147–1155 CrossRef CAS.
- Y. Liu, J. Ma, Q. Zhao, C. Liao, L. Ding, L. Chen, F. Zhao and F. Qiu, Guaiane-type sesquiterpenes from Curcuma phaeocaulis and their inhibitory effects on nitric oxide production, J. Nat. Prod., 2013, 76, 1150–1156 CrossRef CAS PubMed.
- M. M. Rao, H. Meshulam and D. Lavie, The constituents of Ecballium elaterium L. Part XXIII. Cucurbitacins and hexanorcucurbitacins, J. Chem. Soc., Perkin Trans., 1974, 1, 2552–2556 RSC.
- J. Yang and Y. Chen, Studies on the constituents of Aquilaria sinensis (Lour.) Gilg. I. Isolation and structure elucidation of two new sesquiterpenes, baimuxinic acid and baimuxinal, Acta Pharm. Sin., 1983, 18, 191–198 CAS.
- Z.-Y. Cheng, Z.-L. Hou, J.-X. Ren, D.-D. Zhang, B. Lin, X.-X. Huang and S.-J. Song, Guaiane-type sesquiterpenoids from the roots of Stellera chamaejasme L. and their neuroprotective activities, Phytochemistry, 2021, 183, 112628 CrossRef CAS PubMed.
- D. J. Brecknell and R. M. Carman, Callitrin, callitrisin, dihydrocallitrisin, columellarin and dihydrocolumellarin, new sesquiterpene lactones from the heartwood of Callitris columellaris, Tetrahedron Lett., 1978, 19, 73–76 CrossRef.
- B. Alpertunga, S. Imre, H. J. Cowe, P. J. Cox and R. H. Thomson, A photo artefact from linderazulene, Tetrahedron Lett., 1983, 24, 4461–4462 CrossRef CAS.
- D. S. Hays, M. Scholl and G. C. Fu, Organotin Hydride-Catalyzed Conjugate Reduction of α, β-Unsaturated Ketones, J. Org. Chem., 1996, 61, 6751–6752 CrossRef CAS PubMed.
- B. Wu, J. G. Lee, C. J. Lim, S. D. Jia, S. W. Kwon, G. S. Hwang and J. H. Park, Sesquiterpenoids and 2-(2-Phenylethyl)-4H-chromen-4-one (=2-(2-Phenylethyl)-4H-1-benzopyran-4-one) derivatives from Aquilaria malaccensis Agarwood, Helv. Chim. Acta, 2012, 95, 636–642 CrossRef CAS.
- G. S. Hamilton, J.-H. Li and J. P. Steiner, Method of using neurotrophic sulfonamide compounds, US Pat., US005721256A, 1998 Search PubMed.
- C. Seger, S. Sturm, M. E. Mair, E. P. Ellmerer and H. Stuppner, 1H and 13C NMR signal assignment of cucurbitacin derivatives from Citrullus colocynthis (L.) Schrader and Ecballium elaterium L. (Cucurbitaceae), Magn. Reson. Chem., 2005, 43, 489–491 CrossRef CAS PubMed.
- N. Suganthy, K. P. Devi, S. F. Nabavi, N. Braidy and S. M. Nabavi, Bioactive effects of quercetin in the central nervous system: Focusing on the mechanisms of actions, Biomed. Pharmacother., 2016, 84, 892–908 CrossRef CAS PubMed.
- J. Liu, H. Li, T. Gong, W. Chen, S. Mao, Y. Kong, J. Yu and J. Sun, Anti-neuroinflammatory Effect of Short-Chain Fatty Acid Acetate against Alzheimer's Disease via Upregulating GPR41 and Inhibiting ERK/JNK/NF-κB, J. Agric. Food Chem., 2020, 68, 7152–7161 CrossRef CAS PubMed.
- C. Ju Hwang, D.-Y. Choi, H. M. Park and T. J. Hong, NF-kB as a Key Mediator of Brain Inflammation in Alzheimer's Disease, CNS Neurol. Disord.: Drug Targets, 2019, 18, 3–10 CrossRef PubMed.
- T. K. Motawi, S. A. El-Maraghy, A. S. Kamel, S. E. Said and M. A. Kortam, Modulation of p38 MAPK and Nrf2/HO-1/NLRP3 inflammasome signaling and pyroptosis outline the anti-neuroinflammatory and remyelinating characters of Clemastine in EAE rat model, Biochem. Pharmacol., 2023, 209, 115435 CrossRef CAS PubMed.
- T. Lawrence, The nuclear factor NF-kappaB pathway in inflammation, Cold Spring Harbor Perspect. Biol., 2009, 1, a001651 Search PubMed.
- O. V. Dolomanov, L. J. Bourhis, R. J. Gildea, J. A. K. Howard and H. Puschmann, OLEX2: a complete structure solution, refinement and analysis program, J. Appl. Crystallogr., 2009, 42, 339–341 CrossRef CAS.
- G. Sheldrick, SHELXT - Integrated space-group and crystal-structure determination, Acta Crystallogr., Sect. A, 2015, 71, 3–8 CrossRef PubMed.
- G. Sheldrick, Crystal structure refinement with SHELXL, Acta Crystallogr., Sect. A, 2015, 71, 3–8 CrossRef PubMed.
- D. Zhao, M. Y. Gu, J. L. Xu, L. J. Zhang, S. Y. Ryu and H. O. Yang, Anti-neuroinflammatory effects of 12-dehydrogingerdione in LPS-activated microglia through inhibiting AKT/IKK/NF-κb pathway and activating Nrf-2/HO-1 pathway, Biomol. Ther., 2019, 27, 92–100 CrossRef CAS PubMed.
Footnotes |
| † Electronic supplementary information (ESI) available: Detailed experimental procedure, 1D and 2D NMR, IR, [α]20D, UV, ECD, MS spectra data of 1–7 are included herein. X-ray crystallography data for 7 (CIF). CCDC 2033830. For ESI and crystallographic data in CIF or other electronic format see DOI: https://doi.org/10.1039/d3ra08686k |
| ‡ These authors contributed equally. |
| This journal is © The Royal Society of Chemistry 2024 |

