DOI:
10.1039/D3RA08790E
(Paper)
RSC Adv., 2024,
14, 11677-11693
Second phase Cu2O boosted photocatalytic activity of fluorine doped CuO nanoparticles
Received
23rd December 2023
, Accepted 30th March 2024
First published on 11th April 2024
Abstract
The photocatalytic activity of fluorine (F) doped CuO nanoparticles (NPs) prepared employing modified sol–gel process was investigated here in this study. Structural and elemental characterization using XRD and XPS data confirmed successful incorporation of F as dopant. F doping led to lattice distortion and reduced crystallinity with smaller crystallite size while promoting the emergence of Cu2O as the second phase. Morphological analysis showed irregularly shaped, fused particles with a decreasing particle size trend upon doping. Addition of hydrogen peroxide generated hydroxyl radicals (OH˙) under ultra-violet (UV) light, which effectively degrades pollutants by facilitating the photocatalytic kinetics. Photocatalytic activity of all the nanoparticles was examined against Rhodamine B (Rh B) dye and most efficient degradation (97.78%) was observed for 3 mol% F dopant concentration. The emergence of Cu2O phase for doping beyond 1 mol% F doped CuO might be the prime reason to enhance its degradation performance. Conversely, 5 mol% doping caused notable phase changes and decreased degradation rate (88.05%) due to increased recombination rate in presence of metallic copper. The ability of F doped CuO nanoparticles to disintegrate organic contaminants by producing reactive oxygen species when exposed to UV light suggests their potential effectiveness in applications such as dye degradation, water purification, and environmental sustainability.
Introduction
One prevalent form of pollution found in wastewater is dyes, which are produced by several industries, most notably those involved in the manufacture of paper, leather, and textiles. Wastewater containing dyes is hazardous to the ecosystem and human health due to its toxicity. Therefore, implementation of effective wastewater management practice is crucial for public health protection and environmental preservation. Advanced Oxidation Processes (AOPs) are specialized chemical treatments used in wastewater treatment to break down stubborn contaminants.1,2 In order to speed up the breakdown of pollutants in wastewater, particularly in photocatalytic processes, nanoparticles can be incorporated into AOPs for more effective and efficient wastewater treatment3
Metal oxide nanostructures have shown excellent aptitude to the environmental sectors. For instance, when exposed to ultraviolet (UV) light, nanoparticles act as photo catalysts, efficiently breaking down organic pollutants and sanitizing water.4,5 Modern air filtration systems are incorporated with nanostructured metal oxides as they adsorb or chemically react with harmful gases and particulate matter resulting in enhanced air quality.6 These nanoparticles are also useful for soil and groundwater purification due to their adsorbing or catalytic properties to degrade pollutants like organic chemicals and textile dyes. Among such nanoparticles,7–9 narrow band gap p-type CuO semiconductor materials are considered as potential photocatalysts. The selection of CuO among all metal oxide semiconductors is contingent upon particular demands of the intended application, however, CuO NPs are often suitable for preferentially absorbing visible light due to narrower bandgap along with its non-toxic nature.10
Size, shape, and morphology of the nanostructures control various properties tailoring their final performance, and interestingly, these parameters are highly dependent on the synthesis route.11 Various synthesis routes like sol–gel, chemical precipitation, hydrothermal methods, etc. are adopted to produce nano structures, especially metal oxide nanoparticles (NPs).12–14 Among these, the wet chemical sol–gel route is considered to be a useful approach as it offers several advantages, including control over particle size, homogeneity, high purity, versatility, low-temperature synthesis, and scalability providing better control over its properties.15–19 Here, photocatalytic activity of the CuO NPs synthesized via sol–gel route has been explored from photocatalytic degradation of Rhodamine B (Rh B).20 Photocatalytic degradation uses semiconductor nanoparticles to generate reactive oxygen species (ROS), which oxidize pollutants and break them down into harmless byproducts. This approach offers eco-friendly applications in pollution control and water purification.21
Apart from selecting a proper synthesis route, to enhance any specific properties of NPs, doping has proven to be a very effective way.22,23 For any metal oxide nanoparticles, non-metals are very potent doping agents which modify the band gap and electronic properties, and also for tailoring optical and magnetic responses and to incorporate fluoride ions in CuO NPs, NH4F was utilized as it controls doping concentration, enhances reactivity, and stabilizes particle formation, influencing band gap, and catalytic activity.24 Fluorine (F) can either operate as a donor or an acceptor. Due to CuO's variable oxidation states which allow for both electron and hole production, depending on synthesis route, second phase Cu2O may appear on doping due to the oxidation tendency of the dopant like F.25
In a recent study, authors have reported significantly altered magnetic properties as CuO NPs were doped with F generating defect states and forming second phase Cu2O.24 However, the effect of F doping in CuO on photocatalytic degradation is yet to be explored, and no such work has been reported to the best of the authors' knowledge so far. Considering these factors, the present study focuses on the photocatalytic activity of the doped nanoparticles, which allows to disintegrate organic contaminants generating reactive oxygen species when exposed to light. The findings support the candidacy of F doped CuO NPs as an effective reagent in the field of dye degradation, water purification and environmental sustainability.
Experimental
Materials
To synthesize nanoparticles following modified sol–gel method the high purity (>99%) reagents used were copper nitrate trihydrate, Cu(NO3)2·3H2O (Sigma-Aldrich), ammonium fluoride, NH4F (Sigma-Aldrich), citric acid C6H8O7 (Sigma-Aldrich), deionized (DI) water and ethylene glycol, C2H6O2. They were included as the precursor solution, dopant, chelating agent, solvent, and chain transfer agent, respectively. All the reagents were used in their as-received state without undergoing further purification.
Synthesis of nanoparticles
Scheme 1 demonstrates the schematic diagram for CuO NPs synthesis by modified sol–gel route. Here, 0.3 M precursor solution was prepared in 70 mL of DI water while being agitated continuously at 400 rpm, controlling solution temperature at 80 °C. After that, citric acid was added at a molar ratio of 2![[thin space (1/6-em)]](https://www.rsc.org/images/entities/char_2009.gif) :
:![[thin space (1/6-em)]](https://www.rsc.org/images/entities/char_2009.gif) 1 to the copper precursor. To get 1, 3 and 5 mol% F doped NPs, 0.0077 g, 0.023 g, and 0.038 g of NH4F were added to the precursor, respectively, following a period of 30 minutes of continuous stirring. Ethylene glycol was added as a chain transfer agent at a molar ratio of 6
1 to the copper precursor. To get 1, 3 and 5 mol% F doped NPs, 0.0077 g, 0.023 g, and 0.038 g of NH4F were added to the precursor, respectively, following a period of 30 minutes of continuous stirring. Ethylene glycol was added as a chain transfer agent at a molar ratio of 6![[thin space (1/6-em)]](https://www.rsc.org/images/entities/char_2009.gif) :
:![[thin space (1/6-em)]](https://www.rsc.org/images/entities/char_2009.gif) 1 to copper precursor and a dense gel was formed after 3 hours of stirring. Later, the solution was kept into the oven for 20 hours in a crucible for drying at 120 °C followed by grinding for production of finely powdered substance. The annealing process at 700 °C was followed for 1 hour to get the fluorine doped CuO NPs.
1 to copper precursor and a dense gel was formed after 3 hours of stirring. Later, the solution was kept into the oven for 20 hours in a crucible for drying at 120 °C followed by grinding for production of finely powdered substance. The annealing process at 700 °C was followed for 1 hour to get the fluorine doped CuO NPs.
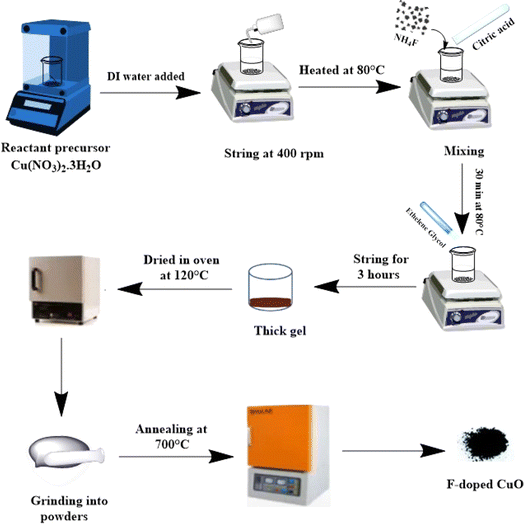 |
| | Scheme 1 Schematic diagram of synthesized CuO NPs. | |
Characterization
X-ray powder diffraction (XRD) patterns of the annealed nanoparticles were acquired to conduct structural and phase analysis using Rigaku Smart lab® SE diffractometer. Cu Kα1 with a wavelength of 0.1540598 nm was used following a scanning rate of 5° min−1 in 2θ = 20–80° ranges for all the diffraction spectra. For measuring crystallinity, crystallite size, strain, dislocation density, and lattice parameters Origin-Pro software was used. For morphological and structural analysis high resolution transmission electron microscopy (HRTEM) was carried out using Talos F200X TEM, Thermo Fisher Scientific, USA, X-ray photoelectron spectroscopy (XPS) was used to study chemical composition of the nanoparticles. Energy-dispersive X-ray spectroscopy (EDS) mapping and surface morphology were further studied using FE-SEM: JEOL, JSM, 7600F. Particle size information was studied using ImageJ and Origin-pro. To record the transmittance and absorbance spectra a ultra-violet visible (UV-vis) spectrometer from PerkinElmer Lambda 365 was used, and from Tauc plot indirect band gap was estimated. Presence of any functional group was verified by Fourier-transform infrared spectroscopy (FT-IR) using Nicolet™ iS20 FTIR spectrometer.
Photocatalytic activity
To assess the photocatalytic efficacy synthesized nanoparticles were taken into a 25 mL 5 ppm Rh B solution. The solution mixture was placed into a dark box and kept there for 30 minutes stirring at a speed of 400 rpm. Mixing was done thoroughly to get the adsorption–desorption equilibria of the dye on nanoparticle surface. After 30 min, just before turning UV light on, H2O2 was added to the mixture to promote the catalytic property of the nanoparticles. After specified time of irradiation, 3 mL of supernatant liquids was subjected to filtration.26 The absorbance intensity of the Rh B was recorded at 30 minutes time intervals for 3 hours and degradation efficiency was determined following eqn (1).27| |
 | (1) |
where, A0 and C0 are initial absorbance and concentration of Rh B dye and A and C are absorbance and concentration of Rh B dye after certain time. Subsequently, scavenger tests were performed to comprehend the active species involved in the degradation reaction of Rh B in the presence of 3 mol% CuO NPs.28
Results and discussion
Phase study and structural analysis
Synthesized nanoparticles were examined by XRD diffraction technique (Fig. 1). XRD peaks for the planes (110), (11![[1 with combining macron]](https://www.rsc.org/images/entities/char_0031_0304.gif) ), (111), (
), (111), (![[2 with combining macron]](https://www.rsc.org/images/entities/char_0032_0304.gif) 02), (020), (202), (
02), (020), (202), (![[1 with combining macron]](https://www.rsc.org/images/entities/char_0031_0304.gif) 13), (
13), (![[3 with combining macron]](https://www.rsc.org/images/entities/char_0033_0304.gif) 11), (220), (311) and (
11), (220), (311) and (![[2 with combining macron]](https://www.rsc.org/images/entities/char_0032_0304.gif) 22) were observed at 2θ values 32.636, 35.65, 38.85, 48.89, 53.43, 58.29, 61.65, 66.39, 68.16, 72.38, and 75.12, respectively, are in complete accord with JCPDS card no. 05-0661.24,29 All the nanoparticles showed diffraction patterns corresponding to the tenorite phase of copper oxide with a monoclinic structure. No diffraction peak was detected for fluorine-based phases or compounds like CuF and CuF2. This indicates either complete incorporation of fluorine in the crystal lattice or insignificant content of any fluorine-based compound below detection limit.30 Formation of cuprite (Cu2O) phase and metallic copper was evident from XRD patterns for higher mole percentage of dopant. XRD peaks for (020), (111) and (011) planes at 2θ values 42.23, 36.25 and 29.45 respectively, confirmed the presence of Cu2O phase with a cubic structure. Peaks for (111) and (200) planes at 2θ values 43.37 and 50.47 confirmed the presence of metallic copper, which was only detectable for 5 mol% doping. It can be explained in a way that on substitution of O2− ion by F− ion, a free electron is generated and readily transferred to Cu2+ ion resulting in its reduction into Cu+ ion in the second phase Cu2O.24 In addition to the formation of Cu2O for 3 and 5 mol% doping, continued reduction proceeded to the formation of metallic copper for 5 mol% dopant concentration. Crystallite size (D) was measured from Scherrer's formula,31
22) were observed at 2θ values 32.636, 35.65, 38.85, 48.89, 53.43, 58.29, 61.65, 66.39, 68.16, 72.38, and 75.12, respectively, are in complete accord with JCPDS card no. 05-0661.24,29 All the nanoparticles showed diffraction patterns corresponding to the tenorite phase of copper oxide with a monoclinic structure. No diffraction peak was detected for fluorine-based phases or compounds like CuF and CuF2. This indicates either complete incorporation of fluorine in the crystal lattice or insignificant content of any fluorine-based compound below detection limit.30 Formation of cuprite (Cu2O) phase and metallic copper was evident from XRD patterns for higher mole percentage of dopant. XRD peaks for (020), (111) and (011) planes at 2θ values 42.23, 36.25 and 29.45 respectively, confirmed the presence of Cu2O phase with a cubic structure. Peaks for (111) and (200) planes at 2θ values 43.37 and 50.47 confirmed the presence of metallic copper, which was only detectable for 5 mol% doping. It can be explained in a way that on substitution of O2− ion by F− ion, a free electron is generated and readily transferred to Cu2+ ion resulting in its reduction into Cu+ ion in the second phase Cu2O.24 In addition to the formation of Cu2O for 3 and 5 mol% doping, continued reduction proceeded to the formation of metallic copper for 5 mol% dopant concentration. Crystallite size (D) was measured from Scherrer's formula,31| |
 | (2) |
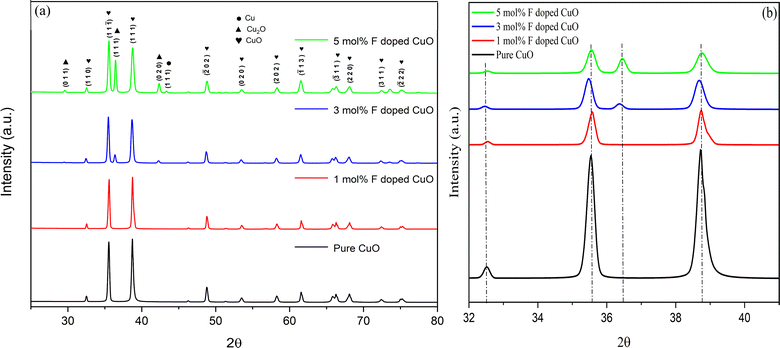 |
| | Fig. 1 (a) XRD spectra of pure and doped CuO NPs and (b) peak shift after doping. | |
The relationship between D and the wavelength of Cu Kα1 is given by the formula where β represents full width at half maximum (FWHM) of the diffraction peak and θ is the Bragg angle. A gradual decrease in both crystallinity and crystallite size was observed with increasing amount of dopant concentration (Table 1). Lattice disorder was induced due to the size difference between dopant fluorine atom and oxygen in CuO lattice, which engendered lower crystallinity. Again, reduced crystallite size can be attributed to the formation of Cu–F–Cu instead of Cu–O–Cu sequence resulting in hindrance of the crystal growth.24,32 Dislocation density and micro-strain was estimated from the eqn (3) and (4) using XRD data where δ and ε represent dislocation density and micro-strain, respectively. Micro-strain and dislocation density were increased with increasing dopant concentration due to ionic size mismatch between fluorine (dopant) and oxygen (host) atom. The shift in XRD peaks of fluorine doped CuO NPs, which is shown in Fig. 1(b), can be attributed to dopant-induced lattice distortions as well as formation of defects and strains.33 At 3% doping, the presence of fluorine exerts greater influence resulting in an increase in interplanar spacing or a shift towards lower angles, validating the analysis performed by HRTEM.
| |
 | (3) |
| |
 | (4) |
Table 1 Structural analysis of XRD spectra
| Sample |
Crystallinity (%) |
Crystallite size (nm) |
Dislocation-density |
Micro strain (×10−3) |
Lattice parameter (nm) |
Phase |
| a |
b |
c |
| Pure CuO |
82.6 |
29.3 |
2.7 |
1.69 |
0.468 |
0.342 |
0.513 |
Monoclinic |
| 1 mol% F doped CuO |
80.6 |
28.9 |
2.9 |
1.71 |
0.469 |
0.342 |
0.513 |
Monoclinic |
| 3 mol% F doped CuO |
79.2 |
26.2 |
3.2 |
1.90 |
0.469 |
0.342 |
0.513 |
Monoclinic |
| 0.427 |
0.427 |
0.427 |
Cuprite |
| 5 mol% F doped CuO |
78.6 |
25.3 |
3.2 |
1.95 |
0.469 |
0.342 |
0.513 |
Monoclinic |
| 0.427 |
0.427 |
0.427 |
Cuprite |
HRTEM analysis was conducted to provide detailed structural characterization as seen in Fig. 2 and 3. Both the pure and 3 mol% F doped CuO nanoparticles displayed irregular agglomerations, however the average particle size was reduced for the doped sample. The particle size was determined to be 176 nm for pure nanoparticles and 156 nm for fluorine doped nanoparticles, validating the analysis performed by FESEM. The SAED patterns verified the crystalline nature of the nanoparticles once again and also identified the planes associated with the CuO nanoparticles in both samples, which are shown in Fig. 2(d) and 3(d). As seen in the XRD spectra, a peak associated with Cu(I) oxide was also detected in 3 mol% F doped CuO NPs. The presence of the Cu(I) oxide was confirmed from the (020) plane of Cu2O shown in Fig. 3(d). Interplanar distance for (111) plane of CuO phase was calculated from the high-resolution images and depicted in the Fig. 2(c) and 3(c), respectively. The d-spacing for the nanoparticles were measured for three major crystallographic planes of CuO, namely 〈110〉, 〈![[1 with combining macron]](https://www.rsc.org/images/entities/char_0031_0304.gif) 11〉 and 〈111〉 and tabulated in Table 2.
11〉 and 〈111〉 and tabulated in Table 2.
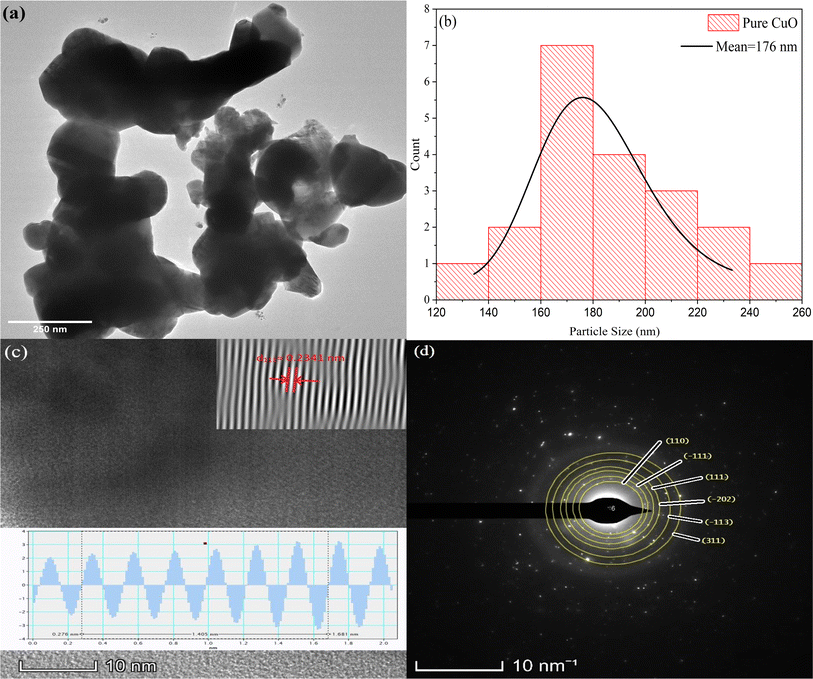 |
| | Fig. 2 (a) Morphology, (b) particle size distribution from HRTEM, (c) interplanar spacing calculation of (111) plane using IFFT data, and (d) SAED pattern of pure CuO. | |
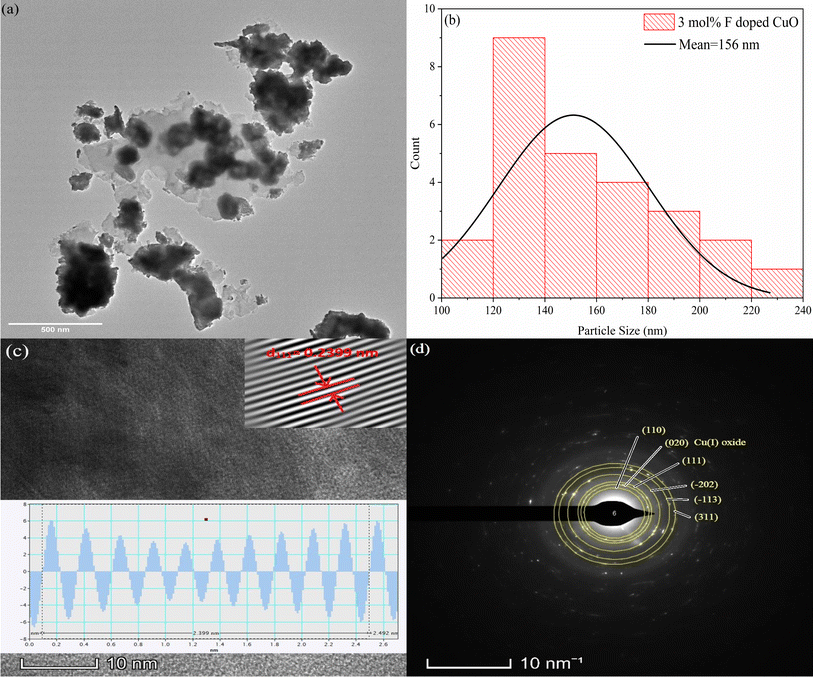 |
| | Fig. 3 (a) Morphology, (b) particle size distribution from HRTEM, (c) interplanar spacing calculation of (111) plane using IFFT data, and (d) SAED pattern of 3 mol% F doped CuO. | |
Table 2 Interplanar spacing data from HRTEM and XRD analysis
| Samples |
〈h k l〉 |
dhkl (Å) JCPDS |
dhkl (Å) XRD |
dhkl (Å) HRTEM |
FWHM degree |
| Pure |
〈1 1 0〉 |
2.7512 |
2.7506 |
2.7420 |
0.152 |
〈![[1 with combining macron]](https://www.rsc.org/images/entities/char_0031_0304.gif) 1 1〉 1 1〉 |
2.5293 |
2.5215 |
2.5297 |
0.208 |
| 〈1 1 1〉 |
2.3227 |
2.3231 |
2.3410 |
0.173 |
| 3 mol% F doped CuO |
〈1 1 0〉 |
2.7530 |
2.7531 |
2.7535 |
0.187 |
〈![[1 with combining macron]](https://www.rsc.org/images/entities/char_0031_0304.gif) 1 1〉 1 1〉 |
2.5252 |
2.5253 |
2.5278 |
0.236 |
| 〈1 1 1〉 |
2.3243 |
2.3247 |
2.3990 |
0.290 |
As the doping increased the interplanar distance of the host lattice, which is validated by both XRD and TEM analysis, the FWHM is also increased correspondingly found from XRD data, resulting in reduced crystallite size which in turn increases dislocation density as (dislocation density, δ = 1/D2) crystallite size decreased. From pure to 3 mol% F doped CuO NPs, the dislocation density rose from 2.7 to 3.2 nm−2. The elastic residual strain was calculated for the doped sample following, ε = (d − do)/do, where d is the interplanar spacing and do is the value from strain free lattice [materials 11]. The relative elastic residual strain of 3 mol% F doped CuO with respect to pure CuO for (110), (![[1 with combining macron]](https://www.rsc.org/images/entities/char_0031_0304.gif) 11) and (111) planes are 0.00065, 0.0015 and 0.0007 which indicates the introduction of strain after fluorine doping.
11) and (111) planes are 0.00065, 0.0015 and 0.0007 which indicates the introduction of strain after fluorine doping.
Morphological evolution
FE-SEM micrographs of all the nanoparticles evidently displayed a distinct irregularity and agglomeration in their shape (Fig. 4). However, it was obvious from the micrograph that increased dopant concentration reduced the particle sizes gradually.34 Particle size was measured using ImageJ and the size distribution was measured using origin pro software (Fig. 4). Average particle size of pure, 1, 3 and 5 mol% F doped nanoparticles was found to be 179, 172, 159 and 152 nm, respectively. Dopant segregation on the surface can reduce particle size and increase effective surface area by inhibiting particle growth.
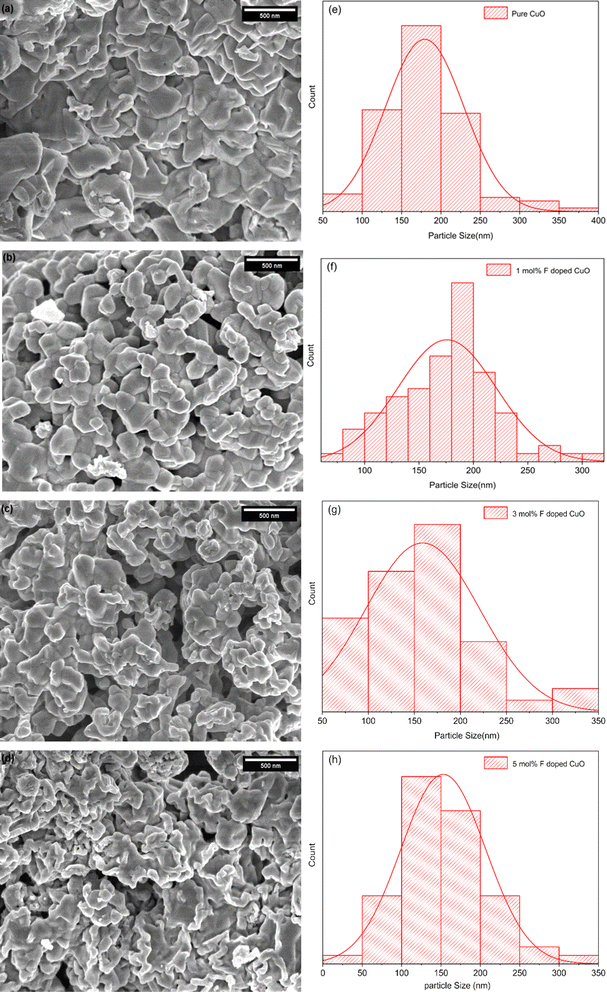 |
| | Fig. 4 (a–d) Morphological analysis and (e–h) particle size distribution. | |
The elemental composition was examined using Energy Dispersive X-ray Spectroscopy (EDX), as shown in Fig. 5 and 6. Fig. 5(b) shows the EDX spectrum of CuO NPs doped with 3% fluorine, revealing a fluorine content of approximately 1.8 atomic percent (Table 3). The fluorine content in the sample doped with 3 mol% is apparently lower than anticipated which could be due to the spot measured not being representative of the whole sample. Hence, probabilistic methods might be needed to support the results. Fig. 6 displays the elemental mapping of the 3 mol% fluorine doped CuO NPs exhibiting the uniform distribution of fluorine in the CuO host lattice.
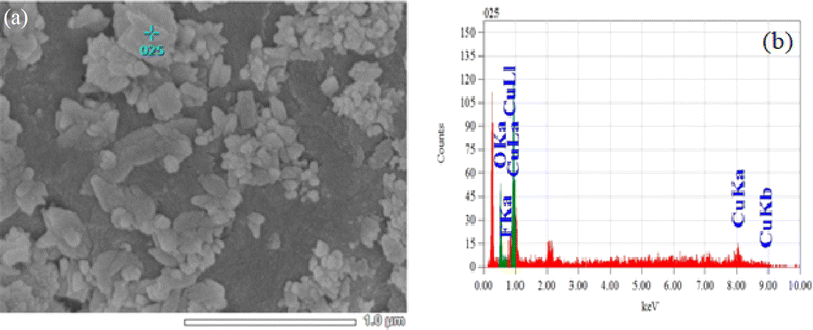 |
| | Fig. 5 (a) Microstructure and (b) EDS spectra of 3 mol% F doped CuO NPs. | |
 |
| | Fig. 6 Elemental mapping of 3 mol% F doped CuO NPs. | |
Table 3 Atom percentage data from EDS Spectra
| Element |
Atom (%) |
Sigma |
| O K |
32.92 |
1.75 |
| F K |
1.80 |
0.69 |
| Cu L |
65.29 |
3.18 |
| Total |
100.00 |
|
Optical analysis
Optical properties were studied using UV-vis spectrometer. The Diffuse reflectance spectra for the fluorine doped CuO NPs are presented in Fig. 7 showing strong absorption edge in the visible region at around 800 nm. The doped nanoparticles exhibited slight red shift referring to the lower band gap compared to pure CuO, corroborating the indirect band gap (Eg) calculation. Tauc plot was utilized to calculate the indirect band gap from the absorbance data.where α is absorbance co-efficient, h is plank's constant, ν is photon's frequency, A is proportionality constant and Eg is band gap. Here, γ = 1/2 is used to calculate the indirect band gap.
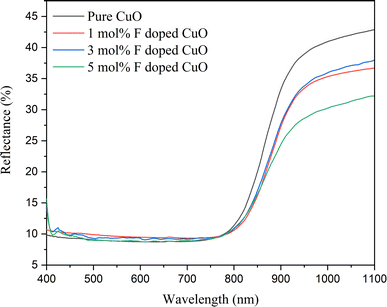 |
| | Fig. 7 Diffuse reflectance spectra of pure and doped CuO NPs. | |
Fig. 8 illustrates the decreasing trend of indirect band gap energy with increasing dopant concentration. For pure, 1, 3 and 5 mol% F doped CuO, band-gap energy was 1.233, 1.228, 1.219, and 1.211 eV, respectively. Upon doping, F− ions replace O2− ions, which may generate a side-way defect state within forbidden zone of the band structure, making the band gap effectively narrower. Also, a higher percentage of fluorine doping facilitated cuprous oxide formation in the doped nanoparticles, which is corroborated by the XRD data, may also contribute to the decreasing band gap in the doped nanoparticles.24
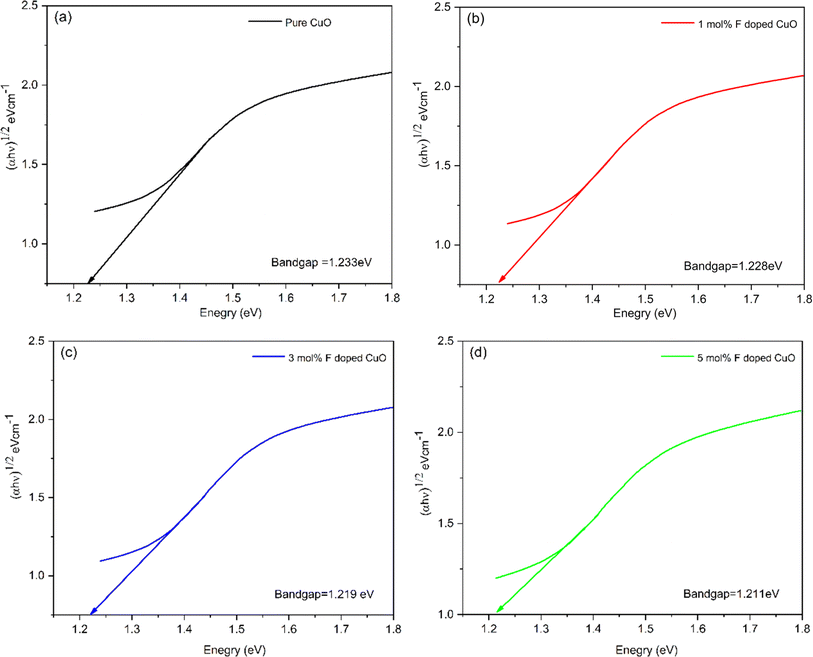 |
| | Fig. 8 Tauc plot showing indirect band gap of pure and doped CuO NPs. | |
XPS analysis
From XPS spectroscopy, general survey scans of CuO and 3 mol% F CuO NPs presented in Fig. 9(a) show peaks for Cu 2p3/2, Cu 2p1/2, C 1s and O 1s appeared at nearly identical binding energies and peak at 684.90 eV found in the F doped CuO NPs, indicating successful incorporation of dopant element in the lattice.35 C 1s peak at 284.1 eV in the survey scan can be found which was used as a reference to calibrate XPS spectra.36
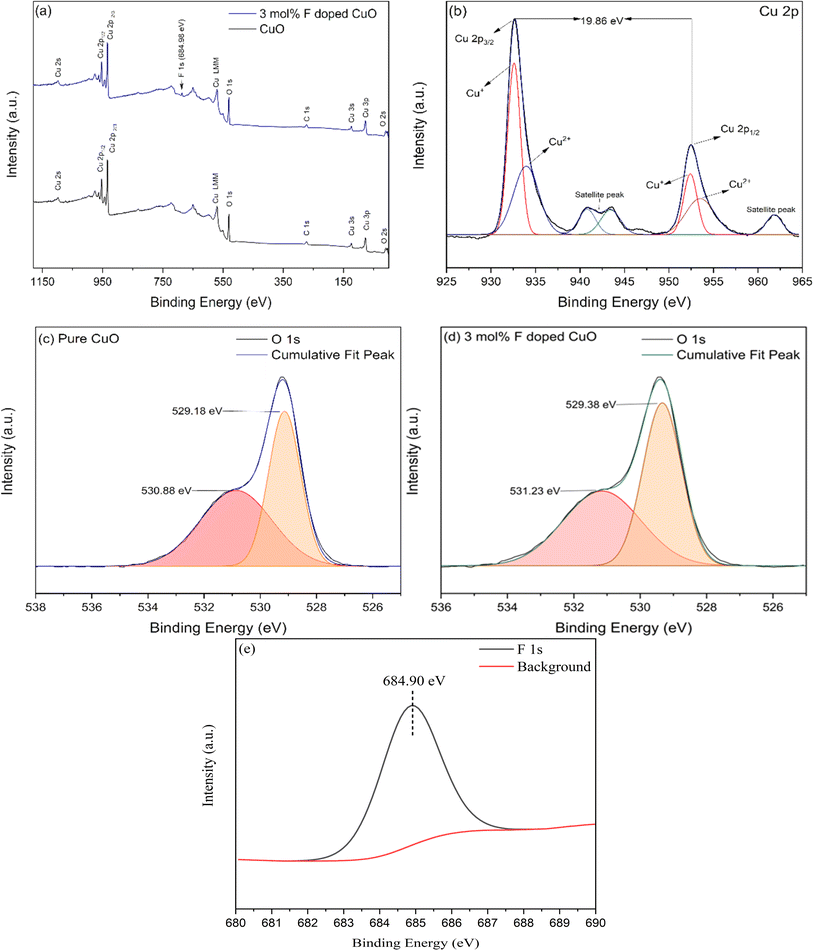 |
| | Fig. 9 XPS spectra for (a) pure and 3 mol% F doped CuO, core level XPS spectra of (b) Cu 2p of 3 mol% F doped CuO, (c) O 1s of pure CuO and (d) O 1s of 3 mol% F doped CuO (e) F 1s of 3 mol% F doped CuO. | |
Core level scanning for Cu 2p and O 1s were recorded individually in high resolution setting. In Fig. 9(b) core level XPS spectra of the doped nanoparticles appeared with a doublet at 932.62 eV and 952.48 eV, associated to Cu 2p3/2 and Cu 2p1/2 energy level with a separation of 19.86 eV confirming the Cu2+ oxidation state.35,37,38 Likewise, two strong satellite peaks at around 941 eV and 961.53 eV associated to the Cu 2p3/2 and Cu 2p1/2 are in well agreement with the previous studies.39,40 Performing deconvolution of core level spectra of F doped CuO resulted in two pair of fitted curves indicating existence of both Cu+ and Cu2+ supporting the co-existence of Cu2O and CuO found in XRD analysis.24,41 Fig. 9(c) and (d) show the O 1s spectra of pure CuO and F doped CuO respectively, each resolved into two components by Gaussian fittings and Fig. 9(e) illustrates the F 1s peak from high resolution image of 3 mol% F doped CuO. Peaks at binding energy 529.18 eV and 530.88 eV correspond to lattice oxygen (OL) and oxygen vacancies (OV) in pure CuO and the percentage area under the fitted curve was 43% (OL) and 57% (OV), respectively. The percentage area under two fitted curves of O 1s XPS spectra from F doped sample showed 52% (OL) and 48% (OV) at binding energy 529.38 eV and 531.23 eV, respectively suggesting a decrease in the oxygen vacancies in the doped nanoparticle. Upon doping, fluorine might have occupied the oxygen vacancies as the atomic size is compatible with the vacancy sites, previous studies also showed a similar phenomenon upon fluorine doping which corroborates this mechanism.24
Vibrational analysis
FTIR analysis of the nanoparticles reveals molecular composition, surface modifications, and interactions with other substances. It identifies functional groups, assesses surface changes, quantifies ligand coverage, and aids in quality control. FTIR analysis was conducted utilizing the transmission mode throughout the wavelength range of 4000 cm−1 to 400 cm−1. Fig. 10 depicted FTIR spectra of pure along with 1, 3 and 5 mol% F doped nanoparticles.
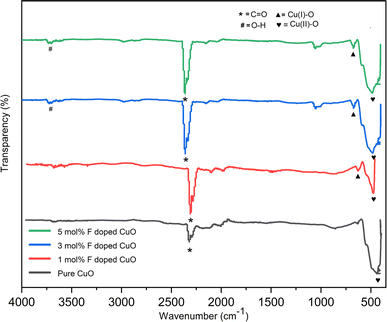 |
| | Fig. 10 FTIR spectra of pure and doped CuO NPs. | |
Peak located at wavenumber 477 cm−1 is accountable for the vibrational stretching of Cu–O bond and peak at 625 cm−1 provides evidence for Cu(I)–O vibrations42,43 which is also supported by the XRD as fluorine doped nanoparticles included some cuprous oxide. The peak found at 2365 cm−1 might be an indication of CO2 incorporation from air as the analysis was performed in atmospheric environment, Again, the peak observed at 3721 cm−1 is associated to the vibrational mode of the O–H bond.44
Photocatalytic activity
Photocatalytic activity of the nanoparticles was assessed by the photodegradation performance of Rh B dye after a total irradiation time of 180 minutes under UV lamp.45 Fig. 11 shows the degradation of pure and doped CuO NPs where 3 mol% F doped CuO exhibited the best performance among all nanoparticles.
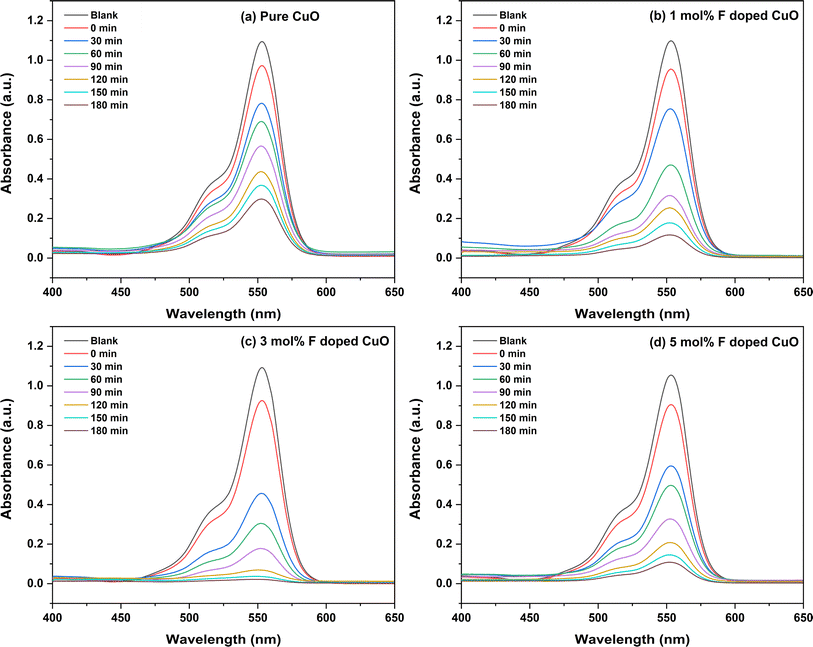 |
| | Fig. 11 Absorbance curve of RhB with time of pure and doped CuO NPs including adsorption performance. | |
Incorporation of H2O2 significantly promotes the photocatalytic performance of CuO according to previous studies.30,46,47 Verma et al. demonstrated the promoting effect of H2O2 along with NaOH for the dye degradation.47 When H2O2 is introduced into the photocatalytic system surrounded by photocatalysts like TiO2, ZnO or CuO under UV irradiation, it can function as a source of hydroxyl radicals (OH˙) undergoing photochemical reaction.48–50 The EH for the formation of H2O2/OH˙ generated by the hole is around 2.2 eV with respect to the Normal Hydrogen Electrode Potential (NHE), which is lower than the reported EV value of CuO.51 This suggests that the holes formed as a result of UV light absorption by CuO NPs have the ability to oxidize H2O2 into OH˙ radicals. This OH˙ radicals help to break the dye. It is noteworthy to mention that while H2O2 in isolation does not contribute considerably to the degradation of Rh B, its combination with photocatalysts or OH˙ formers significantly enhance their activity. These highly reactive OH˙ radicals are potential oxidizing agents that can efficiently break down organic pollutants or other target compounds, thereby enhancing the photocatalytic efficiency.52 Therefore, H2O2 was added in this study to facilitate the photocatalytic degradation mechanism.
Effect of fluorine doping
Degradation efficiency was found to be 69.46, 87.78, 97.78 and 88.05% for pure and 1, 3, 5 mol% F doped CuO, respectively (Fig. 12). Degradation gradually increased with F doping up to 3 mol% and later decreased after 5 mol% F doping making 3 mol% F doped CuO nanoparticles the best photocatalyst compared to other synthesized counterparts. During annealing at higher temperature, oxygen atoms escape out from lattice sites producing oxygen vacancies in the p type CuO NPs.24 Addition of fluorine reduced the extent of these oxygen vacancies which is authenticated earlier by XPS analysis where a significant decrease in oxygen vacancies after doping was evident. This phenomenon inhibits electron–hole recombination for effectual degradation of Rh B dye. Again, CuO/Cu2O forms a staggered type II band structure which helps to improve the photo degradation.53 It might be the reason for higher photo-degradation for 3 mol% F doped CuO than 1 mol% F doped nanoparticle since former contains cuprous oxide phase, but latter does not. However, decreased photocatalytic degradation efficiency was observed for 5 mol% F doping. The concentration of dopants (either donor or acceptor impurities) in a semiconductor pronouncedly affects carrier concentration and mobility, hence, high doping levels can lead to increased scattering, resulting in lower charge carrier mobility and a reduction in the overall charge transport rate causing the decreased photo degradation efficiency of 5 mol% F doped CuO.54 Another reason might be the presence of metallic copper formation which may facilitate electron–hole recombination process impeding the photocatalytic performance of 5 mol% F doped CuO NPs.
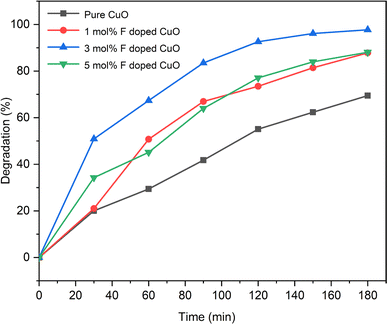 |
| | Fig. 12 Degradation percentage of Rh B with time. | |
Degradation kinetics
Photocatalytic processes have been investigated in recent research employing pseudo-first-order kinetics in relation to the substrate concentration.55,56 Nevertheless, in order to determine the reaction order, the degradation kinetics of RhB dye in presence of CuO and F doped CuO photocatalyst (Rh B 5 ppm, pH10) were estimated using the first order and second order reaction given by the eqn (6) and (7)| |
 | (6) |
| |
 | (7) |
Here, C0 is the primary concentration of the dye, C stands for the concentration of Rh B solution at any time t and t is the UV irradiation time. The first order rate constant (k1) and second order rate constant (k2) are presented in Table 4. The assessment of the credibility of the rate constant was accomplished through the evaluation of the regression correlation coefficient (R2). Here, R2 values for first order rate model is greater than 0.99, surpassing R2 value of second order rate model. Therefore, here the photocatalytic degradation process adheres to the laws of first order rate kinetics.56 k1 value was increased as dopant concentration was raised from 1 to 3 mol%. However, the rate constant decreased upon reaching 5 mol% fluorine doping. The reasoning behind the reduction of the rate constant has been previously discussed. 1st and 2nd order linear fitted regression lines are plotted on Fig. 13(a) and (b).
Table 4 1st and 2nd rate constant and regression coefficient calculation
| Sample |
k1 |
R2 |
k2 |
R2 |
| Pure CuO |
0.00659 |
0.99568 |
0.01299 |
0.96039 |
| 1 mol% F doped CuO |
0.01179 |
0.99453 |
0.04101 |
0.88310 |
| 3 mol% F doped CuO |
0.02105 |
0.99523 |
0.24677 |
0.79278 |
| 5 mol% F doped CuO |
0.01186 |
0.99139 |
0.04512 |
0.90925 |
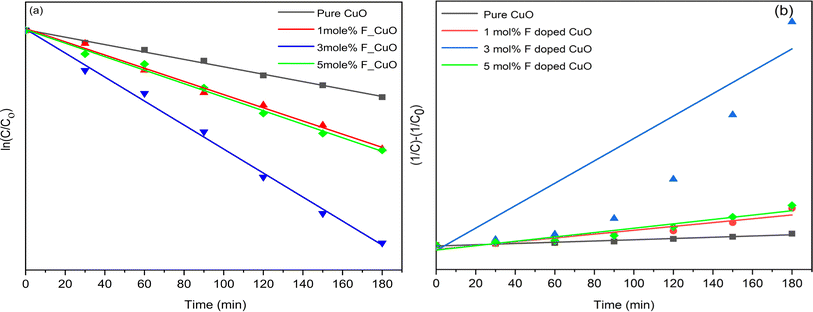 |
| | Fig. 13 (a) 1st and (b) 2nd order linear regression model of degradation. | |
Impact of radicals' scavenger on photocatalytic degradation
The phenomenon of photocatalytic activity occurs in 3 steps, initiated with UV light absorption. Afterwards, the process involves the separation of electron–hole pairs produced during photochemical reaction, followed by the oxidation-reduction of the surface charge. Because of the high e− and h+ recombination rate, transfer of the surface charges is very constrained. To enhance photocatalytic activity, the recombination rate needs to be mitigated.57–59
In general, superoxide radical ( ), electron (e−), hole (h+) and hydroxyl radical (OH˙) are the four active species that contribute to photocatalytic dye degradation process. For assessing the underlying mechanism of the F doped CuO as photocatalyst under UV light irradiation, trapping tests for the active species were conducted during the photodegradation phase of 3 mol% F doped CuO, as depicted in the Fig. 14(a). To scavenge
  , e−, h+ and OH˙ active sites, ascorbic acid (AA), K2Cr2O7 (Cr2O72−), NaCl (Cl−) and C3H8O (IPA) were used, respectively.58–60 Based on the observation presented in Fig. 14(b), it is evident that the use of IPA as a trapping agent leads to a substantial reduction in photodegradation, up to 85%. Additionally, chloride ions (Cl−) have been observed to significantly mitigate degradation, resulting in a reduction of approximately 82%. Both AA and K2Cr2O7 also decreased the photocatalytic activity, although they were unable to suppress the photocatalytic activity as effectively as IPA and Cl− suggesting hydroxyl radicals and holes as the leading active species that control the photocatalytic activity of the F doped CuO nanoparticles.
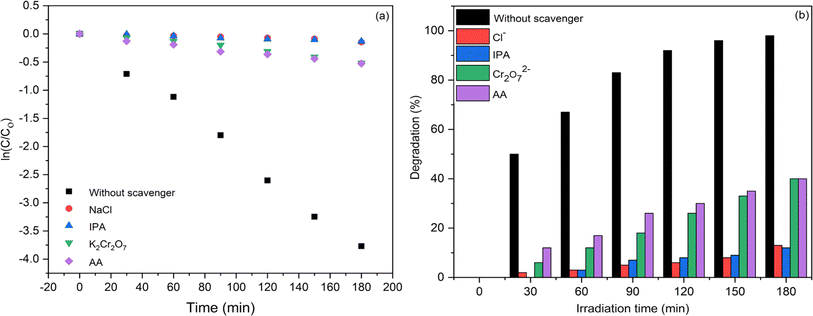 |
| | Fig. 14 Scavenger test for trapping active species using 3 mol% F doped CuO NPs as photocatalyst, (a) kinetics of degradation reaction and (b) degradation efficiency. | |
Proposed mechanism of degradation
In this proposed mechanism, photodegradation begins with UV irradiation and, thereafter, the generation of electron–hole (e−/h+) pairs in doped nanoparticles, as stated in eqn (8). On irradiating UV light to nanoparticles, photo induced electron–hole pairs are generated, facilitated by the narrow band gaps of the nanoparticles as band gap is decreased.43 EC of CuO with respect to NHE is −0.5 eV which is lower than EH of O2/O2− (−0.33 V). Therefore, molecular oxygen is reduced to superoxide anion radicals ( ) following eqn (9). The conduction band electrons can take part in reduction reaction with dye molecule or adsorbed O2 on nanoparticle surface or dissolved O2 in water. The holes in the valence band (VB) can effectively contribute to the oxidation of Rh B molecules and, simultaneously, can also oxidize water through their interaction with hydroxide ions (OH−) as in eqn (11) leading to the emergence of OH˙ radicals as shown in eqn (12). This oxidation process takes place since redox potential of H2O/OH˙ is lower than EV of CuO with respect to NHE. The collaborative efforts of both electrons and holes contribute to the process of decolorization, which eventually leads to the generation of damaged products. Based on provided information, the pertinent reactions occurring at the surface of CuO NPs that led to the degradation of dyes can be stated in the following manner as shown in eqn (8)–(17).61,62
| | |
CuO + hν (UV) = CuO (eCB− + hVB+)
| (8) |
| |
 | (9) |
| | |
CuO (eCB−) + Dye = Reduced product
| (10) |
| | |
CuO (hVB+) + H2O = CuO + H++ OH−
| (11) |
| | |
CuO (hVB+) + OH− = CuO + H++ OH˙
| (12) |
| | |
CuO (hVB+) + Dye = Oxidation product
| (13) |
| |
 | (14) |
| |
 | (15) |
| | |
Rh B˙+ + OH˙ → Degradation product
| (17) |
Reusability
The photocatalysts should be stable and reusable in addition to having exceptional catalytic performance for practical applications.63,64 The reusability of the 3 mol% F doped CuO NPs has been assessed. Fig. 15 demonstrates insignificant decrease in the photodegradation efficiency against RhB dye even after 4 consecutive cycles, indicating the photocatalyst's potential for reusability. Therefore, it can be concluded that the synthesized photocatalyst is stable under experimental conditions and can be easily reused for multiple cycles of dye degradation though unavoidable loss during the recycling process remains.
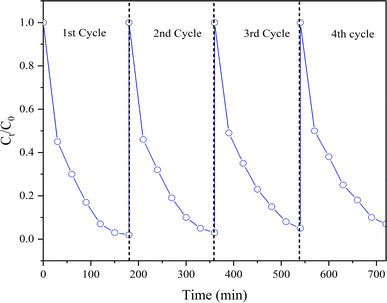 |
| | Fig. 15 Reusability of CuO NPs after 4 cycles. | |
Conclusion
In current studies, modified sol–gel process was used to synthesize fluorine doped nanoparticles. XRD analysis showed complete dissolution of fluorine in the crystal with decreased crystallinity and crystallite size along with smaller particle size on doping. SEM examination revealed fused irregular-shaped morphology of the nanoparticles. For doping beyond 1 mol%, presence of second phase Cu2O was evident from XRD, HRTEM and XPS analysis. On doping band gap decreased gradually with increasing concentration of dopant. Later, this study assessed photocatalytic efficiency of pure and doped CuO NPs, using hydrogen peroxide as catalyst promoter. The most effective photodegradation occurred with 3 mol% F doped CuO NPs due to decreased band gap, staggered type II band structure due to formation of second phase Cu2O and side way defect state introduced by dopant to trap charge carriers resulting in reduced electron–hole recombination rate. However, 5 mol% F doping resulted in increased scattering of charge carriers and subsequent reduced carrier mobility leading to the decreased photo degradation efficiency in presence of metallic copper. Therefore, with optimum doping content CuO NPs seems to be potential candidate for wastewater treatment.
Author contributions
Ankita Dastider: investigation, methodology, writing – original draft, writing – review & editing. Hridoy Saha: investigation, methodology, writing – original draft, writing – review & editing. Md Jannatul Ferdous Anik: methodology, writing – original draft, writing – review & editing. Moniruzzaman Jamal: formal analysis, validation, writing – review & editing, Md. Muktadir Billah: conceptualization, validation, supervision, writing – review & editing. All authors provided critical feedback and helped shape the research, analysis, and manuscript.
Conflicts of interest
There are no conflicts of interest to declare.
Acknowledgements
This work was funded by the Committee of Advanced Studies and Research (CASR) and supported by the Department of Materials and Metallurgical Engineering (MME), Bangladesh University of Engineering and Technology (BUET).
References
- Y. Deng and R. Zhao, Advanced Oxidation Processes (AOPs) in Wastewater Treatment, Curr. Pollut. Rep., 2015, 1, 167–176, DOI:10.1007/s40726-015-0015-z.
- J. H. Carey, An Introduction to Advanced Oxidation Processes (AOP) for Destruction of Organics in Wastewater, Water Qual. Res. J., 1992, 27, 1–22, DOI:10.2166/wqrj.1992.001.
- B. Bethi, S. H. Sonawane, B. A. Bhanvase and S. P. Gumfekar, Nanomaterials-Based Advanced Oxidation Processes for Wastewater Treatment: A Review, Chem. Eng. Process., 2016, 109, 178–189, DOI:10.1016/j.cep.2016.08.016.
- H. A. Kiwaan, T. M. Atwee, E. A. Azab and A. A. El-Bindary, Photocatalytic Degradation of Organic Dyes in the Presence of Nanostructured Titanium Dioxide, J. Mol. Struct., 2020, 1200, 127115, DOI:10.1016/j.molstruc.2019.127115.
- X. Samriti, R. Tyagi, O. Ruzimuradov and J. Prakash, Fabrication Methods and Mechanisms for Designing Highly-Efficient Photocatalysts for Energy and Environmental Applications, Mater. Chem. Phys., 2023, 307, 128108, DOI:10.1016/j.matchemphys.2023.128108.
- S.-M. Ji, A. P. Tiwari, H. J. Oh and H.-Y. Kim, ZnO/Ag Nanoparticles Incorporated Multifunctional Parallel Side by Side Nanofibers for Air Filtration with Enhanced Removing Organic Contaminants and Antibacterial Properties, Colloids Surf., A, 2021, 621, 126564, DOI:10.1016/j.colsurfa.2021.126564.
- N. P. Subiramaniyam, S. Vadivel, S. Kumaresan and K. Vallalperuman, Fluorine-Doped Nanocrystalline ZnO Powders Prepared via Microwave Irradiation Route as Effective Materials for Photocatalyst, J. Mater. Sci.: Mater. Electron., 2017, 28, 16173–16180, DOI:10.1007/s10854-017-7518-x.
- F. M. Sanakousar, C. C. Vidyasagar, V. M. Jiménez-Pérez and K. Prakash, Recent Progress on Visible-Light-Driven Metal and Non-Metal Doped ZnO Nanostructures for Photocatalytic Degradation of Organic Pollutants, Mater. Sci. Semicond. Process., 2022, 140, 106390, DOI:10.1016/j.mssp.2021.106390.
- S. Rehman, A. Mumtaz and S. K. Hasanain, Size Effects on the Magnetic and Optical Properties of CuO Nanoparticles, J. Nanopart. Res., 2011, 13, 2497–2507, DOI:10.1007/s11051-010-0143-8.
- I. Blinova, A. Ivask, M. Heinlaan, M. Mortimer and A. Kahru, Ecotoxicity of Nanoparticles of CuO and ZnO in Natural Water, Environ. Pollut., 2010, 158, 41–47, DOI:10.1016/j.envpol.2009.08.017.
- S. Konar, H. Kalita, N. Puvvada, S. Tantubay, M. Kr. Mahto, S. Biswas and A. Pathak, Shape-Dependent Catalytic Activity of CuO Nanostructures, J. Catal., 2016, 336, 11–22, DOI:10.1016/j.jcat.2015.12.017.
- M. Parashar, V. K. Shukla and R. Singh, Metal Oxides Nanoparticles via Sol–Gel Method: A Review on Synthesis, Characterization and Applications, J. Mater. Sci.: Mater. Electron., 2020, 31, 3729–3749, DOI:10.1007/s10854-020-02994-8.
- D. A. Patiño-Ruiz, S. I. Meramo-Hurtado, Á. D. González-Delgado and A. Herrera, Environmental Sustainability Evaluation of Iron Oxide Nanoparticles Synthesized via Green Synthesis and the Coprecipitation Method: A Comparative Life Cycle Assessment Study, ACS Omega, 2021, 6, 12410–12423, DOI:10.1021/acsomega.0c05246.
- S. Ge, X. Shi, K. Sun, C. Li, C. Uher, J. R. Baker, M. M. Banaszak Holl and B. G. Orr, Facile Hydrothermal Synthesis of Iron Oxide Nanoparticles with Tunable Magnetic Properties, J. Phys. Chem. C, 2009, 113, 13593–13599, DOI:10.1021/jp902953t.
- D. Bokov, A. Turki Jalil, S. Chupradit, W. Suksatan, M. Javed Ansari, I. H. Shewael, G. H. Valiev and E. Kianfar, Nanomaterial by Sol-Gel Method: Synthesis and Application, Adv. Mater. Sci. Eng., 2021, 2021, 1–21, DOI:10.1155/2021/5102014.
- N. Tian, Z.-Y. Zhou, S.-G. Sun, Y. Ding and Z. L. Wang, Synthesis of Tetrahexahedral Platinum Nanocrystals with High-Index Facets and High Electro-Oxidation Activity, Science, 2007, 316, 732–735, DOI:10.1126/science.1140484.
- I. A. Rahman and V. Padavettan, Synthesis of Silica Nanoparticles by Sol-Gel: Size-Dependent Properties, Surface Modification, and Applications in Silica-Polymer Nanocomposites—A Review, J. Nanomater., 2012, 2012, 1–15, DOI:10.1155/2012/132424.
- K. Kajihara, Recent Advances in Sol–Gel Synthesis of Monolithic Silica and Silica-Based Glasses, J. Asian Ceram. Soc., 2013, 1, 121–133, DOI:10.1016/j.jascer.2013.04.002.
- M. Niederberger and N. Pinna, Metal Oxide Nanoparticles in Organic Solvents; Engineering Materials and Processes, Springer, London, 2009; ISBN 978-1-84882-670-0 Search PubMed.
- Q. I. Rahman, M. Ahmad, S. K. Misra and M. Lohani, Effective Photocatalytic Degradation of Rhodamine B Dye by ZnO Nanoparticles, Mater. Lett., 2013, 91, 170–174, DOI:10.1016/j.matlet.2012.09.044.
- W. S. Koe, J. W. Lee, W. C. Chong, Y. L. Pang and L. C. Sim, An Overview of Photocatalytic Degradation: Photocatalysts, Mechanisms, and Development of Photocatalytic Membrane, Environ. Sci. Pollut. Res., 2020, 27, 2522–2565, DOI:10.1007/s11356-019-07193-5.
- H. A. Rafaie, R. M. Nor, M. S. Azmina, N. I. T. Ramli and R. Mohamed, Decoration of ZnO Microstructures with Ag Nanoparticles Enhanced the Catalytic Photodegradation of Methylene Blue Dye, J. Environ. Chem. Eng., 2017, 5, 3963–3972, DOI:10.1016/j.jece.2017.07.070.
- F. Ansari, S. Sheibani, U. Caudillo-Flores and M. Fernández-García, Titania-Decorated Copper Oxide Nanophotocatalyst Powder: A Stable and Promoted Photocatalytic Active System, J. Photochem. Photobiol., A, 2021, 418, 113401, DOI:10.1016/j.jphotochem.2021.113401.
- M. Jamal, M. M. Billah and S. A. Ayon, Opto-Structural and Magnetic Properties of Fluorine Doped CuO Nanoparticles: An Experimental Study, Ceram. Int., 2023, 49, 10107–10118, DOI:10.1016/j.ceramint.2022.11.194.
- N. Mohamed Basith, J. Judith Vijaya, J. Kennedy, L. Bououdina and M. Structural, Optical and Room-Temperature Ferromagnetic Properties of Fe-Doped CuO Nanostructures, Phys. E, 2013, 53, 193–199, DOI:10.1016/j.physe.2013.05.009.
- X. Deng, C. Wang, M. Shao, X. Xu and J. Huang, Low-Temperature Solution Synthesis of CuO/Cu2O Nanostructures for Enhanced Photocatalytic Activity with Added H2O2: Synergistic Effect and Mechanism Insight, RSC Adv., 2017, 7, 4329–4338, 10.1039/C6RA27634B.
- S. Rasheed, Z. Batool, A. Intisar, S. Riaz, M. Shaheen and R. Kousar, Enhanced Photodegradation Activity of Cuprous Oxide Nanoparticles towards Congo Red for Water Purification, DWT, 2021, 227, 330–337, DOI:10.5004/dwt.2021.27238.
- A. Trenczek-Zajac, M. Synowiec, K. Zakrzewska, K. Zazakowny, K. Kowalski, A. Dziedzic and M. Radecka, Scavenger-Supported Photocatalytic Evidence of an Extended Type I Electronic Structure of the TiO2@Fe2O3 Interface, ACS Appl. Mater. Interfaces, 2022, 14, 38255–38269, DOI:10.1021/acsami.2c06404.
- T. Banu, M. Jamal and F. Gulshan, Opto-Structural Properties and Photocatalytic Activities of CuO NPs Synthesized by Modified Sol-Gel and Co-Precipitation Methods: A Comparative Study, Results Mater., 2023, 19, 100419, DOI:10.1016/j.rinma.2023.100419.
- H. Yu, J. Yu, S. Liu and S. Mann, Template-Free Hydrothermal Synthesis of CuO/Cu2O Composite Hollow Microspheres, Chem. Mater., 2007, 19, 4327–4334, DOI:10.1021/cm070386d.
- S. Mondal, M. Jamal, S. A. Ayon, M. J. F. Anik and M. M. Billah, Synergistic Enhancement of Photocatalytic and Antimicrobial Efficacy of Nitrogen and Erbium Co-Doped ZnO Nanoparticles, J. Rare Earths, 2023, S1002072123002727, DOI:10.1016/j.jre.2023.10.002.
- S. A. Ayon, M. Jamal, M. M. Billah and S. Neaz, Augmentation of Magnetic Properties and Antimicrobial Activities of Band Gap Modified Ho3+ and Sm3+ Doped ZnO Nanoparticles: A Comparative Experimental Study, J. Alloys Compd., 2022, 897, 163179, DOI:10.1016/j.jallcom.2021.163179.
- M. Arfan, D. N. Siddiqui, T. Shahid, Z. Iqbal, Y. Majeed, I. Akram, M. Noreen, R. Bagheri, Z. Song and A. Zeb, Tailoring of Nanostructures: Al Doped CuO Synthesized by Composite-Hydroxide-Mediated Approach, Results Phys., 2019, 13, 102187, DOI:10.1016/j.rinp.2019.102187.
- K. Ravichandran, S. Snega, N. Jabena Begum, L. Rene Christena, S. Dheivamalar and K. Swaminathan, Effect of Mg Doping Level on the Antibacterial Activity of (Mg + F)-Doped ZnO Nanopowders Synthesized Using a Soft Chemical Route, Philos. Mag., 2014, 94, 2541–2550, DOI:10.1080/14786435.2014.921349.
- Ç. Oruç and A. Altındal, Structural and Dielectric Properties of CuO Nanoparticles, Ceram. Int., 2017, 43, 10708–10714, DOI:10.1016/j.ceramint.2017.05.006.
- J. Chang, Z. Lin, M. Lin, C. Zhu, J. Zhang and J. Wu, Solution Processed F Doped ZnO (ZnO:F) for Thin Film Transistors and Improved Stability through Co-Doping with Alkali Metals, J. Mater. Chem. C, 2015, 3, 1787–1793, 10.1039/C4TC02257B.
- A. Chauhan, R. Verma, K. M. Batoo, S. Kumari, R. Kalia, R. Kumar, M. Hadi, E. H. Raslan and A. Imran, Structural and Optical Properties of Copper Oxide Nanoparticles: A Study of Variation in Structure and Antibiotic Activity, J. Mater. Res., 2021, 36, 1496–1509, DOI:10.1557/s43578-021-00193-7.
- S. Dolai, S. N. Sarangi, S. Hussain, R. Bhar and A. K. Pal, Magnetic Properties of Nanocrystalline Nickel Incorporated CuO Thin Films, J. Magn. Magn. Mater., 2019, 479, 59–66, DOI:10.1016/j.jmmm.2019.02.005.
- T. I. Shaheen, A. Fouda and S. S. Salem, Integration of Cotton Fabrics with Biosynthesized CuO Nanoparticles for Bactericidal Activity in the Terms of Their Cytotoxicity Assessment, Ind. Eng. Chem. Res., 2021, 60, 1553–1563, DOI:10.1021/acs.iecr.0c04880.
- D. A. Svintsitskiy, T. Yu. Kardash, O. A. Stonkus, E. M. Slavinskaya, A. I. Stadnichenko, S. V. Koscheev, A. P. Chupakhin and A. I. Boronin, In Situ XRD, XPS, TEM, and TPR Study of Highly Active in CO Oxidation CuO Nanopowders, J. Phys. Chem. C, 2013, 117, 14588–14599, DOI:10.1021/jp403339r.
- U. Periyayya, D. Madhu, K. Subramaniyam, H. Son and I.-H. Lee, Enhanced Cyclic Performance Initiated via an in Situ Transformation of Cu/CuO Nanodisk to Cu/CuO/Cu2O Nanosponge, Environ. Sci. Pollut. Res., 2021, 28, 6459–6469, DOI:10.1007/s11356-020-10910-0.
- A. Sahai, N. Goswami, S. D. Kaushik and S. Tripathi, Cu/Cu2O/CuO Nanoparticles: Novel Synthesis by Exploding Wire Technique and Extensive Characterization, Appl. Surf. Sci., 2016, 390, 974–983, DOI:10.1016/j.apsusc.2016.09.005.
- S. M. Botsa, R. Dharmasoth and K. Basavaiah, A Facile Synthesis of Cu2O and CuO Nanoparticles Via Sonochemical Assisted Method, Curr. Nanosci., 2018, 15, 209–213, DOI:10.2174/1573413714666180530085447.
- H. Noei, H. Qiu, Y. Wang, E. Löffler, C. Wöll and M. Muhler, The Identification of Hydroxyl Groups on ZnO Nanoparticles by Infrared Spectroscopy, Phys. Chem. Chem. Phys., 2008, 10, 7092, 10.1039/b811029h.
- A. Sharma and R. K. Dutta, Se-Doped CuO NPs/H2O2/UV as a Highly Efficient and Sustainable Photo-Fenton Catalytic System for Enhanced Degradation of 4-Bromophenol, J. Cleaner Prod., 2018, 185, 464–475, DOI:10.1016/j.jclepro.2018.03.049.
- P. Basnet and Y. Zhao, Tuning the Cux O Nanorod Composition for Efficient Visible Light Induced Photocatalysis, Catal. Sci. Technol., 2016, 6, 2228–2238, 10.1039/C5CY01464F.
- P. Verma, S. K. Samanta and S. Mishra, Photon-Independent NaOH/H2O2–based Degradation of Rhodamine-B Dye in Aqueous Medium: Kinetics, and Impacts of Various Inorganic Salts, Antioxidants, and Urea, J. Environ. Chem. Eng., 2020, 8, 103851, DOI:10.1016/j.jece.2020.103851.
- N. Harun, C. K. Sheng, M. G. M. Sabri, A. N. Dagang and H. Salleh, Impact of Tio2 and H2O2 on Photocatalytic Degradation of Phodamine B Under Ultraviolet C (UV-C) Radiation for Efficient Polluted Wastewater Treatment, J. Optoelectron. Biomed. M., 2020, 12, 9–15, DOI:10.15251/JOBM.2020.121.9.
- A. Mohammadzadeh, M. Khoshghadam-Pireyousefan, B. Shokrianfard-Ravasjan, M. Azadbeh, H. Rashedi, M. Dibazar and A. Mostafaei, Synergetic Photocatalytic Effect of High Purity ZnO Pod Shaped Nanostructures with H2O2 on Methylene Blue Dye Degradation, J. Alloys Compd., 2020, 845, 156333, DOI:10.1016/j.jallcom.2020.156333.
- X. Deng, Q. Zhang, Q. Zhao, L. Ma, M. Ding and X. Xu, Effects of Architectures and H2O2 Additions on the Photocatalytic Performance of Hierarchical Cu2O Nanostructures, Nanoscale Res. Lett., 2015, 10, 8, DOI:10.1186/s11671-014-0726-x.
- A. Sharma and R. K. Dutta, Studies on the Drastic Improvement of Photocatalytic Degradation of Acid Orange-74 Dye by TPPO Capped CuO Nanoparticles in Tandem with Suitable Electron Capturing Agents, RSC Adv., 2015, 5, 43815–43823, 10.1039/C5RA04179A.
- B. Abebe, H. C. A. Murthy and E. Amare, Summary on Adsorption and Photocatalysis for Pollutant Remediation: Mini Review, J. Eng. Appl. Sci., 2018, 08, 225–255, DOI:10.4236/jeas.2018.84012.
- D. Jiang, J. Xue, L. Wu, W. Zhou, Y. Zhang and X. Li, Photocatalytic Performance Enhancement of CuO/Cu2O Heterostructures for Photodegradation of Organic Dyes: Effects of CuO Morphology, Appl. Catal., B, 2017, 211, 199–204, DOI:10.1016/j.apcatb.2017.04.034.
- L. Han, X. Zhou, L. Wan, Y. Deng and S. Zhan, Synthesis of ZnFe2O4 Nanoplates by Succinic Acid-Assisted Hydrothermal Route and Their Photocatalytic Degradation of Rhodamine B under Visible Light, J. Environ. Chem. Eng., 2014, 2, 123–130, DOI:10.1016/j.jece.2013.11.031.
- N. Daneshvar, M. H. Rasoulifard, A. R. Khataee, F. Hosseinzadeh and C. I. Removal of, Acid Orange 7 from Aqueous Solution by UV Irradiation in the Presence of ZnO Nanopowder, J. Hazard. Mater., 2007, 143, 95–101, DOI:10.1016/j.jhazmat.2006.08.072.
- M. Irani, T. Mohammadi and S. Mohebbi, Photocatalytic Degradation of Methylene Blue with ZnO Nanoparticles; a Joint Experimental and Theoretical Study, J. Mex. Chem. Soc., 2017, 60 DOI:10.29356/jmcs.v60i4.115.
- M. Pavel, C. Anastasescu, R.-N. State, A. Vasile, F. Papa and I. Balint, Photocatalytic Degradation of Organic and Inorganic Pollutants to Harmless End Products: Assessment of Practical Application Potential for Water and Air Cleaning, Catalysts, 2023, 13, 380, DOI:10.3390/catal13020380.
- F. El-Sayed, M. S. A. Hussien, M. I. Mohammed, V. Ganesh, T. H. AlAbdulaal, H. Y. Zahran, I. S. Yahia, H. H. Hegazy, M. Sh. Abdel-wahab and M. Shkir, et al., The Photocatalytic Performance of Nd2O3 Doped CuO Nanoparticles with Enhanced Methylene Blue Degradation: Synthesis, Characterization and Comparative Study, Nanomaterials, 2022, 12, 1060, DOI:10.3390/nano12071060.
- M. S. A. Hussien, Facile Synthesis of Nanostructured Mn-Doped Ag3PO4 for Visible Photodegradation of Emerging Pharmaceutical Contaminants: Streptomycin Photodegradation, J. Inorg. Organomet. Polym., 2021, 31, 945–959, DOI:10.1007/s10904-020-01831-z.
- A. N. Kadam, T. G. Kim, D. S. Shin, K. M. Garadkar and J. Park, Morphological Evolution of Cu Doped ZnO for Enhancement of Photocatalytic Activity, J. Alloys Compd., 2017, 710, 102–113, DOI:10.1016/j.jallcom.2017.03.150.
- M. Ramesh, CuO as Efficient Photo Catalyst for Photocatalytic Decoloration of Wastewater Containing Azo Dyes, Water Pract. Technol., 2021, 16, 1078–1090, DOI:10.2166/wpt.2021.067.
- T. S. Aldeen, H. E. Ahmed Mohamed and M. Maaza, ZnO Nanoparticles Prepared via a Green Synthesis Approach: Physical Properties, Photocatalytic and Antibacterial Activity, J. Phys. Chem. Solids, 2022, 160, 110313, DOI:10.1016/j.jpcs.2021.110313.
- J. Shi, J. Zheng and P. Wu, Preparation, Characterization and Photocatalytic Activities of Holmium-Doped Titanium Dioxide Nanoparticles, J. Hazard. Mater., 2009, 161, 416–422, DOI:10.1016/j.jhazmat.2008.03.114.
- Y. Zong, Z. Li, X. Wang, J. Ma and Y. Men, Synthesis and High Photocatalytic Activity of Eu-Doped ZnO Nanoparticles, Ceram. Int., 2014, 40, 10375–10382, DOI:10.1016/j.ceramint.2014.02.123.
|
| This journal is © The Royal Society of Chemistry 2024 |
Click here to see how this site uses Cookies. View our privacy policy here.  Open Access Article
 ab and
Md. Muktadir Billah*a
![[thin space (1/6-em)]](https://www.rsc.org/images/entities/char_2009.gif) :
:![[thin space (1/6-em)]](https://www.rsc.org/images/entities/char_2009.gif) 1 to the copper precursor. To get 1, 3 and 5 mol% F doped NPs, 0.0077 g, 0.023 g, and 0.038 g of NH4F were added to the precursor, respectively, following a period of 30 minutes of continuous stirring. Ethylene glycol was added as a chain transfer agent at a molar ratio of 6
1 to the copper precursor. To get 1, 3 and 5 mol% F doped NPs, 0.0077 g, 0.023 g, and 0.038 g of NH4F were added to the precursor, respectively, following a period of 30 minutes of continuous stirring. Ethylene glycol was added as a chain transfer agent at a molar ratio of 6![[thin space (1/6-em)]](https://www.rsc.org/images/entities/char_2009.gif) :
:![[thin space (1/6-em)]](https://www.rsc.org/images/entities/char_2009.gif) 1 to copper precursor and a dense gel was formed after 3 hours of stirring. Later, the solution was kept into the oven for 20 hours in a crucible for drying at 120 °C followed by grinding for production of finely powdered substance. The annealing process at 700 °C was followed for 1 hour to get the fluorine doped CuO NPs.
1 to copper precursor and a dense gel was formed after 3 hours of stirring. Later, the solution was kept into the oven for 20 hours in a crucible for drying at 120 °C followed by grinding for production of finely powdered substance. The annealing process at 700 °C was followed for 1 hour to get the fluorine doped CuO NPs.

![[1 with combining macron]](https://www.rsc.org/images/entities/char_0031_0304.gif) ), (111), (
), (111), (![[2 with combining macron]](https://www.rsc.org/images/entities/char_0032_0304.gif) 02), (020), (202), (
02), (020), (202), (![[1 with combining macron]](https://www.rsc.org/images/entities/char_0031_0304.gif) 13), (
13), (![[3 with combining macron]](https://www.rsc.org/images/entities/char_0033_0304.gif) 11), (220), (311) and (
11), (220), (311) and (![[2 with combining macron]](https://www.rsc.org/images/entities/char_0032_0304.gif) 22) were observed at 2θ values 32.636, 35.65, 38.85, 48.89, 53.43, 58.29, 61.65, 66.39, 68.16, 72.38, and 75.12, respectively, are in complete accord with JCPDS card no. 05-0661.24,29 All the nanoparticles showed diffraction patterns corresponding to the tenorite phase of copper oxide with a monoclinic structure. No diffraction peak was detected for fluorine-based phases or compounds like CuF and CuF2. This indicates either complete incorporation of fluorine in the crystal lattice or insignificant content of any fluorine-based compound below detection limit.30 Formation of cuprite (Cu2O) phase and metallic copper was evident from XRD patterns for higher mole percentage of dopant. XRD peaks for (020), (111) and (011) planes at 2θ values 42.23, 36.25 and 29.45 respectively, confirmed the presence of Cu2O phase with a cubic structure. Peaks for (111) and (200) planes at 2θ values 43.37 and 50.47 confirmed the presence of metallic copper, which was only detectable for 5 mol% doping. It can be explained in a way that on substitution of O2− ion by F− ion, a free electron is generated and readily transferred to Cu2+ ion resulting in its reduction into Cu+ ion in the second phase Cu2O.24 In addition to the formation of Cu2O for 3 and 5 mol% doping, continued reduction proceeded to the formation of metallic copper for 5 mol% dopant concentration. Crystallite size (D) was measured from Scherrer's formula,31
22) were observed at 2θ values 32.636, 35.65, 38.85, 48.89, 53.43, 58.29, 61.65, 66.39, 68.16, 72.38, and 75.12, respectively, are in complete accord with JCPDS card no. 05-0661.24,29 All the nanoparticles showed diffraction patterns corresponding to the tenorite phase of copper oxide with a monoclinic structure. No diffraction peak was detected for fluorine-based phases or compounds like CuF and CuF2. This indicates either complete incorporation of fluorine in the crystal lattice or insignificant content of any fluorine-based compound below detection limit.30 Formation of cuprite (Cu2O) phase and metallic copper was evident from XRD patterns for higher mole percentage of dopant. XRD peaks for (020), (111) and (011) planes at 2θ values 42.23, 36.25 and 29.45 respectively, confirmed the presence of Cu2O phase with a cubic structure. Peaks for (111) and (200) planes at 2θ values 43.37 and 50.47 confirmed the presence of metallic copper, which was only detectable for 5 mol% doping. It can be explained in a way that on substitution of O2− ion by F− ion, a free electron is generated and readily transferred to Cu2+ ion resulting in its reduction into Cu+ ion in the second phase Cu2O.24 In addition to the formation of Cu2O for 3 and 5 mol% doping, continued reduction proceeded to the formation of metallic copper for 5 mol% dopant concentration. Crystallite size (D) was measured from Scherrer's formula,31


![[1 with combining macron]](https://www.rsc.org/images/entities/char_0031_0304.gif) 11〉 and 〈111〉 and tabulated in Table 2.
11〉 and 〈111〉 and tabulated in Table 2.

![[1 with combining macron]](https://www.rsc.org/images/entities/char_0031_0304.gif) 1 1〉
1 1〉![[1 with combining macron]](https://www.rsc.org/images/entities/char_0031_0304.gif) 1 1〉
1 1〉![[1 with combining macron]](https://www.rsc.org/images/entities/char_0031_0304.gif) 11) and (111) planes are 0.00065, 0.0015 and 0.0007 which indicates the introduction of strain after fluorine doping.
11) and (111) planes are 0.00065, 0.0015 and 0.0007 which indicates the introduction of strain after fluorine doping.


 ), electron (e−), hole (h+) and hydroxyl radical (OH˙) are the four active species that contribute to photocatalytic dye degradation process. For assessing the underlying mechanism of the F doped CuO as photocatalyst under UV light irradiation, trapping tests for the active species were conducted during the photodegradation phase of 3 mol% F doped CuO, as depicted in the Fig. 14(a). To scavenge
  , e−, h+ and OH˙ active sites, ascorbic acid (AA), K2Cr2O7 (Cr2O72−), NaCl (Cl−) and C3H8O (IPA) were used, respectively.58–60 Based on the observation presented in Fig. 14(b), it is evident that the use of IPA as a trapping agent leads to a substantial reduction in photodegradation, up to 85%. Additionally, chloride ions (Cl−) have been observed to significantly mitigate degradation, resulting in a reduction of approximately 82%. Both AA and K2Cr2O7 also decreased the photocatalytic activity, although they were unable to suppress the photocatalytic activity as effectively as IPA and Cl− suggesting hydroxyl radicals and holes as the leading active species that control the photocatalytic activity of the F doped CuO nanoparticles.
 ) following eqn (9). The conduction band electrons can take part in reduction reaction with dye molecule or adsorbed O2 on nanoparticle surface or dissolved O2 in water. The holes in the valence band (VB) can effectively contribute to the oxidation of Rh B molecules and, simultaneously, can also oxidize water through their interaction with hydroxide ions (OH−) as in eqn (11) leading to the emergence of OH˙ radicals as shown in eqn (12). This oxidation process takes place since redox potential of H2O/OH˙ is lower than EV of CuO with respect to NHE. The collaborative efforts of both electrons and holes contribute to the process of decolorization, which eventually leads to the generation of damaged products. Based on provided information, the pertinent reactions occurring at the surface of CuO NPs that led to the degradation of dyes can be stated in the following manner as shown in eqn (8)–(17).61,62


