 Open Access Article
Possible formation of H2 hydrates in different nanotubes and surfaces using molecular dynamics simulation†
Mohsen Abbaspour *a,
Hamed Akbarzadeh
 b,
Sirous Salemia,
Somayeh Mazloomi-Moghadama and
Parnian Yousefic
aDep. of Chemistry, Hakim Sabzevari University, Sabzevar, Iran. E-mail: m.abbaspour@hsu.ac.ir
bDep. of Physical Chemistry, Faculty of Chemistry, Kharazmi University, Tehran, Iran
cDep. of Chemistry, Faculty of Science, Ferdowsi University of Mashhad, Mashhad, Iran
First published on 15th October 2024
Abstract
In this work, we simulated water molecules confined in carbon, boron nitride (BN), and silicon carbide (SiC) nanotubes with similar sizes. We also simulated water molecules confined between parallel graphene, BN, and SiC surfaces in two cases: (a) a similar geometric surface density of water of 0.177/Å2, in which the number of gas molecules was 18% of the total water molecules, and (b) a similar density profile of water of 0.04–0.05 dalton per Å3. To examine H2 hydrate formation, we added guest H2 molecules to the confined water molecules in the nanotube and surface systems. We analyzed the formed shapes, adsorption energies, radial distribution functions (RDFs), and self-diffusion coefficients of the confined molecules in gas hydrate formation. Our results showed that a more ordered heptagonal ice nanotube was formed in the BN nanotube than that in the other systems. After the addition of H2 molecules in the different nanotubes, some of the H2 molecules occupied the wall of the ice nanotube and some of them positioned in the hollow space. Although gas hydrates were created in all surface systems, ordered gas hydrate shapes were formed only in the graphene system. The adsorption energy for guest H2 molecules between the different surfaces was negative, which means that the formation of H2 hydrates between these surfaces is a spontaneous process (unlike that in the nanotube systems). According to RDF results, the BN nanotube and graphene surfaces are proper systems to form more ordered H2 hydrate structures. The confined water molecules have much higher diffusion coefficients in the BN nanotube and graphene surfaces than in the other systems. The F4 parameter also substantiated hydrate formation in the different nanostructures. In a new configuration of BN and SiC systems with density profiles similar to that of the graphene system, the H2 hydrate was not formed completely as in the case of the graphene system. H2 hydrates formed in the new BN and SiC surfaces were less than those formed in the primary structures (with a geometrical density similar to that of the graphene system) and the graphene system.
1. Introduction
Owing to their important energy and environmental implications, gas hydrates (clathrates) have attracted significant attention in the recent years.1 Gas hydrates are natural gas reserves. They have significant applications as gas storage media (such as H2).2–4 Scientists previously considered that the H2 molecule is very small and it cannot stabilize the host lattice structure of ice hydrates. However, Mao et al.5 demonstrated that hydrogen clathrates are stable at room temperature and high pressures. The interesting results obtained by Mao et al.5 led to subsequent investigations on gas clathrates as an environment for H2 storage.1,6,7 These investigations showed that water cages may present a clean and safe method to store H2 gas.The mechanism of formation of bulk hydrogen clathrates is still less understood because of the very long computational time required in molecular dynamics (MD) simulations and the imprecise monitoring of time and spatial domains of the crystallization process in the laboratory.8 Furthermore, the nanoscale environment allows spontaneous formation of some low-dimensional ice and gas clathrate structures.9–11 Moreover, the knowledge of transport of gases and their physiochemical interactions in nanoscales help us to design more efficient methods for gas storage processes at the nanopores.12 Among different nanopores, carbon nanotubes (CNTs) have attracted much attention among scientists in recent years because of their interesting physical properties and significant potential applications such as gas clathrate formation.12,13 Recently, Zhao et al.1 have investigated the H2 hydrate formation in different CNTs and reported that the confined H2 molecules in the gas clathrates formed a molecular wire. We have also recently studied methane clathrate formation in different CNTs and demonstrated that the water molecules are replaced by the gas molecules in the ice nanotubes.14 More recently, we have studied methane clathrate formation in different fullerenes and found that the formation of methane hydrate in fullerene is favorable.15
In this work, we initially modelled confined water molecules in different nanotubes. After that, we added guest H2 molecules in the nanotubes to examine the formation of gas clathrates. We also examined the H2 hydrate formation between different surfaces. We also examined different properties including adsorption energy, radial distribution function (RDF) and self-diffusion coefficients of the confined molecules during the gas hydrate formation.
2. Simulation method
In the first part, we initially simulated 126 water molecules in (16, 0) CNTs with a length of 50 Å (according to the work by Zhao et al.1). Then, we simulated 126 water molecules and 18H2 molecules in the CNT, to examine the gas hydrate formation.1 We also repeated these simulations for 108 water molecules and 36H2 molecules.1 The simulations for pure water and water + gas mixtures in the CNTs were initially run at 1000 K for 1 ns to overcome the initial configurations. Then, the systems were equilibrated at 250 K for 20 ns.1 In our simulations, the nanotube was kept in a fixed position.1,14,16 We also repeated these simulations in boron nitride (BN) and silicon carbide (SiC) nanotubes with similar geometrical lengths and diameters.In the second part, we initially simulated 210 water molecules confined between fixed parallel graphene surfaces (with parallelogram shape) with dimensions of 35.3 and 36.7 Å and an interlayer distance of 8 Å (a fixed geometric volume of 9137.55 Å3). Then, we simulated 210 water molecules and 38H2 molecules confined between the graphene plates. The number of water molecules was chosen as 17.7/nm2 of the surface, according to the work by Bai and Zeng.11 The number of gas molecules was chosen as 18% of the total water molecules. The systems were initially equilibrated at T = 1000 K to overcome the initial arrangements and then subjected to an instant quench at T = 230 K. Then, the systems experienced incremental step annealing and reheating cycles (230 → 235 → 240 → 245 → 250 → 245 → 240 → 235 → 230 K) for which each incremental step takes 1 ns. Then, the systems were equilibrated for 10 ns at 230 K and then 10 ns at 250 K. Finally, all systems were equilibrated for 10 ns at 270 K. The simulations for pure water and the water + gas mixture between the graphene plates were also repeated for parallel BN and SiC surfaces with similar geometrical dimensions and interlayer distances, i.e. a surface density water of 0.177/Å2 in which the number of gas molecules was 18% of the total water molecules. The snapshots of all nanotubes and surfaces used in this work are presented in Fig. S1 in the ESI.† We also investigated the hydrate formation in BN and SiC surfaces at similar density profiles of the graphene surfaces (and not in the similar geometrical density), i.e. at a density of 0.04–0.05 dalton per Å3. In order to do this, we increased the distance between the BN and SiC surfaces (because of a larger atomic diameter of N and Si than that of C) and repeated the simulations with similar numbers of water and H2 molecules.
All of the simulations were performed in the NVT ensemble and a Nosé–Hoover thermostat was used with a relaxation time of 0.1 ps. We used the DL_POLY software17 with the Verlet leapfrog algorithm with a time step of 1 fs. For electrostatic interactions, we used the Ewald summation technique. The cutoff distance was 12 Å. Periodic boundary conditions were applied in all three directions. To avoid artificial influence from periodic images, the nanotubes and plates were positioned at the center of a simple orthorhombic box with vacuum on both sides separating it from the next periodic image in the Z direction.
The SPC/E and TIP5P models were used for the confined water molecules in the nanotube and surface systems, respectively (according to the previous simulations on gas hydrates11,13). Hydrogen molecules were modelled by a rigid two center 12–6 Lennard-Jones (LJ) potential with a bond length of 0.074 nm and parameters of εH = 0.1039 kJ mol−1 and σH = 0.259 nm.18 The 12–6 LJ parameters for B, N, and Si atoms were from ref. 19. The 12–6 LJ parameters for all the heterogeneous interactions were obtained by utilizing the geometric mean for ε and the arithmetic mean for σ.20 Bai et al.11 have successfully simulated methane hydrates between graphene surfaces using the TIP5P model for water and the 12–6 LJ model for methane. They also used the 9–3 LJ potential for the gas–wall and water–wall interactions. Thus, we used the 9–3 LJ model for water–surface and gas–surface interactions. In order to do this, we fitted the 12–6 LJ model to the 9–3 LJ model for gas and water with different wall interactions (Fig. S2 in the ESI†). The water–carbon interaction was also computed by the 9–3 LJ model (σ = 2.4737 Å and ε = 1.2024 kcal mol−1).11
3. Results and discussion
3.1 H2 hydrate formation in the nanotubes
We initially simulated 126 water molecules in the C, BN, and SiC nanotubes, and the final configurations after 20 ns of simulation times are given in Fig. 1. We also present the simulation results of 108 water molecules in different nanotubes in Fig. 1. In accordance with the simulations results of Zhao et al. on water molecules in the (16, 0) CNT,1 the water molecules create a heptagonal ice nanotube in the CNT and a row of confined water molecules are positioned in the middle space of the CNT. Our results for the other nanotubes showed that a more ordered heptagonal ice nanotube is formed in the SiC and BN nanotubes (especially in the BN nanotube), which is due to the stronger water–wall interactions in the BN and SiC nanotubes than that in the CNT. By decreasing the water molecules from 126 to 108, the number of confined water molecules in the middle space of the tubes decreases, so that the water molecular wire in the middle space disappears for the SiC system. However, the less ordered heptagonal shapes are formed in the 108 water molecule systems than those of the 126 water molecules.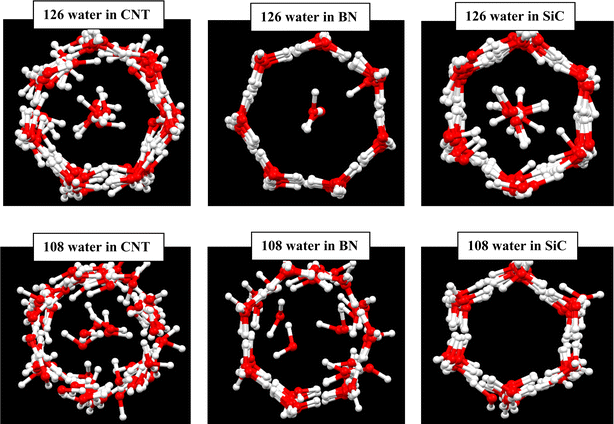 | ||
| Fig. 1 Ice nanotube formed in the different nanotubes with similar sizes. The oxygen atoms are shown in red color and hydrogen atoms in white. | ||
After addition of 18H2 molecules in the different nanotubes containing 126 water molecules, some of the H2 molecules occupied the wall of the ice nanotube and some of them were positioned in the hollow space (Fig. 2). It is shown that the number of the H2 molecules in the hollow space is more for the BN nanotube. This is due to the fact that the stronger water–wall interactions do not allow the guest H2 molecules to replace the water molecules in the wall of the ice tube. It is also shown that the heptagonal structure of ice nanotube disappeared for the CNT and SiC nanotubes but not for the BN nanotube, which is also due to the stronger water–BN interactions than the other interactions. After addition of 36H2 molecules in the different nanotubes containing 108 water molecules, most of H2 molecules occupied the hollow space, so that there were not any water molecules in the middle space in the CNT and BN nanotube, whereas the reverse trend was observed for the SiC nanotube in which most of the H2 molecules were positioned in the ice nanotube wall (Fig. 2). Another interesting phenomenon is the near-complete cylinder shape, which was formed for the SiC nanotube. Previous investigations showed that the gas–water (ice) nanotube interactions play significant roles in the structure of the created gas hydrates.21 Duo to the competition between the gas–nanotube wall interactions and the hydrogen bond (HB) network in the ice nanotube. The confined water molecules try to keep the HB network in the ice nanotube, but the H2 gas molecules reduce the number of the HBs between the confined water molecules.13
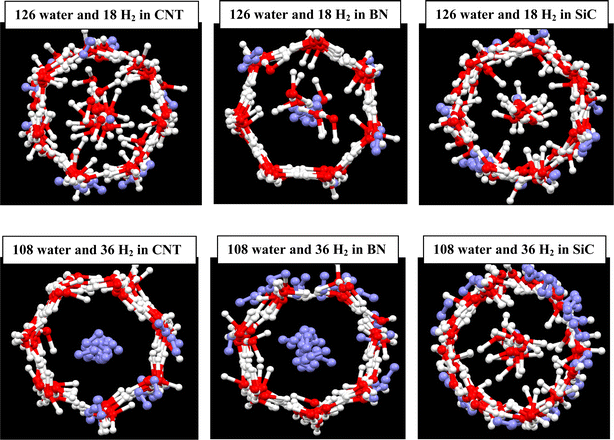 | ||
| Fig. 2 H2 clathrate formed in the different nanotubes. The oxygen atoms are shown in red color, hydrogen atoms in white, and hydrogen molecules in violet. | ||
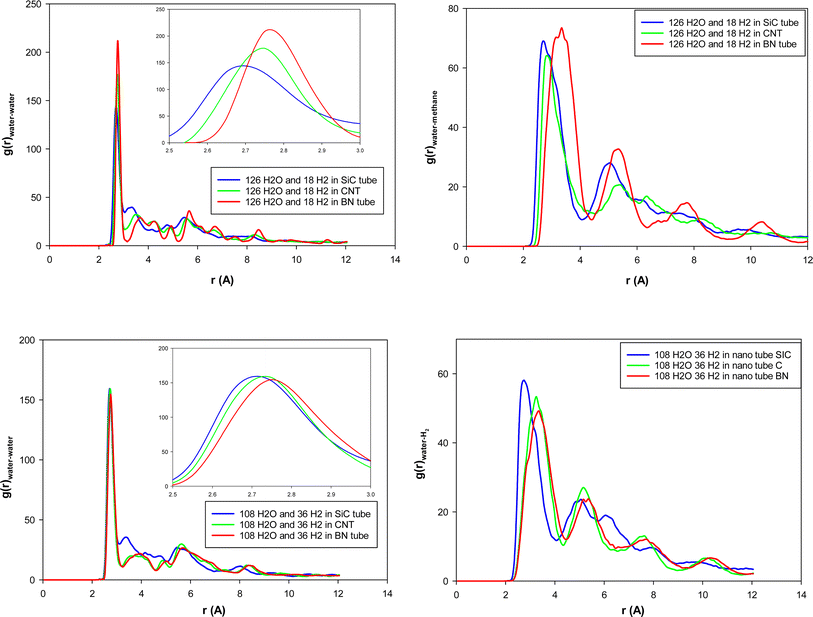
The role of guest H2 molecules in the confined space of the nanotubes is to compete with water molecules which interact with each other by hydrogen bonding (HB). Therefore, the guest gas molecules affect the structure of the water molecules and their HB network, which result in a longer distance between the confined water molecules.13 To deeply investigate the structural properties of the confined molecules during the H2 hydrate formation, it is better to compute the RDFs between the oxygen atoms of the confined water molecules using the following equation:22
 | (1) |
According to Fig. 3, the first peaks of water–water and water–methane RDFs for the BN nanotube appear at longer distances than the CNT and the SiC nanotube for both 126 and 108 water molecule systems. Moreover, those peaks of the CNT appear at longer distances than those of the SiC nanotube. This result relates to the fact that the BN nanotube and CNT are better systems for H2 hydrate structure formation than the SiC nanotube (the BN nanotube is the best).13 The gas hydrate structure has a more ordered structure than the gas–water mixture without formation of gas hydrates, in which the distance between the water molecules (and also gas molecules) increases, and therefore, the water–water RDF appears at larger distances. To more examine these results, for instance, we calculated the adsorption energies of 18H2 molecules into 126 water molecules in different nanotubes using the following equation:
 | (2) |
According to eqn (2), the adsorption energy for the BN nanotube was 3.33 (kcal mol−1), for the CNT was 10.726 (kcal mol−1), and for the SiC nanotube was 51.637 (kcal mol−1) per hydrogen molecule. These results indicate that the adsorption energy for guest H2 molecules is positive, which is in agreement with the results obtained by Zhao et al.,1 in which they reported that the interaction energy between two H2 molecules and the ice nanotube (with 128 water molecules) is positive. The results also indicate that the BN system is more favorable than the other systems for gas hydrate formation (it is less positive).
To examine the dynamical behavior of the confined water molecules during the gas hydrate formation, we calculated the self-diffusion coefficients using the mean square displacement (MSD) from the following formula22 using the modified VMD software:23
 | (3) |
| System | D (10−9 m2 s−1) |
|---|---|
| 126H2O | |
| CNT | 0.0051 |
| BN | 0.0070 |
| SiC | 0.0055 |
![[thin space (1/6-em)]](https://www.rsc.org/images/entities/char_2009.gif) |
|
| 126H2O + 18H2 | |
| CNT | 0.0044 |
| BN | 0.0289 |
| SiC | 0.0096 |
We also calculated the MSD curves of the confined H2 molecules in the different nanotubes, and they are presented in Fig. S3 in the ESI.† Similarly to the confined water molecules, this figure shows that the confined H2 molecules have a greater diffusion coefficient in the BN nanotube than in the other nanotubes.
3.2 H2 hydrate formation between the surfaces
We initially simulated 210 water molecules confined between parallel C, BN, and SiC surfaces with an interlayer distance of 8 Å. Then, we simulated 210 water molecules and 38H2 molecules confined between the different plates. The corresponding snapshots are presented in Fig. 4 (using the method described in the simulation details). As Fig. 4 shows, although the gas hydrates were created in all systems, the ordered gas hydrate shapes were formed only in the graphene system. In comparison with the simulation work by Bai and Zeng11 on the methane hydrate formation between graphene plates with similar interlayer distances, we used lower temperature ranges (they used 270–320 K range). The lower temperature range in the H2 hydrate is due to the weaker H2 interactions than CH4 interactions. The reason why the ordered gas hydrate shapes were not formed in the BN and SiC systems may be the stronger water–surface interactions in these systems than the graphene in which the confined water molecules do not tend to destroy their ordered HB networks (please compare the ordered HB network in pure water systems in BN and Sic with the graphene in Fig. 4).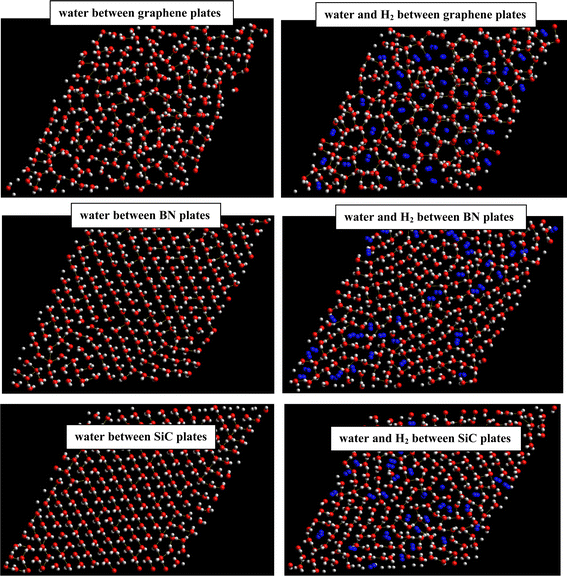 | ||
| Fig. 4 Ice and H2 clathrate structures formed between different surface systems. The oxygen atoms are shown in red color, hydrogen atoms in white, and H2 molecules in blue. | ||
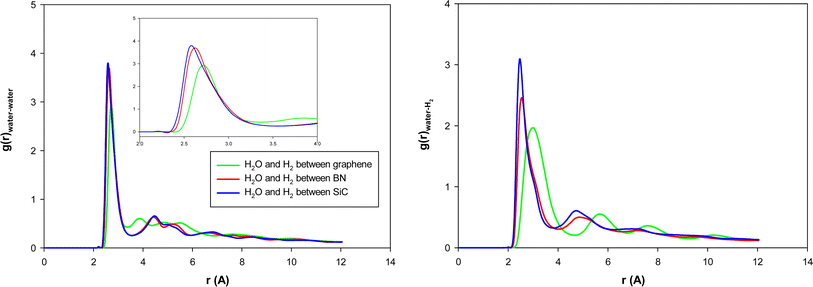
We present the water–water and water–gas RDFs for the confined molecules in the different surface systems in Fig. 5. It is shown that the first peaks of water–water and water–methane RDFs for graphene surfaces appear at longer distances than the BN and SiC surfaces. Moreover, those peaks of the BN nanotube appear at longer distances than those of the SiC nanotube. Therefore, the graphene surfaces are better systems for H2 hydrate formation than the SiC and BN. This result is in agreement with Fig. 4, in which we observe that the ordered gas hydrate shapes are formed only for the graphene system. To better examine these results, we also calculated the adsorption energies of 38H2 molecules into 210 water molecules in different systems. The adsorption energy for the BN nanotube was −22.868 (kcal mol−1), for the CNT was −17.974 (kcal mol−1), and for the SiC nanotube was −11.989 (kcal mol−1) per hydrogen molecule. These results show that the adsorption energy for guest H2 molecules between the different surfaces is negative, which means that the formation of H2 hydrate between these surfaces is a spontaneous process (unlike the nanotube systems). The energy results also indicate that the BN system is more favorable than the other systems for gas hydrate formation, which is in agreement with the nanotube results. However, the gas hydrate shapes are more ordered in the graphene system than the BN surfaces. The more negative adsorption energy in the BN system is due to the stronger molecule–surface interactions in the BN system than in the graphene.
To examine the dynamical behavior of the confined molecules during the gas hydrate formation, we also present the self-diffusion coefficients of confined water molecules in different systems in Table 2. As this table shows, the confined water molecules have much higher diffusion coefficients in the graphene system than in the other systems, which confirms the formation of gas clathrates in the graphene system more than the other surfaces.
| System | D (10−9 m2 s−1) |
|---|---|
| 210H2O | |
| Graphene | 0.1079 |
| BN | 0.0037 |
| SiC | 0.0081 |
![[thin space (1/6-em)]](https://www.rsc.org/images/entities/char_2009.gif) |
|
| 210H2O + 38H2 | |
| Graphene | 0.1055 |
| BN | 0.0101 |
| SiC | 0.0077 |
We also calculated the MSD curves of the confined H2 molecules between the different surfaces, and they are presented in Fig. S4 in the ESI.† Similarly to the confined water molecules, this figure shows that the confined H2 molecules have a greater diffusion coefficient between the graphene surfaces than the other plates.
3.3 Criteria of H2 hydrate formation
The four-body structural order (F4φ) evaluates the degree of gas–hydrate formation:24
 | (4) |
| System | F4 | Ring-5 | Ring-6 |
|---|---|---|---|
| 126H2O and 18H2 in BN nanotube | 0.02 | 1 | 1 |
| 126H2O and 18H2 in CNT | 0.03 | 9 | 10 |
| 126H2O and 18H2 in SiC nanotube | 0.06 | 2 | 2 |
| 210H2O and 38H2 between BN surfaces | 0.11 | 18 | 13 |
| 210H2O and 38H2 between graphene surfaces | 0.07 | 25 | 19 |
| 210H2O and 38H2 between SiC surfaces | 0.09 | 31 | 32 |
According to this table, the formed rings and the positive F4 values indicate that the gas hydrates are formed in all of the nanostructures. However, the most proper systems to gas–hydrate formation in this table are not exactly in agreement with the RDF, self-diffusion, and adsorption energy results. This can be due to the confinement effect in the nanotubes and between the nano-sheets in which there are not enough space to form the normal hydrate ring and cages.
3.4 Density profile and pressure of the confined systems
We present the density profile of the confined water molecules for the nanotubes and surfaces systems in Fig. S5 in the ESI.† According to this figure, the confined water molecules have almost similar densities in the different nanotubes. It is also shown that the water molecules confined between the graphene plates have a lower density than that of the BN and SiC surfaces. We also present the perpendicular and lateral components of the pressure tensor of the confined water molecules in the different systems in Table S1 in the ESI.† The lateral components of the pressure tensor are as follows:
 | (5) |
According to Table S1,† the confined water molecules in the different nanotubes experience almost a similar order of pressure values (the negative values may relate to the bubble formation in the nano-confinement26). It is also shown that the confined water molecules between the graphene surfaces experience lower pressures than those of the BN and SiC surfaces. This result is in agreement with the density profile presented in Fig. S5.† Although the different systems have a similar geometrical density, the different atomic diameter and different water–surface interactions lead to the different density profiles and pressure values.
We also investigated the hydrate formation in BN and SiC surfaces at a similar density profile of the graphene surfaces, i.e. at a density of 0.04–0.05 dalton per Å3, and repeated the simulations with similar numbers of water and H2 molecules. The corresponding results of density profiles are presented in Fig. S6 in the ESI.† As this figure shows, the new configuration of BN and SiC systems has a density profile similar to that of the graphene system. We also present the perpendicular and lateral components of the pressure tensor of the confined water molecules in the new BN and SiC systems in Table S2 in the ESI.† We also compared the results with those of the graphene system. According to Table S2,† the confined water molecules in the new BN and SiC systems experience almost a similar order of pressure values to those of the graphene system. Despite the similar density profile and pressure of the new BN and SiC configurations, the snapshots in Fig. 6 show that the H2 hydrate has not been formed completely, as formed in the case of the graphene system.
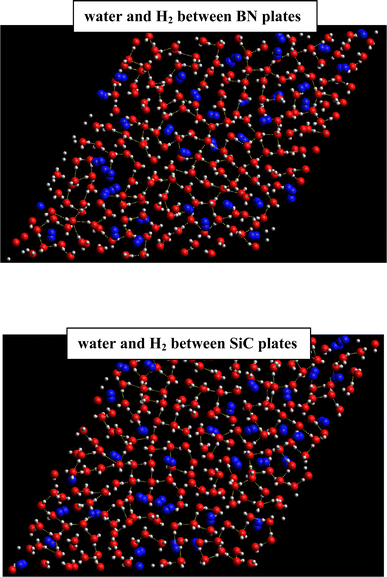 | ||
| Fig. 6 H2-clathrate structures formed between new BN and SiC surface systems. The oxygen atoms are shown in red color, hydrogen atoms in white, and H2 molecules in blue. | ||
The F4 parameter and the formed rings were also calculated for the new BN and SiC systems, and the results are presented in Table 4.
| System | F4 | Ring-5 | Ring-6 |
|---|---|---|---|
| 210H2O and 38H2 between BN surfaces | 0.026 | 5 | 2 |
| 210H2O and 38H2 between SiC surfaces | 0.055 | 1 | 3 |
According to this table, the gas hydrates were formed in the new BN and SiC systems. However, according to Tables 1 and 2, the H2 hydrates in the new BN and SiC surfaces were formed less than those of the primary structures (with a similar geometrical density to that of the graphene system) and also less than those of the graphene system. The reason why the gas hydrates were not formed completely and orderly (as the graphene system) is the stronger water–surface interaction in the BN and SiC systems than in the graphene system. According to the snapshots in Fig. 7 in which we present the side views of the hydrogen clathrates in different systems, the hydrogen molecules in the graphene system were positioned between the two water (ice) layers, which indicates the formation of ordered gas clathrates, whereas the hydrogen molecules were positioned in outer layers and not between the ice layers, because of the stronger wall–hydrogen molecules in the BN and SiC systems than in the graphene system.
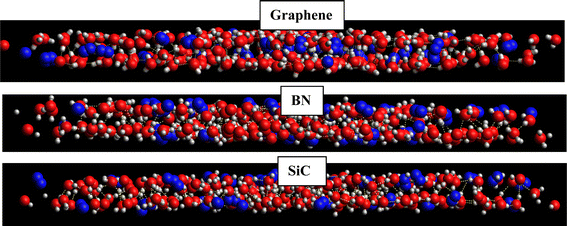 | ||
| Fig. 7 Snapshots of the side view of the formed H2-clathrate structures in the different systems. The oxygen atoms are shown in red color, hydrogen atoms in white, and H2 molecules in blue. | ||
4. Concluding remarks
In this work, we have simulated water molecules confined in the C, BN, and SiC nanotubes with similar sizes. We have also simulated water molecules confined between parallel C, BN, and SiC surfaces in two cases: (a) a similar geometric surface density of water of 0.177/Å2 in which the number of gas molecules was 18% of the total water and (b) a similar density profile of water of 0.04–0.05 dalton per Å3. To examine the H2 hydrate formation, we have also added guest H2 molecules to the confined water molecules in the nanotube and surface systems. After analyzing the shape, adsorption energy, RDF, and self-diffusion coefficients, the following important results have been obtained:(1) The water molecules create a heptagonal ice nanotube in the CNT and a row of confined water molecules positioned in the middle space of the CNT. The more ordered heptagonal ice nanotube is formed in the SiC and BN nanotubes (especially in the BN nanotube).
(2) After the addition of 18H2 molecules in the different nanotubes, some of the H2 molecules occupied the wall of the ice nanotube and some of them were positioned in the hollow space.
(3) An interesting phenomenon is the near-complete cylinder shape, which was formed for the 108 water and 36H2 in the SiC nanotube.
(4) The first O–O RDF peaks for H2-containing nanotubes and surfaces appear at larger distances than those of the pure water systems. It is also shown that the first peaks of water–water and water–methane RDFs for the BN nanotube appear at longer distances than that of the CNT and SiC nanotube for both 126 and 108 water molecule systems. Therefore, the BN nanotube is the best system for H2 hydrate formation than the SiC nanotube and CNT.
(5) The adsorption energy for guest H2 molecules in the different nanotubes is positive.
(6) The confined water molecules have much higher diffusion coefficients in the BN nanotube than in the other systems.
(7) Although the gas hydrates have been created in all surface systems, the ordered gas hydrate shapes have been formed only in the graphene system.
(8) The first peaks of water–water and water–methane RDFs for graphene surfaces appear at longer distances than that of the BN and SiC surfaces. Therefore, the graphene surfaces are the better system for H2 hydrate formation than the SiC and BN nanotubes. This result is in agreement with the ordered gas hydrate shapes formed only for the graphene system.
(9) The adsorption energy for guest H2 molecules between the different surfaces is negative, which means that the formation of H2 hydrate between these surfaces is a spontaneous process (unlike the nanotube systems). The energy results also indicate that the BN system is more favorable than the other systems for gas hydrate formation, which is in agreement with the nanotube results.
(10) The gas hydrate shapes are more ordered in the graphene system than in the BN surfaces. The more negative adsorption energy in the BN system is due to the stronger molecule–surface interactions in the BN system than in the graphene.
(11) The confined water molecules have much higher diffusion coefficients in the graphene system than in the other systems, which confirms the formation of gas clathrates in the graphene system more than that in the other surfaces.
(12) The formed rings and the positive F4 values indicate that the gas hydrates have been formed in all of the nanostructures.
(13) The confined water molecules between BN and SiC surfaces with similar geometric densities show higher density profiles than that of the graphene system.
(14) In the new configuration of BN and SiC systems with similar density profiles to that of the graphene system, the H2 hydrate has not been formed completely as in the case of the graphene system. The H2 hydrates in the new BN and SiC surfaces have also formed less than those of the primary structures (with a similar geometrical density to that of the graphene system) and also less than that of the graphene system. This is due to the stronger water–surface interactions in the BN and SiC systems than in the graphene system.
Data availability
The data supporting this article have been included within the paper and its ESI.†Conflicts of interest
There are no conflicts to declare.References
- W. Zhao, L. Wang, J. Bai, J. S. Francisco and X. C. Zeng, Spontaneous formation of one-dimensional hydrogen gas hydrate in carbon nanotubes, J. Am. Chem. Soc., 2014, 136(30), 10661–10668 CrossRef CAS PubMed.
- H. Lee, J. W. Lee, D. Y. Kim, J. Park, Y. T. Seo, H. Zeng, I. L. Moudrakovski, C. I. Ratcliffe and J. A. Ripmeester, Tuning clathrate hydrates for hydrogen storage, Nature, 2005, 434(7034), 743–746 CrossRef CAS PubMed.
- V. V. Struzhkin, B. Militzer, W. L. Mao, H. K. Mao and R. J. Hemley, Hydrogen storage in molecular clathrates, Chem. Rev., 2007, 107(10), 4133–4151 CrossRef CAS PubMed.
- G. S. Smirnov and V. V. Stegailov, Toward determination of the new hydrogen hydrate clathrate structures, J. Phys. Chem. Lett., 2013, 4(21), 3560–3564 CrossRef CAS.
- W. L. Mao, H. K. Mao, A. F. Goncharov, V. V. Struzhkin, Q. Guo, J. Hu, J. Shu, R. J. Hemley, M. Somayazulu and Y. Zhao, Hydrogen clusters in clathrate hydrate, Science, 2002, 297(5590), 2247–2249 CrossRef CAS PubMed.
- P. S. Prasad, T. Sugahara, A. K. Sum, E. D. Sloan and C. A. Koh, Hydrogen storage in double clathrates with tert-butylamine, J. Phys. Chem. A, 2009, 113(24), 6540–6543 CrossRef CAS PubMed.
- T. Sugahara, J. C. Haag, P. S. Prasad, A. A. Warntjes, E. D. Sloan, A. K. Sum and C. A. Koh, Increasing hydrogen storage capacity using tetrahydrofuran, J. Am. Chem. Soc., 2009, 131(41), 14616–14617 CrossRef CAS PubMed.
- M. R. Walsh, C. A. Koh, E. D. Sloan, A. K. Sum and D. T. Wu, Microsecond simulations of spontaneous methane hydrate nucleation and growth, Science, 2009, 326(5956), 1095–1098 CrossRef CAS PubMed.
- W. H. Zhao, J. Bai, L. F. Yuan, J. Yang and X. C. Zeng, Ferroelectric hexagonal and rhombic monolayer ice phases, Chem. Sci., 2014, 5(5), 1757–1764 RSC.
- J. Bai, C. A. Angell and X. C. Zeng, Guest-free monolayer clathrate and its coexistence with two-dimensional high-density ice, Proc. Natl. Acad. Sci. U. S. A., 2010, 107(13), 5718–5722 CrossRef PubMed.
- J. Bai and X. C. Zeng, Polymorphism and polyamorphism in bilayer water confined to slit nanopore under high pressure, Proc. Natl. Acad. Sci. U. S. A., 2012, 109(52), 21240–21245 CrossRef CAS PubMed.
- M. Shahbabaei and D. Kim, Assessment of hydrate formation, storage capacity, and transport properties of methane and carbon dioxide through functionalized carbon nanotube membranes, J. Phys. Chem. C, 2021, 125(18), 10011–10026 CrossRef CAS.
- M. Abbaspour, F. Fotourechi, H. Akbarzadeh and S. Salemi, Investigation of small inhibitor effects on methane hydrate formation in a carbon nanotube using molecular dynamics simulation, RSC Adv., 2023, 13(10), 6800–6807 RSC.
- H. Akbarzadeh, M. Abbaspour, S. Salemi and A. Nazarian, Formation of methane clathrates in carbon nanotubes: a molecular dynamics study, New J. Chem., 2018, 42(9), 7083–7095 RSC.
- M. Abbaspour, H. Akbarzadeh, S. Salemi and S. F. Tahami, Formation of methane clathrates into fullerene: A molecular dynamics study, J. Mol. Liq., 2022, 367, 120587 CrossRef CAS.
- M. Abbaspour, H. Akbarzadeh, S. Salemi and L. Bahmanipour, Structure, dynamics, and morphology of nanostructured water confined between parallel graphene surfaces and in carbon nanotubes by applying magnetic and electric fields, Soft Matter, 2021, 17(11), 3085–3095 RSC.
- W. Smith, T. R. Forester, and I. T. Todorov, The DL_POLY molecular simulation package, CCLRC, Daresbury Laboratory, Daresbury, Warrington, England, 1999 Search PubMed.
- R. F. Cracknell, Molecular simulation of hydrogen adsorption in graphitic nanofibres, Phys. Chem. Chem. Phys., 2001, 3(11), 2091–2097 RSC.
- T. A. Hilder and J. M. Hill, Theoretical comparison of nanotube materials for drug delivery, Micro Nano Lett., 2008, 3(1), 18–24 CrossRef CAS.
- H. Mosaddeghi, S. Alavi, M. H. Kowsari and B. Najafi, Simulations of structural and dynamic anisotropy in nano-confined water between parallel graphite plates, J. Chem. Phys., 2012, 137(18), 184703 CrossRef PubMed.
- H. Tanaka and K. Koga, Formation of ice nanotube with hydrophobic guests inside carbon nanotube, J. Chem. Phys., 2005, 123(9), 094706 CrossRef PubMed.
- F. Taherkhani and B. Minofar, Effect of nitrogen doping on glass transition and electrical conductivity of [EMIM][PF6] ionic liquid encapsulated in a zigzag carbon nanotube, J. Phys. Chem. C, 2017, 121(29), 15493–15508 CrossRef CAS.
- T. Giorgino, Computing diffusion coefficients in macromolecular simulations: the Diffusion Coefficient Tool for VMD, J. Open Source Softw., 2019, 4(41), 1698 CrossRef.
- Y. Lin, Y. Hao, Q. Shi, Y. Xu, Z. Song, Z. Zhou, Y. Fu, Z. Zhang and J. Wu, Enhanced formation of methane hydrates via graphene oxide: Machine learning insights from molecular dynamics simulations, Energy, 2024, 289, 130080 CrossRef CAS.
- F. Mahmoudinobar and C. L. Dias, GRADE: A code to determine clathrate hydrate structures, Comput. Phys. Commun., 2019, 244, 385–391 CrossRef CAS.
- E. Jalalitalab, M. Abbaspour and H. Akbarzadeh, Thermodynamic, structural, and dynamical properties of nano-confined water using SPC/E and TIP4P models by molecular dynamics simulations, New J. Chem., 2018, 42(19), 16258–16272 RSC.
Footnote |
| † Electronic supplementary information (ESI) available. See DOI: https://doi.org/10.1039/d4ra00064a |
| This journal is © The Royal Society of Chemistry 2024 |

