 Open Access Article
Conversion of carbon black recovered from waste tires into activated carbon via chemical/microwave methods for efficient removal of heavy metal ions from wastewater†
M. M.
El-Maadawy
 a,
Amir A.
Elzoghby
 *a,
Ahmed M.
Masoud
 *a,
Alzahraa M.
Eldeeb
b,
Ahmed M. A.
El Naggar
 c and
Mohamed H.
Taha
 a
a
aNuclear Materials Authority, PO Box 530, El Maddi, Cairo, Egypt. E-mail: amirelzoghby33@gmail.com; chemmaso010@hotmail.com
bChemistry Department, Faculty of Science, Mansoura University, Mansoura, Egypt
cEgyptian Petroleum Research Institute (EPRI), 1 Ahmed El-Zomor St., Nasr City, Cairo, Egypt
First published on 20th February 2024
Abstract
In this research study, recovered carbon black (rCB) was obtained via pyrolysis of waste tires. The obtained rCB was then converted into activated carbon species through both chemical treatment and microwave coupled with chemical treatment as a two-step activation process. The activated carbon obtained from chemical activation was denoted as C-AC, while that obtained from exposure to microwave followed by chemical activation was labeled as MC-AC. These two structures were consequently introduced as sorbents for the removal of cadmium ions from an aqueous solution. The structural characteristics of the introduced adsorbents were confirmed using various techniques, namely X-ray diffraction (XRD), Fourier-transform infrared (FTIR) spectroscopy, and energy-dispersive X-ray (EDX) spectroscopy. Additionally, textual features of these adsorbents were acquired via both scanning electron microscopy (SEM) and N2 adsorption–desorption BET surface area analyses. These two structures were then introduced for Cd ion adsorption under different operating conditions. Particularly, the effect of pH, contact time, adsorbent dose, and metal ion concentration on the efficiency of adsorption was investigated. The 1maximum adsorption capacity was detected at a pH value of 5.0, a contact time of 30 min, a sorbent dose of 0.4 g L−1, and an initial metal concentration of 50 mg L−1 using MC-AC, which exhibited nearly double the sorption capacity detected for C-AC. Kinetic studies indicated that the process of Cd(II) adsorption is perfectly described and fitted by the pseudo-second-order model. However, adsorption isotherms for the two adsorbents were found to match the Langmuir model, referring to the occurrence of uniform monolayer adsorption for the metal ions. Thermodynamic analysis demonstrated that the adsorption process was spontaneous and endothermic.
1. Introduction
In the past few decades, ecological contamination has posed an increasingly serious threat worldwide due to the introduction of persistent pollutants from diverse activities such as mining operations, paint industries, and agricultural runoffs. Continuous release of such pollutants has, in turn, led to the contamination of water, air, and soil.1 One of these pollutants is cadmium metal, which is generally released into the environment by paint/pigment industries and is considered a toxic substance. Therefore, it has been necessary to find applicable cost-effective techniques to get rid of these toxins and ensure the safety of flora and fauna.2 However, big challenges are encountered by these industries to identify the most effective and economically beneficial methods to remove the traces of such heavy metals from waste samples.3,4Various methods including precipitation, adsorption, oxidation, and nano-filtration have been extensively used for separating heavy metal ions from aquatic flows. Among those methods, adsorption has been well documented as an economical and effective technique for eliminating heavy metal ions from aqueous solutions. Thus, it is one of the most widely employed routes for such purposes owing to its adaptability, low cost, ease of processing, and limited generation of secondary wastes.5–8
Several structures have been utilized as adsorbents for the removal of heavy metals from wastewater; however, activated carbons (ACs) stand as one of the most efficient materials in such process. ACs offer several advantages including large inter-particulate surface area, controllable pore structure, thermo-stability, low acid/base reactivity, and highly modifiable surface chemistry.9,10 Nevertheless, the use of commercial AC grades in wastewater remediation can add extra operating costs. Therefore, the utilization of affordable precursors, in particular biomass-based wastes such as agricultural and industrial remains, in the production of ACs has been strongly stimulated.11 Recovered carbon black (rCB) from waste tires can be considered state-of-the-art source for the production of economically viable and efficient activated carbon (AC) as an adsorbent material.12–14 Carbon black represents around 32%, by weight, of the waste tire composition; thus, its recovery and re-use in the production of ACs (as adsorbents) provide a proper solution for the problem of waste tire disposal.15 However, such a structure of carbon, which is obtained via pyrolysis of the waste tire, may have a reduced porous structure and limited specific surface area.16 Recent developments in the techniques of treating carbon black could help in the production of sustainable carbon species (with modified features) that could have a high potential for use as adsorptive materials.17
Microwave-assisted chemical treatment has been recently used as a substitute for traditional heating methods to produce activated carbon species.18 Microwave provides uniform temperature, and direct and fast heating, which are its advantages over traditional heating.19 High heating rates, no direct contact with the heated objects, small size of equipment, and reduced time/energy consumption are other benefits of heating by microwave, compared to conventional methods.20 Therefore, the produced structures of activated carbon through the use of microwaves have demonstrated similar chemical and textural properties to those obtained via conventional heating methods; however, preparation time is significantly shortened.21–24 Hence, microwave technology can offer a promising route for the production of activated carbon from different raw materials.
The objective of the current study is to investigate the behavior of waste tire sub-driven activated carbons toward the adsorption of dissolved cadmium ions in an aqueous solution. The novelty of this research work is based on recovering carbon black particles from waste tires followed by their conversion into species of activated carbons for use as new adsorbents in the removal of cadmium cations from wastewater samples. The combination of microwave, oxidizing agent, and chemical activator to generate activated carbon structures from rCB is considered another novelty of this study. The structural and textural features of the presented adsorbents in this study were determined using various techniques such as scanning electron microscopy (SEM), Brunauer–Emmett–Teller (BET) analysis, Fourier-transform infrared (FTIR) spectroscopy, and X-ray diffraction (XRD). Furthermore, the kinetics, thermodynamics, and isotherms for the process of Cd ion adsorption were analyzed and presented in the current research work.
2. Experimental
2.1. Materials
The utilized raw material to produce the activated carbon species was obtained from waste tires of vehicles, collected from a local company that is located in Cairo, Egypt. Analytical grade CdSO4 purchased from Sigma-UK was used to prepare standard solutions (1000 mg L−1) of Cd(II). NaOH and HNO3, obtained from Adwic Ltd Egypt, were used to adapt the pH values of the Cd ion solutions.2.2. Preparation of activated carbons
The production of activated carbons was done through a two-stage process: carbonization of the raw materials to obtain particles of recovered carbon black (rCB), as a first step, and activation of such carbon particles. In the carbonization stage, waste tires were cut into pieces, which were then dried at 110 °C for 24 h in an electric furnace to reduce their humidity. The dried pieces of the waste tire were then subjected to carbonization by heating to 500 °C in a pyrolysis unit.25 After the pyrolysis process, rCB species were separated (via filtration) and washed using organic solvents to remove any attached organic impurities. Specifically, the acquired species of carbon were washed with n-hexane followed by the use of a methanol–benzene mixture (1![[thin space (1/6-em)]](https://www.rsc.org/images/entities/char_2009.gif) :
:![[thin space (1/6-em)]](https://www.rsc.org/images/entities/char_2009.gif) 1 by weight). The washing step was carried out under vigorous stirring for 30 min, applying 1 g L−1 as the concentration of rCB in washing solvents. Subsequently, rCB particles were washed with deionized water and dried in a vacuum oven at 110 °C for 1 h to remove any residues of water molecules. The purified species of rCB next received activation via two routes which are as follows:
1 by weight). The washing step was carried out under vigorous stirring for 30 min, applying 1 g L−1 as the concentration of rCB in washing solvents. Subsequently, rCB particles were washed with deionized water and dried in a vacuum oven at 110 °C for 1 h to remove any residues of water molecules. The purified species of rCB next received activation via two routes which are as follows:
2.3. Characterization
A scanning electron microscope model JM-2100-XX, JEOL-Japan (offers magnification up to 35![[thin space (1/6-em)]](https://www.rsc.org/images/entities/char_2009.gif) 000 times) was employed to explore the surface morphologies of the produced two carbon structures. Before being subjected to microscopy, the tested carbon samples were coated with a thin layer of gold to ensure high conductivity during the scanning process, which was operated at 120 keV. The structural characteristics of both carbon samples were performed using an FTIR device, model Nicolet Is-10, USA, with a KBr disk. To prepare the samples for IR analysis, ∼10–15 mg of carbon sample were added to mineral oil (3–4 drops). Then this mixture was grind in a mortar to form a thick paste. A small amount of the produced paste was placed on a salt plate, which was then covered by a second plate. Nitrogen adsorption–desorption measurements were carried out at 77.35 K using a Nova Touch LX4 Quantachrome, USA to determine the surface features of the carbon structures using a Brunauer–Emmett–Teller (BET) Barrett–Joyner–Halenda (BJH) methods. Before starting surface measurements, samples were degassed overnight at 200 °C under vacuum pressure of 10−4 Torre. A Raman spectrometer (BRUKER-SENTERRA, Germany) equipped with an integral microscope (Olympos) was utilized to further investigate the structures of carbon samples. The Raman device was operated using a He–Ne Laser beam at a wavelength of 533 nm.
000 times) was employed to explore the surface morphologies of the produced two carbon structures. Before being subjected to microscopy, the tested carbon samples were coated with a thin layer of gold to ensure high conductivity during the scanning process, which was operated at 120 keV. The structural characteristics of both carbon samples were performed using an FTIR device, model Nicolet Is-10, USA, with a KBr disk. To prepare the samples for IR analysis, ∼10–15 mg of carbon sample were added to mineral oil (3–4 drops). Then this mixture was grind in a mortar to form a thick paste. A small amount of the produced paste was placed on a salt plate, which was then covered by a second plate. Nitrogen adsorption–desorption measurements were carried out at 77.35 K using a Nova Touch LX4 Quantachrome, USA to determine the surface features of the carbon structures using a Brunauer–Emmett–Teller (BET) Barrett–Joyner–Halenda (BJH) methods. Before starting surface measurements, samples were degassed overnight at 200 °C under vacuum pressure of 10−4 Torre. A Raman spectrometer (BRUKER-SENTERRA, Germany) equipped with an integral microscope (Olympos) was utilized to further investigate the structures of carbon samples. The Raman device was operated using a He–Ne Laser beam at a wavelength of 533 nm.
2.4. Adsorption studies
A systematic study was conducted to investigate the impact of various operating parameters on the efficiency of Cd(II) uptake using the prepared activated carbon structures (C-AC and MC-AC). Contact time, pH, adsorbent dose, initial concentration of metal ions, and temperature are the experimentally investigated operational parameters. After each run of the experiment under different operating conditions, the solid phase (adsorbents carrying Cd ions) was initially segregated from the aqueous solutions using a Universal 320 centrifuge (operated at 2000 rpm) followed by its separation via filtration technique. Then, residual concentrations of Cd ions (mg L−1) in the aqueous solutions were measured using a flame atomic absorption spectrophotometer (FAAS), PerkinElmer, USA. Based on the acquired data, the disposed amount of Cd(II) by the sorbents (qe), the removal efficiency of the metal ions (R%), and the distribution coefficient (Kd) were calculated using eqn (1)–(3), as described earlier.27 | (1) |
 | (2) |
 | (3) |
3. Results and discussions
3.1. Material characterizations
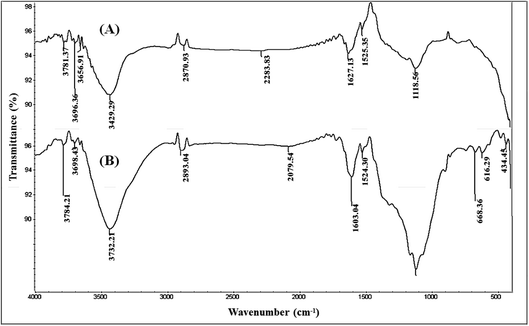
The observed differences between the two bands possibly resulted from the increase in the number of present OH groups, in the second structure, due to the process of double activation via microwave and chemical routes. Additionally, an absorption signal located in the range from 3000 to 2800 cm−1, allocated for the C–H bond, could be detected in both activated carbon structures. The noticed peaks in the two structures showed similar shapes and locations, while they have different intensities. This noted variation is referred to as the strain stress in MC-AC species due to the use of various chemical reagents. This finding can be explained by conserving the present skeleton of hydrocarbon in raw feedstock (rCB) during the production of activated carbon structures by chemical activation either individually or in combination with microwave irradiation.
In the range between 1650 and 1000 cm−1, the two AC structures showed three IR bands assigned to the C–O, S–O–C, and C–C vibrational bands. Nevertheless, the noticed peak at 1119 cm−1 was found to be less broad in the case of C-AC compared to MC-AC. This observation can be explained by the occurrence of stronger changes in the chemical structure during the process of producing MC-AC than in the case of C-AC. These chemical changes may include the formation of sulfonyl groups such as sulfone (–R–SO2–R–) and sulfoxide (R–S![[double bond, length as m-dash]](https://www.rsc.org/images/entities/char_e001.gif) O).29 The detection of such variations in the noted peaks verifies the occurrence of oxidative degradation of some chains of rCB structures during the H2O2- microwave treatment. Additional FTIR bands assigned to C–S and S–S bonds could be detected in between 600 and 680 cm−1, for both structures. The observation of these signals can be explained by the existence of retained sulfur compounds in the produced activated carbon structures since the compounds of sulfur are present in the original raw materials (carbon black).
O).29 The detection of such variations in the noted peaks verifies the occurrence of oxidative degradation of some chains of rCB structures during the H2O2- microwave treatment. Additional FTIR bands assigned to C–S and S–S bonds could be detected in between 600 and 680 cm−1, for both structures. The observation of these signals can be explained by the existence of retained sulfur compounds in the produced activated carbon structures since the compounds of sulfur are present in the original raw materials (carbon black).
| Surface area (m2 g−1) | Pore volume (cm3 g−1) | Pore size (nm) | |
|---|---|---|---|
| C-AC | 86 | 0.042 | 19 |
| MC-AC | 154 | 0.048 | 12 |
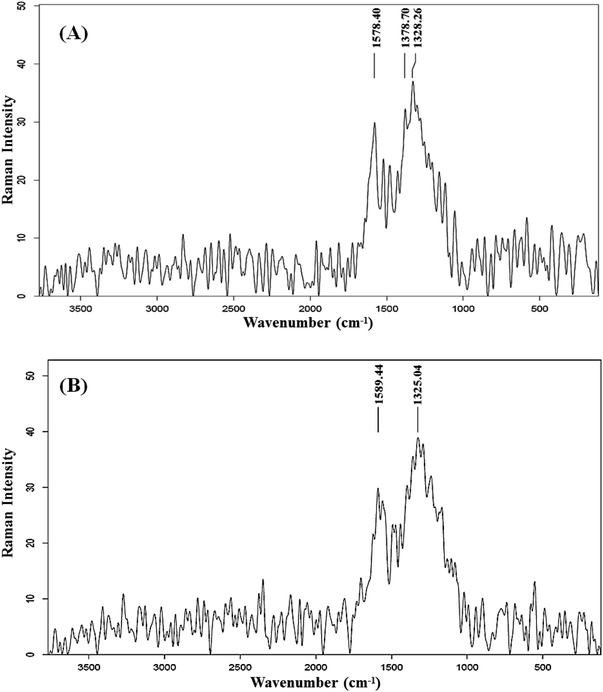
The observation of relatively close intensities of these bands, in both AC samples, implies the non-amorphous and properly ordered structures. This finding is relevant to the ID/IG ratio, which is widely used to evaluate the level of structural disorder in carbon materials. This ratio is obtained by dividing the integrated intensity of the disorder band by the integrated intensity of the Raman-allowed band.34 This ratio serves as an indicator of the number of structural defects and also measures the degree of exposure of edge planes, making it a frequently utilized measure for evaluating the level of structural order.35 It is well established that a carbon structure with a high degree of defects is associated with a higher ID/IG ratio.27 The ID/IG ratio of C-AC and MC-AC is slightly higher than 1, which indicates that both structures are of reasonable crystalline and ordered nature.7
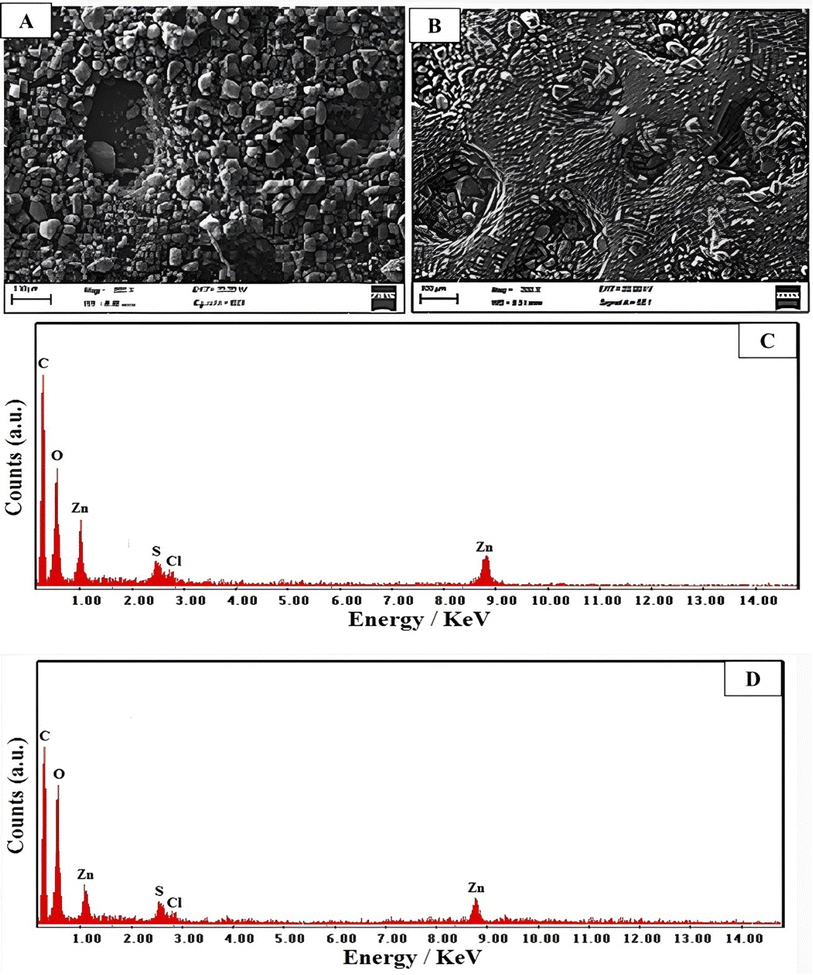 | ||
| Fig. 3 Morphology of (A) C-AC and (B) MC-AC species. EDX analysis of (C) C-AC and (D) MC-AC species. | ||
The chemical compositions of the two presented activated carbon structures were further investigated through the given elemental analysis via the energy-dispersive X-ray (EDX) spectra shown in Fig. 3C and D for C-AC and MC-AC respectively. The two structures exhibited peaks indicative of carbon, oxygen, sulfur, zinc, and chlorine elements as main constituents. The detection of indicative signals for C, O, and S elements is attributed to their presence in the original chemical structure of rCB, which was utilized as the raw material for preparing the activated carbon structures. Furthermore, the observation of Zn and Cl in both structures refers to the use of zinc chloride as a chemical activator during the preparation of C-AC and MC-AC. Nevertheless, the weight% of the detected elements is quite different in the two investigated AC structures. In particular, 48, 55, 32.35, 12.1, 10.6 and 6.4 wt% were noted for C, O, Cl, Zn, and S elements respectively in the C-AC structure. These weight percentages were quite different in the case of the MC-AC structure, particularly, they were found to be (C, 43.25%), (O, 39.75%), (Cl, 11.5%), (Zn, 10%) and (S, 5.5%). The variations in acquired percentages are explained by the use of hydrogen peroxide as an activator reagent during the preparation of MC-AC. Therefore, the percentage of O elements could be subsequently increased in the composition of MC-AC than in C-AC. The increase in the O content of MC-AC had been compromised by slight drops in the noticed percentages for C, Cl, Zn and S elements.
3.2. Sorption investigation
In this section, the implementation of both carbon structures (C-AC and MC-AC) in the process of Cd(II) uptake from an aqueous solution was examined. The effect of various operating factors such as processing time, initial concentration, amount of carbon, and temperature on the adsorption process was tested. Additionally, sorption kinetics, isotherms, and thermodynamics were analyzed to obtain valuable data necessary for scaling up the experiments and designing the process effectively.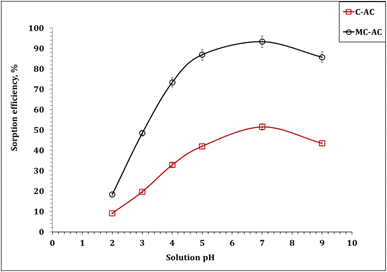 | ||
| Fig. 5 Dependence of cadmium(II) ion uptake percentage on the solution pH (5.0 g sorbent L−1; initial concentration: 50 mg L−1; 240 min; room temperature). | ||
The recognized behavior can be explained by the speciation of Cd(II) alongside the solution pH. Hence, the Medusa/Hydra software was applied to explore the variation in Cd(II) species (50 mg L−1) in aqueous solutions (0.1 M nitric acid) against the pH of the aqueous solution (Fig. S1†).36 The anticipated results reveal that Cd(II) exists mainly as cationic species (Cd2+) at acidic and neutral solution pH values, which indicate an extraordinary contest with the plenty of H+ ions at low pH (acidic medium), resulting in the increasing retention of cadmium ions in the solution. However, as the pH gradually increased, the concentration of H+ ions in the solution decreased, leading to a weakening of the competitive adsorption between H+ ions and Cd(II), resulting in an increment in the sorption percentage.37,38 In a prolonged solution treatment at pH 8, Cd(II) is predominantly in the form of Cd(OH)2 (the insoluble species), which negatively influences the uptake percentage. In essence, the obtained results indicate that Cd(II) sorption is a pH-dependent process, which is consistent with the work previously reported in the literature.3,39,40
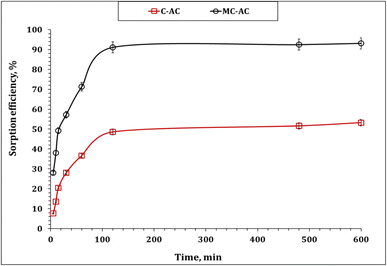 | ||
| Fig. 6 Impact of stirring time of MB sorption percentage (pH 6.0; sorbent dose: 5.0 g L−1; initial concentration: 50 mg L−1; 25 °C). | ||
Understanding the kinetics of adsorption is crucial as it helps in designing and modeling the adsorption process. In this study, to investigate the adsorption kinetics of Cd2+ onto the synthesized carbons (CAC and MCAC), three kinetic models, namely, pseudo-first-order, pseudo-second-order, and intra-particle diffusion (Weber–Morris), were used. The main concept of the applied models could exist in the corresponding references. The linear forms of the applied kinetic models are displayed in Table S1.†10,43,44 The coordination coefficient (R2) equation is shown in Table S1† and used to explore the most suitable kinetic model.10,43,44 The plot of the Lagergren model was exhibited as the variation in log(qe − qt) as a function of time (Fig. 7(I)), and the illustration of time/qt against time (Fig. 7(II)) represents the pseudo-second-order model. The attained values of the kinetic parameters are declared in Table 2.
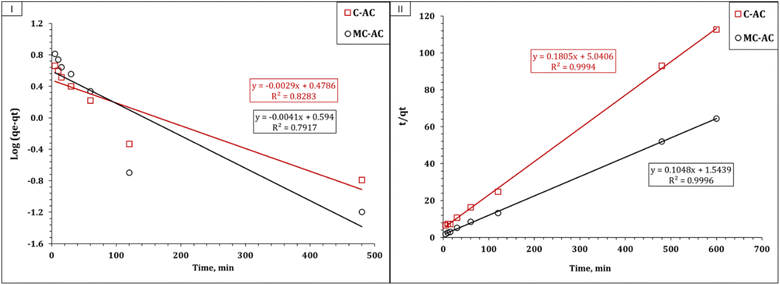 | ||
| Fig. 7 Kinetic illustration of pseudo-first-order (I) and pseudo-second-order (II) models for the Cd(II) adsorption process. | ||
| C-AC | MC-AC | ||
|---|---|---|---|
| Lagergreen pseudo first-order | k 1 (min−1) | 0.007 | 0.009 |
| q e cal (mg g−1) | 3.0 | 3.9 | |
| q e exp (mg g−1) | 5.3 | 9.3 | |
| R 2 | 0.82 | 0.79 | |
| Pseudo second-order | k 2 (min−1) | 0.006 | 0.007 |
| q e cal (mg g−1) | 5.5 | 9.5 | |
| q e exp (mg g−1) | 5.3 | 9.3 | |
| h (mol g−1 h−1) | 0.20 | 0.65 | |
| t 1/2 (h) | 27.9 | 14.7 | |
| R 2 | 0.99 | 0.99 | |
The deduced results in Table 2 elucidate that both applied sorbents exhibit the same kinetic profile, whereas the pseudo-second-order kinetic model for the Cd(II) uptake process exhibits excellent R2 values (0.99). In addition, the experimental and calculated sorption capacities are so close (qeexp: 5.3 and 9.3 mg g−1 for C-AC and MC-AC respectively; qecal: 5.5 and 9.5 mg g−1 for C-AC and MC-AC respectively). This indicates that the uptake process is chemisorption and involves electron sharing between the Cd(II) species and the C-AC and MC-AC function groups.10,45 Luo et al., and Tao et al., reported that the uptake of cadmium(II) using biochars prepared from corncob and corn straw silage respectively obeyed the pseudo-second-order kinetic model.39,46
It is noteworthy that although both sorbents exhibit the same kinetic profile, the MC-AC carbonaceous sorbent displays a higher sorption capacity (qe 9.5 mg g−1), a higher initial sorption rate (0.65 mol g−1 h−1), and a lower half equilibrium time (14.7 h) than those of the C-AC sorbent (qe 5.5 mg g−1, 0.65 mol g−1 h−1, and 27.9 h respectively). This finding reflects that the double activation routes improve the sorption properties of the tire-based carbon than one activation route.
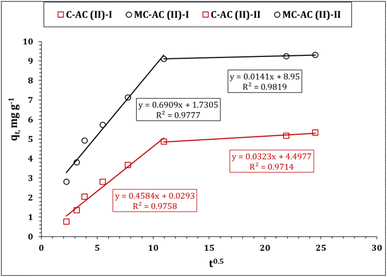
The Weber–Morris kinetic model was also applied to explore the mechanism of Cd(II) ion sorption using CAC and MCAC. The relation between qt and time0.5 (Weber and Morris plot) displays the mechanisms that control the sorption process, whether it is a solo (one-line segment with zero intercept) or multiple reaction mechanisms (several line segments).10,43,44 Multiple sorption controlling mechanisms could be recognized from Fig. 8, whereas it exhibits a curve of numerous line segments. This indicates that the sorption process is performed through two stages: The first stage expresses the sorption process up to 120 min (reaction equilibrium). This stage is characterized by a rapid rate of reaction, which is due to the existence of free function groups on the carbonaceous material surface.45,46 The other stage extends after equilibrium time and is described by a slow rate of reaction, caused by filling most of the adsorbent surface area holes.45,46 It is worth noting from Table 3 that, the first stage of Cd(II) ion sorption process possesses lower constant C (boundary layer effect) and a higher rate of reaction than the second stage, which reflects that the sorption process in the first stage occurs at the sorbent surface (high rate of reaction), while in the second stage, the sorption process takes place inside the sorbent pores and the intra-particular diffusion is the controlling mechanism (low rate of reaction).6,47
| Weber and Morris model | ||
|---|---|---|
| Stage I | ||
| k i (mg g−1 min−1/2) | 0.46 | 0.69 |
| C | 0.03 | 1.73 |
| R 2 | 0.97 | 0.97 |
![[thin space (1/6-em)]](https://www.rsc.org/images/entities/char_2009.gif) |
||
| Stage II | ||
| k i (mg g−1 min−1/2) | 0.03 | 0.01 |
| C | 4.5 | 9.0 |
| R 2 | 0.97 | 0.98 |
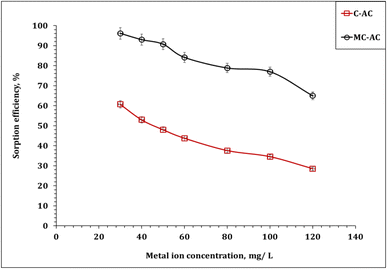 | ||
| Fig. 10 Impact of the initial concentration of Cd(II) sorption (pH: 6.0; stirring time: 240 min; sorbent dose: 5.0 g L−1; 25 °C). | ||
The isotherm of Cd(II) uptake using C-AC and MC-AC sorbents could be profoundly dissected by analyzing the gained data using the following conventional isotherm models: Langmuir, Freundlich, and Temkin.46–48 The main concept of the applied models could exist in the corresponding references. The linear forms of the applied isotherm models are displayed in Table S1.†10,51,52 The coordination coefficient (R2) equation was applied to fit the applied models.10,51,52 The variation in ln![[thin space (1/6-em)]](https://www.rsc.org/images/entities/char_2009.gif) qe against ln
qe against ln![[thin space (1/6-em)]](https://www.rsc.org/images/entities/char_2009.gif) Ce (Fig. 11(I)) was applied to verify the Freundlich isotherm model, the Langmuir model plot (Fig. 11(II)) relates Ce/qeversus Ce, and Fig. 11(III) displays the relation between qe and ln
Ce (Fig. 11(I)) was applied to verify the Freundlich isotherm model, the Langmuir model plot (Fig. 11(II)) relates Ce/qeversus Ce, and Fig. 11(III) displays the relation between qe and ln![[thin space (1/6-em)]](https://www.rsc.org/images/entities/char_2009.gif) Ce (Temkin isotherm model). The evaluated isotherm terms are presented in Table 4.
Ce (Temkin isotherm model). The evaluated isotherm terms are presented in Table 4.
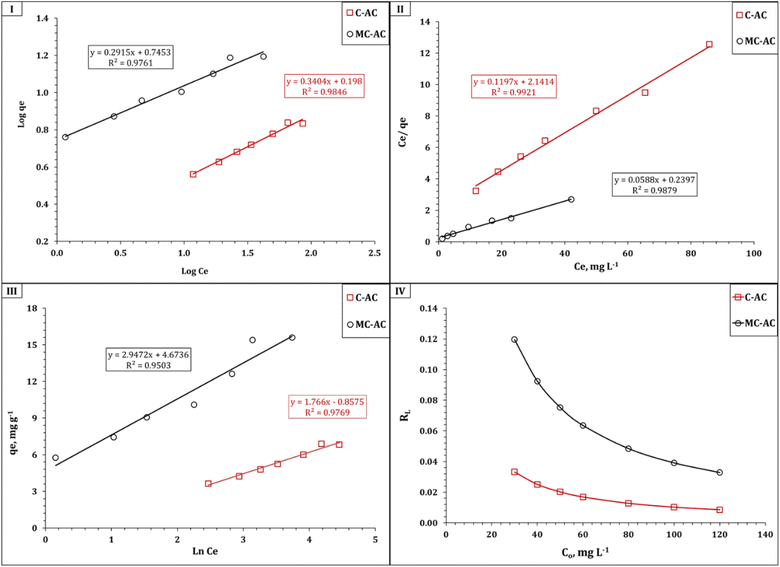 | ||
| Fig. 11 Isotherm illustration of Freundlich (I), Langmuir (II), and Temkin (III) models for the Cd(II) sorption process, and separation factor RL (IV). | ||
| C-AC | MC-AC | ||
|---|---|---|---|
| Freundlich isotherm model | 1/n | 0.34 | 0.29 |
| K f (mg g−1) | 1.6 | 5.6 | |
| R 2 | 0.98 | 0.97 | |
| Langmuir isotherm model | q m (mg g−1) | 8.4 | 17.0 |
| K L (L mg−1) | 0.97 | 0.25 | |
| R 2 | 0.99 | 0.98 | |
| Temkin isotherm | b T (J mol−1) | 1402.9 | 944.9 |
| B | 1.77 | 2.95 | |
| K T (L g−1) | 0.6 | 4.9 | |
| R 2 | 0.97 | 0.95 | |
The data obtained from Table 4 indicate that the Langmuir model displayed the highest coordination coefficient for C-AC and MC-AC materials, which reflects that Cd(II) uptake occurs via a homogenous, uniform, and monolayer process.10,53 This finding is consistent with the explored data from the SEM analysis for both sorbents, which reveal that both the structures have properly uniform smooth morphologies with porous natures (Fig. 2 and 3). The same isotherm performance (monolayer, uniform, and homogeneous process) was stated for Cd(II) removal from aqueous solutions using magnetic biochars modified with molybdenum disulfide (MoS2@MBC),47 titanium-modified ultrasonic biochars,46 and corn straw magnetic biochar composites.54
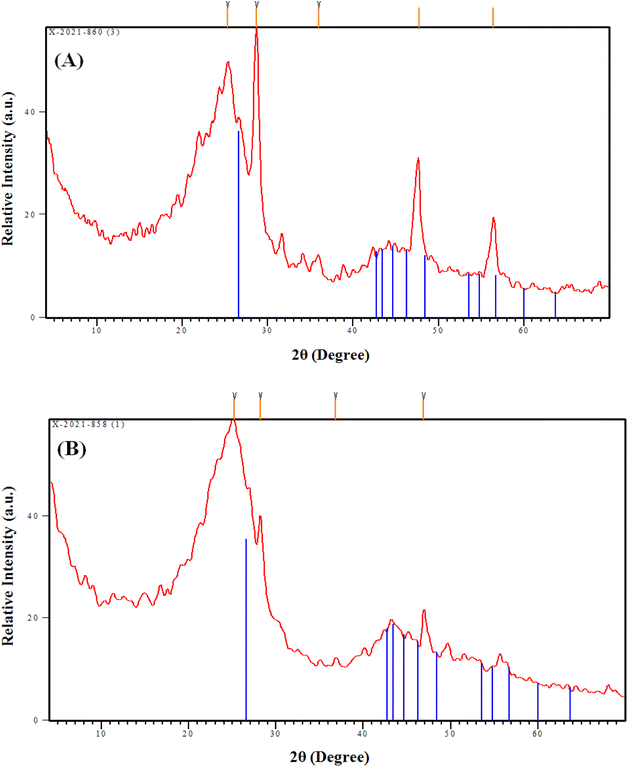
The impact of double activation processes (microwave and chemical activation) than one activation process (chemical activation) for improving the sorption properties of the tire-based carbon could be recognized from the sorption capacity, whereas the double-activated carbon possesses almost two times the sorption capacity (17.0 mg g−1) than the single-activated carbon (8.4 mg g−1), as declared in Table 4. This higher sorption capacity of the MC-AC sorbent than that of the C-AC sorbent could be attributed to the double route activation processes yielding sorbents with mostly spherical particles and a large number of pores (Fig. 3), better nature of crystallinity (Fig. 4), and almost double surface area (Table 1), which reflects that the double activation route improves the sorption features of the produced activated carbon.
It is worth noting that the Freundlich and Temkin isotherm models exhibit proper coordination coefficients (R2 > 0.95) for both applied sorbents, which indicate that the multilayer sorption process could take place during the sorption process,10,53 and the physisorption nature for the Cd(II) uptake process could be explored from the value of the Temkin isotherm term heat of sorption (bT).55 The favorability of the uptake process could be figured out from the magnitude values of the Langmuir dimensional constant separation factor (RL) and Freundlich constant 1/n, whereas the sorption is favorable if the values of RL and 1/n constants are between zero and one.10,53 The values of RL and 1/n anticipated in Fig. 11(IV) and Table 4 respectively obviously show that both terms have values less than one but higher than zero for both C-AC and MC-AC sorbents, which reflect a convenient process.10,53
The capacities of synthesized carbons for the adsorption of Cd2+ in this research work were compared with other materials reported in the literature, as presented in Table 5. The exhibited data indicate that the prepared sorbents in this study show potential as efficient materials for the uptake of cadmium since they showed good adsorption capacities, in comparison to those carbon structures that are previously reported in other studies. Nevertheless, some of these reported carbons revealed higher removal of Cd ions than that of C-AC and MC-AC. These increased activities could be referred to their higher surface area values, since they were produced form natural resources (agricultural waste), which have improved textural and structural properties than the recovered carbon black of waste tires. However, rCB stands as a novel raw material for preparing activated carbon structures for use as efficient adsorbents in heavy metal recovery.
| Sorbent type | Co (mg L−1) | Time (min) | pH | Temp (°C) | q e (mg g−1) | Ref |
|---|---|---|---|---|---|---|
| a PW: present work. | ||||||
| Acrylonitrile modified Ac | 20–200 | 1440 | 6.8 | 25 | 39.8 | 46 |
| Modified AC generated rice straw | 0–120 | 1440 | 10 | 25 | 8.1 | 53 |
| Corn straw magnetic AC | 10–150 | 360 | 6.0 | 25 | 16.4 | 47 |
| Oyster shell AC | 5–1000 | 1440 | 5.5 | 25 | 14.5 | 40 |
| KOH-modified AC | 0–20 | 1440 | 4.5 | 25 | 15.5 | 56 |
| MnO2-modified AC | 2–50 | 1440 | 6.0 | 25 | 37.2 | 42 |
| AC modified with shrimp bran | 10–100 | 2880 | 6.0 | 20 | 41.1 | 49 |
| Corn carbon fiber | 20–300 | 720 | 4.0 | 25 | 21.3 | 36 |
| Chemical activated carbon | 30–120 | 240 | 6.0 | 25 | 8.4 | PW a |
| Microwave/chemical-activated carbon | 17.0 | |||||
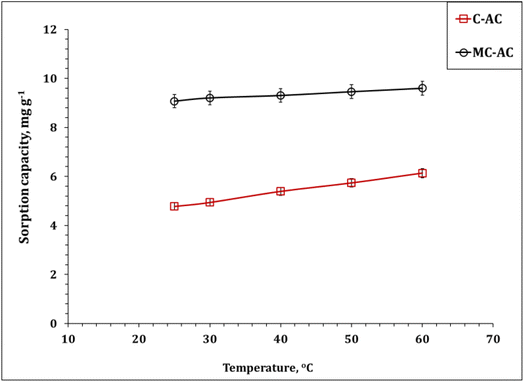 | ||
| Fig. 12 Impact of the reaction temperature on Cd(II) sorption (pH: 5.0; stirring time: 240 min; sorbent dose: 5.0 g L−1; initial Cd(II) concentration: 50 mg L−1). | ||
The dependence of the dimensionless distribution coefficient (log![[thin space (1/6-em)]](https://www.rsc.org/images/entities/char_2009.gif) Kc) on the reaction temperature (1/T) is illustrated (Fig. S2†) and used to explore the thermodynamic terms (Table 6). The deduced results confirm the endothermic nature of the sorption process, whereas ΔH° for both sorbents has positive values (13.0 and 20.2 kJ mol−1 for C-AC and MC-AC respectively).5,6,47 It is worth noting that, ΔH° < 40 kJ mol−1, which indicates that the physisorption interaction mechanism with weak van der Waals bonds could be involved during the uptake process.6,47 The spontaneous and feasibility uptake process could be recognized from the negative values of ΔG° for the entire temperature range.46,47 The positive values of ΔS° for both sorbents indicate that the randomness decreases during the adsorption process.46,47 The same thermodynamic performance (i.e. feasible, spontaneous, and endothermic system) was reported for the application of magnetic biochars modified with molybdenum disulfide (MoS2@MBC),47 corn straw magnetic biochar composites,54 and titanium-modified ultrasonic biochars46 for Cd(II) uptake from the aqueous solutions used.
Kc) on the reaction temperature (1/T) is illustrated (Fig. S2†) and used to explore the thermodynamic terms (Table 6). The deduced results confirm the endothermic nature of the sorption process, whereas ΔH° for both sorbents has positive values (13.0 and 20.2 kJ mol−1 for C-AC and MC-AC respectively).5,6,47 It is worth noting that, ΔH° < 40 kJ mol−1, which indicates that the physisorption interaction mechanism with weak van der Waals bonds could be involved during the uptake process.6,47 The spontaneous and feasibility uptake process could be recognized from the negative values of ΔG° for the entire temperature range.46,47 The positive values of ΔS° for both sorbents indicate that the randomness decreases during the adsorption process.46,47 The same thermodynamic performance (i.e. feasible, spontaneous, and endothermic system) was reported for the application of magnetic biochars modified with molybdenum disulfide (MoS2@MBC),47 corn straw magnetic biochar composites,54 and titanium-modified ultrasonic biochars46 for Cd(II) uptake from the aqueous solutions used.
| ΔG (kJ mol−1) | ΔH (kJ mol−1) | ΔS (J mol−1 K−1) | |||||
|---|---|---|---|---|---|---|---|
| 25 °C | 30 °C | 40 °C | 50 °C | 60 °C | |||
| C-AC | −12.9 | −13.3 | −14.2 | −15.0 | −16.0 | 13.0 | 87.0 |
| MC-AC | −18.8 | −19.5 | −20.5 | −21.9 | −23.5 | 20.2 | 130.7 |
In the present study, Cd(II) speciation using the Medusa software gives a predominate cation species Cd2+ at pH < 8 (Fig. S1†). In addition, FTIR analysis (Fig. 1) for the prepared carbonaceous materials indicate the presence of oxygen-containing function groups such as –COOH and –OH, which give a negative charge to aqueous solutions. This reflects the effective contribution to the electrostatic attraction mechanism between the cationic Cd(II) species and the negatively charged sorbent surface during the uptake process. This finding is confirmed by the gained data from pH investigation (Section 3.2.1), which displayed that the adsorption percentage increases as the solution pH increases (H+ ion concentration decreasing), as shown in Fig. 5.
Isotherm investigation shows that the adsorption process fits well with the Langmuir model (Table 4), which reflects a homogeneous, uniform, and monolayer sorption process. This finding is consistent with the surface morphology characterizations (Fig. 3 and 4), which declared that the prepared C-AC and MC-AC sorbents exhibit properly uniform smooth morphologies with porous nature.
Kinetic analysis displayed that the Cd(II) uptake process obeyed the pseudo-second-order model (Table 2), which elucidated that adsorption is a chemisorption process, and involved electron sharing between the Cd(II) species and the activated carbon function groups such as surface complexation and cation–π mechanisms.
Inner sphere surface complexation mechanism is involved during the Cd(II) adsorption process, whereas the applied sorbents possess several functional groups such as COOH, OH, C–O, S–O–C, –R–SO2–R– and R–S![[double bond, length as m-dash]](https://www.rsc.org/images/entities/char_e001.gif) O, which can form complexes with cadmium ions.57–59 The cation–π interaction between the aromatic ring of the applied sorbents (electron donor) and the Cd(II) species (electron acceptor) could also take place during the removal process.
O, which can form complexes with cadmium ions.57–59 The cation–π interaction between the aromatic ring of the applied sorbents (electron donor) and the Cd(II) species (electron acceptor) could also take place during the removal process.
The kinetic analysis using the W–M model (Table 3) shows that the uptake process is controlled with multiple reaction mechanisms. Furthermore, the physical adsorption process could be also shared in the uptake of Cd(II) ions using C-AC and MC-AC, particularly at low available surface active sites (prolong equilibrium), whereas the prepared materials exhibit quite a wide mesoporous nature (Fig. 3 and 4). The thermodynamic investigation showed that ΔH° < 40 kJ mol−1 (Table 6), which elucidated that the physisorption interaction mechanism with weak van der Waals bonds could be involved during the uptake process.6,47
3.3. Desorption and reusability investigation
Desorption and recycling investigations are important processes for optimizing and assessing wastewater remediation approaches. In this respect, the microwave and chemical activated tire (which exhibits the highest sorption tendency) loaded with Cd(II) ions was endured to a desorption process using 0.5 M of several acidic solutions (i.e. nitric, sulfuric, and hydrochloric acids), while the experimental conditions were kept at a shaking time of 240 min, a sorbent dose of 5 g L−1, and room temperature. The achieved data (Table S2†) reveal that the hydrochloric acid solution was the most effective eluent for the Cd(II) desorption process, whereas about 93.7% desorption efficiency was deduced. The MC-AC sorbent was examined for five sequential sorption/desorption cycles. The achieved results indicated that after five cycles, only 7 and 9% of the sorption and desorption efficiencies respectively (Fig. S3†) were reduced from the fresh sorbent, which reflects a proper stability for the prepared activated carbon.4. Conclusion
Waste rubber tires have been used to prepare carbonized and modified activated carbons (CAC and MCAC), and the products obtained have been characterized using a scanning electron microscope, an energy-dispersive X-ray spectrometer, an FTIR spectrophotometer, and an X-ray diffractometer. The resulting CAC and MCAC were tested as adsorbents for the removal of cadmium ions from the aqueous solution. The adsorption kinetics of the metal ion removal is fast at the beginning and then slowed down. The extent of the adsorption process is highly influenced by the pH of the solution, with greater adsorption observed at a pH of 5. After all, converting waste rubber tires into activated carbon is highly recommended, as it offers a doubly effective solution to environmental pollution. On the one hand, it provides a clean and sustainable way to dispose waste tires, and on the other hand, it offers an economically viable source of carbonaceous materials. The activated carbon obtained from waste tires can be used as an efficient adsorbent for the removal of heavy metals from aqueous solutions, as demonstrated in this study.Author contributions
M. M. El-Maadawy: experimental operation, data interpretation, and writing – editing. Amir A. Elzoghby: methodology, validation, data curation and interpretation, and writing – original draft, reviewing, and editing. Ahmed M. Masoud: conceptualization, supervision, and reviewing. Alzahraa M. Eldeeb: synthesis, characterization, data curation and interpretation, and writing – original draft. Ahmed M. A. El Naggar: methodology, investigation, data curation and interpretation, and writing – original draft, reviewing, and editing. Mohamed H. Taha: conceptualization, supervision, and reviewing.Conflicts of interest
The authors of this manuscript confirm that they have no conflict of interest with any organization or person.References
- J. Briffa, E. Sinagra and R. Blundell, Heliyon, 2020, 6, e04691 CrossRef CAS.
- S. Mitra, A. J. Chakraborty, A. M. Tareq, T. Bin Emran, F. Nainu, A. Khusro, A. M. Idris, M. U. Khandaker, H. Osman, F. A. Alhumaydhi and J. Simal-Gandara, J. King Saud Univ., Sci., 2022, 34, 101865 CrossRef.
- R. Vidu, E. Matei, A. M. Predescu, B. Alhalaili, C. Pantilimon, C. Tarcea and C. Predescu, Toxics, 2020, 8, 1–37 CrossRef.
- E. W. Chu, J. R. Karr, Reference Module in the Life Sciences, 2017 Search PubMed.
- A. A. Younes, A. M. Masoud and M. H. Taha, Int. J. Environ. Anal. Chem., 2023, 103(20), 9117–9130 CrossRef CAS.
- A. A. Elzoghby, A. Bakry, A. M. Masoud, W. S. Mohamed, M. H. Taha and T. F. Hassanein, J. Environ. Chem. Eng., 2021, 9, 106755 CrossRef CAS.
- A. S. Morshedy, M. H. Taha, D. M. A. El-Aty, A. Bakry and A. M. A. El Naggar, Environ. Technol. Innovation, 2021, 21, 101363 CrossRef CAS.
- M. M. Ali, S. A. Abedelmaksoud, M. H. Taha, A. M. A. El Naggar, A. S. Morshedy and A. A. Elzoghbi, Radiochemistry, 2020, 62, 204–215 CrossRef CAS.
- Z. Heidarinejad, M. H. Dehghani, M. Heidari, G. Javedan, I. Ali and M. Sillanpää, Environ. Chem. Lett., 2020, 182(18), 393–415 CrossRef.
- A. Morsy, M. H. Taha, M. Saeed, A. Waseem, M. A. Riaz and M. M. Elmaadawy, Nucl. Sci. Technol., 2019, 30, 1–11 CrossRef.
- S. Afroze and T. K. Sen, Water, Air, Soil Pollut., 2018, 229, 1–50 CrossRef CAS.
- D. Ramutshatsha-Makhwedzha, A. Mavhungu, M. L. Moropeng and R. Mbaya, Heliyon, 2022, 8, e09930 CrossRef CAS PubMed.
- N. Muttil, S. Jagadeesan, A. Chanda, M. Duke and S. K. Singh, Appl. Sci., 2022, 13, 257 CrossRef.
- W. Chen, H. Feng, D. Shen, Y. Jia, N. Li, X. Ying, T. Chen, Y. Zhou, J. Guo and M. Zhou, Sci. Total Environ., 2018, 618, 804–809 CrossRef CAS.
- K. Kuśmierek, A. Świątkowski, T. Kotkowski, R. Cherbański and E. Molga, J. Anal. Appl. Pyrolysis, 2021, 157, 105205 CrossRef.
- C. G. Joseph, D. Krishniah, Y. H. Taufiq-Yap, M. Massuanna and J. William, Adv. Mater. Res., 2015, 1107, 347–352 Search PubMed.
- T. A. Saleh, V. K. Gupta and A. A. Al-Saadi, J. Colloid Interface Sci., 2013, 396, 264–269 CrossRef CAS.
- A. Kumar, Y. Kuang, Z. Liang and X. Sun, Mater. Today Nano, 2020, 11, 100076 CrossRef.
- W. Ao, J. Fu, X. Mao, Q. Kang, C. Ran, Y. Liu, H. Zhang, Z. Gao, J. Li, G. Liu and J. Dai, Renewable Sustainable Energy Rev., 2018, 92, 958–979 CrossRef CAS.
- B. S. Ondon, B. Sun, Z. Y. Yan, X. M. Zhu and H. Liu, Appl. Water Sci., 2014, 4, 333–339 CrossRef CAS.
- E. Çalişkan, J. M. Bermúdez, J. B. Parra, J. A. Menéndez, M. Mahramanlioĝlu and C. O. Ania, J. Environ. Manage., 2012, 102, 134–140 CrossRef.
- S. Doja, L. K. Pillari and L. Bichler, Renewable Sustainable Energy Rev., 2022, 155, 111860 CrossRef CAS.
- V. K. Gupta, B. Gupta, A. Rastogi, S. Agarwal and A. Nayak, J. Hazard. Mater., 2011, 186, 891–901 CrossRef CAS.
- V. K. Gupta, A. Nayak, S. Agarwal and I. Tyagi, J. Colloid Interface Sci., 2014, 417, 420–430 CrossRef CAS.
- M. R. Yousuf, F. Mahnaz and S. R. Syeda, Desalin. Water Treat., 2021, 213, 441–458 CrossRef CAS.
- A. A. Ahmad, M. Al-Raggad and N. Shareef, Carbon Lett., 2021, 31, 957–971 CrossRef.
- A. M. Masoud, M. Saeed, M. H. Taha and M. M. El-Maadawy, Egypt. J. Chem., 2020, 63, 721–741 Search PubMed.
- M. H. Taha, S. A. Abdel Maksoud, M. M. Ali, A. M. El Naggar, A. S. Morshedy and A. A. Elzoghby, Int. J. Environ. Anal. Chem., 2019, 99(12), 1211–1234 CrossRef CAS.
- K. Aoudia, S. Azem, N. Aït Hocine, M. Gratton, V. Pettarin and S. Seghar, Waste Manage., 2017, 60, 471–481 CrossRef CAS.
- V. Poursorkhabi, M. A. Abdelwahab, M. Misra, H. Khalil, B. Gharabaghi and A. K. Mohanty, Front. Energy Res., 2020, 8, 208 CrossRef.
- C. Chailuecha, A. Klinbumrung, P. Chaopanich and R. Sirirak, Mater. Today: Proc., 2021, 47, 3525–3528 CAS.
- B. Chaudhuri, S. Ghosh, B. Mondal and D. Bhadra, Mater. Sci. Eng., B, 2022, 275, 115500 CrossRef CAS.
- F. Liu, H. Wang, L. Xue, L. Fan and Z. Zhu, J. Mater. Sci., 2008, 43, 4316–4322 CrossRef CAS.
- W. Qu, J. Liu, Y. Xue, X. Wang and X. Bai, J. Appl. Polym. Sci., 2018, 135, 45736 CrossRef.
- K. L. Tan and K. Y. Foo, Pet. Ind. Wastewater Adv. Sustain. Treat. Methods, 2022, 185–203 Search PubMed.
- A. F. Abou-Hadid, U. A. El-Behairy, M. M. Elmalih, E. Amdeha, A. M. A. E. Naggar, M. H. Taha and A. E. M. Hussein, Biomass Convers. Biorefin., 2023, 1, 1–15 Search PubMed.
- Q. Wang, J. Shan Li and C. S. Poon, J. Environ. Manage., 2019, 247, 509–517 CrossRef CAS PubMed.
- T. C. Nguyen, P. Loganathan, T. V. Nguyen, J. Kandasamy, R. Naidu and S. Vigneswaran, Environ. Sci. Pollut. Res. Int., 2018, 25, 20430–20438 CrossRef CAS PubMed.
- Q. Tao, Y. Chen, J. Zhao, B. Li, Y. Li, S. Tao, M. Li, Q. Li, Q. Xu, Y. Li, H. Li, B. Li, Y. Chen and C. Wang, Sci. Total Environ., 2019, 674, 213–222 CrossRef CAS PubMed.
- W. Lian, H. Li, J. Yang, S. Joseph, R. Bian, X. Liu, J. Zheng, M. Drosos, X. Zhang, L. Li, S. Shan and G. Pan, Bioresour. Technol. Rep., 2021, 15, 100709 CrossRef CAS.
- M. H. Taha, Environ. Sci. Pollut. Res. Int., 2021, 28, 12475–12489 CrossRef CAS PubMed.
- Z. Wu, X. Chen, B. Yuan and M. L. Fu, Chemosphere, 2020, 239, 124745 CrossRef CAS.
- L. Largitte and R. Pasquier, Chem. Eng. Res. Des., 2016, 109, 495–504 CrossRef CAS.
- E. D. Revellame, D. L. Fortela, W. Sharp, R. Hernandez and M. E. Zappi, Clean. Eng. Technol., 2020, 1, 100032 CrossRef.
- M. H. Taha, A. M. Masoud, Y. M. Khawassek, A. E. M. Hussein, H. F. Aly and E. Guibal, Environ. Sci. Pollut. Res., 2020, 27, 31278–31288 CrossRef CAS.
- M. Luo, H. Lin, B. Li, Y. Dong, Y. He and L. Wang, Bioresour. Technol., 2018, 259, 312–318 CrossRef CAS PubMed.
- Z. H. Khan, M. Gao, W. Qiu and Z. Song, Chemosphere, 2020, 255, 126995 CrossRef CAS PubMed.
- D. Xu, Y. Zhao, K. Sun, B. Gao, Z. Wang, J. Jin, Z. Zhang, S. Wang, Y. Yan, X. Liu and F. Wu, Chemosphere, 2014, 111, 320–326 CrossRef CAS PubMed.
- W. Yin, C. Zhao and J. Xu, Environ. Sci. Pollut. Res., 2019, 26, 37092–37100 CrossRef CAS PubMed.
- R. Katal, M. S. Baei, H. T. Rahmati and H. Esfandian, J. Ind. Eng. Chem., 2012, 18, 295–302 CrossRef CAS.
- M. A. Al-Ghouti and D. A. Da'ana, J. Hazard. Mater., 2020, 393, 122383 CrossRef CAS PubMed.
- N. Ayawei, A. N. Ebelegi and D. Wankasi, J. Chem., 2017, 2017, 3039817 Search PubMed.
- S. Wang, N. Wang, K. Yao, Y. Fan, W. Li, W. Han, X. Yin and D. Chen, Sci. Rep., 2019, 9, 1–13 CrossRef.
- Z. H. Khan, M. Gao, W. Qiu, M. S. Islam and Z. Song, Chemosphere, 2020, 246, 125701 CrossRef CAS PubMed.
- A. M. Masoud, A. A. El-Zahhar, A. M. A. El Naggar, A. I. Zahran, G. A. A. Al-Hazmi and M. H. Taha, Radiochim. Acta, 2023, 111, 105–115 CrossRef CAS.
- S. Bashir, J. Zhu, Q. Fu and H. Hu, Environ. Sci. Pollut. Res., 2018, 25, 11875–11883 CrossRef CAS.
- X. Cui, S. Fang, Y. Yao, T. Li, Q. Ni, X. Yang and Z. He, Sci. Total Environ., 2016, 562, 517–525 CrossRef CAS.
- Y. Deng, S. Huang, C. Dong, Z. Meng and X. Wang, Bioresour. Technol., 2020, 303, 122853 CrossRef CAS PubMed.
- B. T. Iber, V. T. Okomoda, S. A. Rozaimah and N. A. Kasan, Bioresour. Technol. Rep., 2021, 15, 100702 CrossRef CAS.
- X. Xu, X. Cao and L. Zhao, Chemosphere, 2013, 92, 955–961 CrossRef CAS.
- Z. Wang, G. Liu, H. Zheng, F. Li, H. H. Ngo, W. Guo, C. Liu, L. Chen and B. Xing, Bioresour. Technol., 2015, 177, 308–317 CrossRef CAS PubMed.
- L. Tan, Z. Ma, K. Yang, Q. Cui, K. Wang, T. Wang, G. L. Wu and J. Zheng, Sci. Total Environ., 2020, 699, 134223 CrossRef CAS PubMed.
- R. Chang, S. P. Sohi, F. Jing, Y. Liu and J. Chen, Environ. Pollut., 2019, 254, 113123 CrossRef CAS PubMed.
- H. N. Tran, S. J. You, A. Hosseini-Bandegharaei and H. P. Chao, Water Res., 2017, 120, 88–116 CrossRef CAS PubMed.
- X. Cui, H. Hao, C. Zhang, Z. He and X. Yang, Sci. Total Environ., 2016, 539, 566–575 CrossRef CAS PubMed.
Footnote |
| † Electronic supplementary information (ESI) available. See DOI: https://doi.org/10.1039/d4ra00172a |
| This journal is © The Royal Society of Chemistry 2024 |

