 Open Access Article
Creative Commons Attribution 3.0 Unported Licence
Performance characterization and biocompatibility assessment of silicone polyurethanes for polymer heart valve applications
Bixuan Liua,
Zhihua Liub,
Haiyang Weia,
Yana Menga,
Qianwen Houa,
Aili Wanga,
Yongkai Zhanga,
Enhui Hana,
Shengshou Hua and
Jianye Zhou *a
*a
aState Key Laboratory of Cardiovascular Disease, Fuwai Hospital, National Center for Cardiovascular Diseases, Chinese Academy of Medical Sciences and Peking Union Medical College, Beijing, 100037, China. E-mail: bixuanliu@163.com; 18729950840@163.com; 346284746@qq.com; hqw@fuwaihospital.org; wangaili96@163.com; yk790039@gmail.com; 2811664802@qq.com; huss@fuwaihospital.org; zhoujianye@fuwaihospital.org
bSchool of Materials Science and Engineering, Beijing Institute of Technology, Beijing 100081, China. E-mail: 1346816911@qq.com
First published on 3rd April 2024
Abstract
Silicone polyurethanes have gained widespread application in the biomedical field due to their excellent biocompatibility. This study comprehensively investigates four silicone polyurethane materials suitable for polymer heart valves, each exhibiting distinct chemical compositions and structural characteristics, leading to significant differences, particularly in mechanical performance and biocompatibility. Surface analysis reveals an elevated surface silicon element content in all materials compared to the bulk, indicating a migration of silicon elements towards the surface, providing a structural basis for enhancing biological stability and biocompatibility. However, higher silicon content leads to a decrease in mechanical performance, potentially resulting in mechanical failure and rupture in artificial heart valves. Concerning biocompatibility, an increase in silicone content diminishes the material's adsorption capability for cells and proteins, consequently improving its biocompatibility and biological stability. In summary, while high silicone content leads to a reduction in mechanical performance, the formation of a “silicon protective layer” on the material surface mitigates cell and protein adsorption, thereby enhancing biocompatibility and biological stability. Through comprehensive testing of the four silicone polyurethane materials, this study aims to provide insightful perspectives and methods for selecting materials suitable for polymer heart valves. Additionally, the thorough performance exploration of these materials serves as a crucial reference for the performance assessment and biocompatibility research of polymeric artificial heart valve materials.
1 Introduction
Heart valve diseases fall under the category of structural heart diseases, significantly impacting the quality of life for patients and posing potential life-threatening risks.1 With the continuous increase in the aging population, the number of patients with valve diseases is on the rise,2 becoming a major medical challenge in the cardiovascular field. Consequently, there is a growing urgency for the development of artificial heart valves at present.Currently, clinically utilized artificial heart valves are primarily divided into two categories: mechanical valves and biological valves.3,4 Mechanical valves, widely applied due to their outstanding durability, suffer from poor hemodynamics owing to their rigid characteristics, leading to thrombus formation and necessitating lifelong anticoagulant therapy for patients.5,6 In contrast, biological valves exhibit superior hemodynamic performance and excellent biocompatibility; however, their durability is relatively poor,7 prone to collagen degradation under physiological conditions, resulting in pathological changes such as calcification, valve thickening, and tearing.8 Given these limitations in both types of artificial heart valves, there is an urgent need for the development of a new generation of artificial heart valves that combine both biocompatibility and biological durability to better meet the demands of disease treatment.
In recent years, significant progress has been made in the field of heart valve materials, with a valve material based on silicone polyurethane urea demonstrating excellent mechanical performance and biocompatibility,9–12 providing feasibility for the development of a new generation of artificial heart valves. As the application of polymer materials in heart valve technology continues to advance, finding polymers with optimal biocompatibility and biological stability has become one of the most challenging frontiers in the biomedical field.13,14 Simultaneously, the preparation, properties, and application research of biomedical polymer materials have garnered considerable attention from the academic and industrial sectors.15–17 However, the development and application of polymer materials for artificial heart valves remain a highly challenging issue. It requires attention not only to the material's basic properties such as microstructure, surface morphology10, and hydrophilicity/hydrophobicity18 but also to its mechanical performance19 to ensure its ability to withstand the mechanical environment inside the heart valve and other applications. More importantly, as polymer heart valves serve as long-term implant materials, emphasis must be placed on biocompatibility, biological stability, and durability.20
This study comprehensively characterizes the performance and assesses the biocompatibility of four silicone polyurethane materials. Through testing methods such as SAXS and DSC, the microphase separation structure of the materials is explored. Additionally, analysis of the material's surface/interface properties is conducted using XPS, SEM-EDX, and mechanical performance testing. This helps gain in-depth insights into the structure and performance of silicone polyurethane materials with different structures, providing a foundational performance data basis for selecting high-polymer materials suitable for artificial heart valves. Moreover, we conducted cytotoxicity experiments, inflammation reaction studies, analysis of blood cell adhesion and activation, protein adsorption experiments, and subcutaneous implantation experiments in rats, comprehensively evaluating the biocompatibility and biological stability of these materials to provide a more comprehensive assessment of their feasibility in biomedical applications.
In conclusion, as polymer materials continue to be widely applied in the field of heart valves, this study aims to explore in-depth the performance characteristics and biocompatibility of different silicone polyurethane materials. It provides valuable references for the future development of materials for heart valve repair and replacement, with the potential to positively impact the field of biomedical science.
2 Experimental
2.1 Materials
PU-1, PU-3, PU-4 were siliconized polyurethane materials provided by Beijing Institute of Technology, and PU-2 was provided by Hubei University. Polyurethane 80 A was purchased from Lubrizol Corporation in the United States (Table 1).| Material | Type | Structural composition | Mn (kg mol−1) | PDI | Source | |
|---|---|---|---|---|---|---|
| Soft segment | Hard segment | |||||
| a BIT: School of Materials Science and Engineering, Beijing Institute of Technology.b HBU: Hubei University. | ||||||
| PU-1 | Siloxane polycarbonate polyurethane | PCDL/PDMS | MDI/BDO | 84 | 1.8 | BITa |
| PU-2 | Siloxane polyether polyurethane | PHMO/PDMS | MDI/BDO | 51 | 1.5 | HBUb |
| PU-3 | Siloxane polyether polyurethane | PHMO/PDMS | MDI/BHTD/BDO | 92 | 2.1 | BITa |
| PU-4 | Siloxane polyether polyurethane | PTMG/PDMS | MDI/EDA/BDO | 103 | 2 | BITa |
| 80 A | Polyether polyurethane | PTMG | MDI/BDO | 98 | 1.7 | Lubrizo |
2.2 Methods
2.2.9.1 Preparation of materials and extracts. Materials were first placed in a 75% ethanol solution for 3 hours to disinfect (as the materials were insoluble in ethanol). Subsequently, the materials were washed three times with sterile PBS to remove residual ethanol. The materials were then placed under a UV lamp for 30 minutes to ensure thorough sterilization. Extracts were prepared by immersing the sterilized materials in DMEM culture medium containing 10% fetal bovine serum for 24 hours at 37 °C.
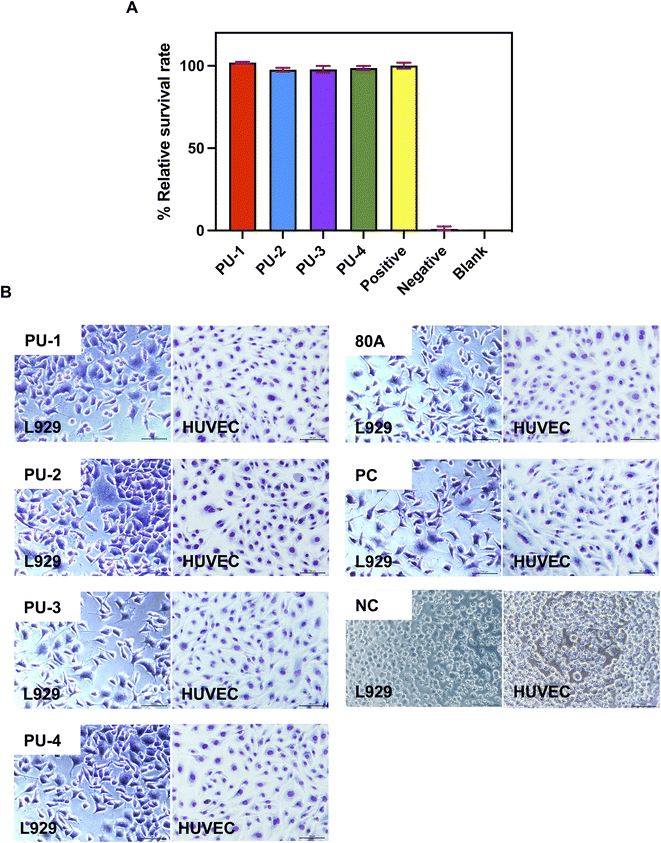
2.2.9.2 Cell toxicity assay. The L929 mouse fibroblast cell line was used for the cell toxicity assay. The cells were cultured in DMEM medium containing 10% fetal bovine serum at 37 °C in a 5% CO2 incubator. Experimental groups included extracts from four siliconized polyurethane polymers, blank control group (DMEM culture medium with 10% fetal bovine serum), negative control group (extract from biocompatible material 80 A), and positive control group (extract from a polymer with high tin content). After 24 hours of cell seeding, 100 μL of each extract was added to the wells, and the cells were cultured for an additional 3 days.
Cell Counting Kit-8 (CCK-8) assay was performed to evaluate cell viability. After removing the culture medium, a mixture of 100 μL DMEM and 10 μL CCK-8 reagent was added to each well, followed by incubation for 2 hours at 37 °C. Absorbance was measured at 450 nm using a microplate reader. The relative viability was calculated as: relative viability = (absorbance of the experimental group − absorbance of the blank control group)/(absorbance of the positive control group − absorbance of the blank control group).
2.2.9.3 Cell morphology observation. For cell morphology observation, L929 mouse fibroblasts and HUVEC human umbilical vein endothelial cells were selected. The cells were cultured in conditions similar to those described earlier. After 24 hours, the original culture medium was replaced with 1 mL of the respective extract, and the cells were cultured for an additional 3 days. Cells were stained with May–Grunwald and Giemsa stains, and cell morphology was observed under an inverted fluorescence microscope.
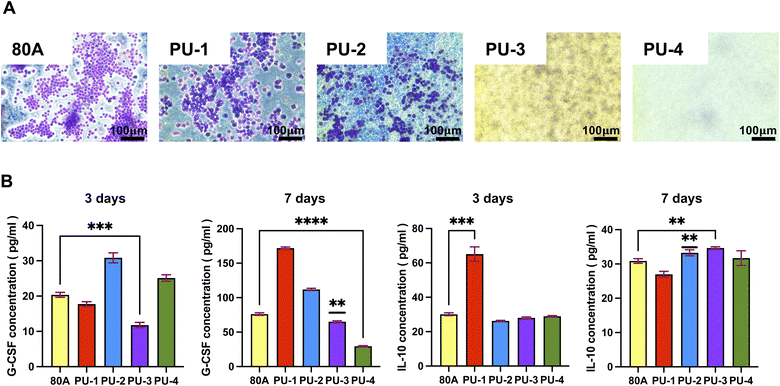
2.2.10.1 Macrophage adhesion. The Ana-1 mouse macrophage cell line was used for the experiment. These cells were cultured in RPMI-1640 medium containing 10% fetal bovine serum and maintained at 37 °C in a 5% CO2 incubator. Materials were cut into 1 cm × 1 cm squares, disinfected thoroughly, and placed in 24-well plates. Ana-1 cells were seeded at a density of 15
![[thin space (1/6-em)]](https://www.rsc.org/images/entities/char_2009.gif) 000 cells per well and cultured for 3 days. Afterward, the samples were processed for staining, and macrophage adhesion was observed using a fluorescence microscope.
000 cells per well and cultured for 3 days. Afterward, the samples were processed for staining, and macrophage adhesion was observed using a fluorescence microscope.
2.2.10.2 Inflammatory response. After co-culturing macrophages with materials for 3 and 7 days, cell culture supernatants were collected, and ELISA kits were used to quantitatively analyze the secretion of the cytokines G-CSF and IL-10 by macrophages, assessing the inflammatory response induced by the materials.
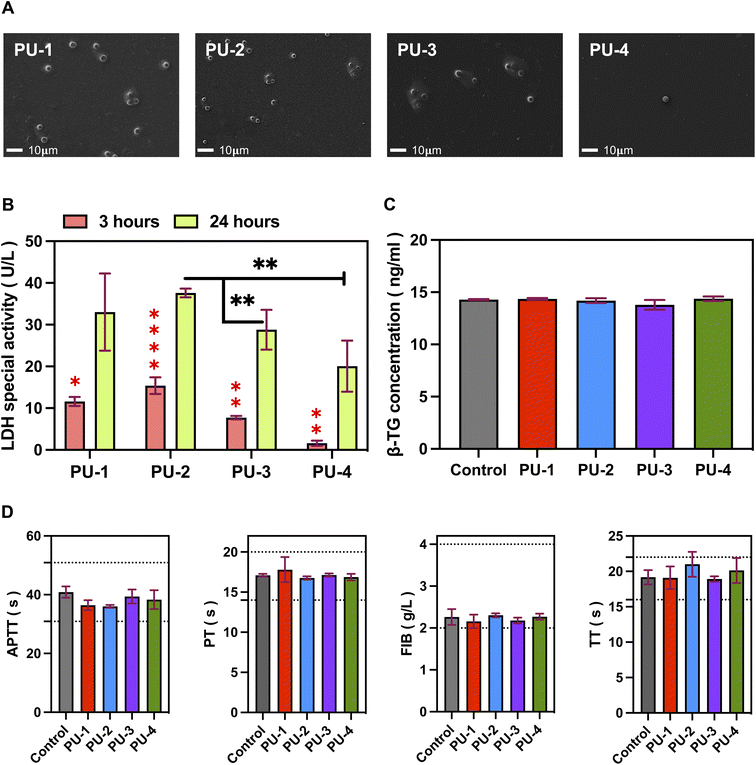
2.2.11.1 Adhesion of blood cells. Materials were cut into 1 cm × 1 cm squares and placed in 15 mL centrifuge tubes. Fresh whole blood from healthy volunteers (3 mL per tube) was added, and the tubes were incubated at 37 °C with shaking for 24 hours to promote interaction between blood cells and material surfaces. After incubation, the materials were removed from the tubes, washed three times with PBS to remove non-adherent blood cells, fixed in 2.5% glutaraldehyde solution, and prepared for electron microscopy. Images were captured using a microscope at 500× magnification.
2.2.11.2 Lactate dehydrogenase (LDH) semi-quantitative assay. Materials were cut into 1 cm × 1 cm squares and placed in 5 mL centrifuge tubes. Fresh whole blood from healthy volunteers (1 mL per tube) was added, and the tubes were incubated at 37 °C with shaking for 3 and 24 hours. After incubation, the materials were removed, washed three times with PBS, and placed in 24-well plates. Then, 1 mL of 0.05% Triton X-100 was added to each well, and the plates were incubated for 5 minutes to fully lyse the cells. A semi-quantitative analysis of lactate dehydrogenase (LDH) released from blood cells was performed using an LDH assay kit.
2.2.11.3 Platelet activation. Materials (1 cm × 1 cm) were placed in 24-well plates, and 1 mL of platelet-rich plasma (PRP) was added to each well. After incubation at 37 °C for 60 minutes, simulating the interaction between materials and plasma in the body, the plasma was collected, and the β-thromboglobulin (β-TG) content in the supernatant was determined using an ELISA kit. The data were statistically analyzed to assess the ability of the tested materials to activate platelets.
2.2.11.4 Coagulation four tests. Blood was collected from healthy volunteers using sodium citrate (1
![[thin space (1/6-em)]](https://www.rsc.org/images/entities/char_2009.gif) :
:![[thin space (1/6-em)]](https://www.rsc.org/images/entities/char_2009.gif) 9 anticoagulant ratio). After standing at 4 °C for 30 minutes, the blood samples were centrifuged at 3500 rpm at 4 °C for 10 minutes to obtain plasma. Materials cut into 1 cm × 1 cm squares were placed in tubes, and 1 mL of plasma was added to each tube. The tubes were incubated at 37 °C for 60 minutes, ensuring thorough mixing and reaction. Coagulation four tests, including activated partial thromboplastin time (APTT), prothrombin time (PT), fibrinogen (FIB), and thrombin time (TT), were analyzed using a semi-automatic blood coagulation analyzer (Beijing Saikexide).
9 anticoagulant ratio). After standing at 4 °C for 30 minutes, the blood samples were centrifuged at 3500 rpm at 4 °C for 10 minutes to obtain plasma. Materials cut into 1 cm × 1 cm squares were placed in tubes, and 1 mL of plasma was added to each tube. The tubes were incubated at 37 °C for 60 minutes, ensuring thorough mixing and reaction. Coagulation four tests, including activated partial thromboplastin time (APTT), prothrombin time (PT), fibrinogen (FIB), and thrombin time (TT), were analyzed using a semi-automatic blood coagulation analyzer (Beijing Saikexide).
2.2.13.1 Subcutaneous implantation. The animal experimental protocol was approved by the Institutional Animal Care and Use Committee (IACUC), Fuwai Hospital, Chinese Academy of Medical Sciences (Ethics No: FW-2022-0038), and complied with the principles of laboratory animal care. Two-week-old rats weighing around 100 g were selected for the experiment. After anesthesia, sample pieces cut into 1 cm × 1 cm size were implanted into the dorsal area of each rat. Each rat was implanted with 4 sample pieces, and each sample had 8 replicates.
2.2.13.2 Hematoxylin and eosin (HE) staining. After 30 days of implantation, rats were euthanized with carbon dioxide, and the implanted samples were collected. The samples were placed in a solution containing 10% formaldehyde for fixation. After fixation, the samples were dehydrated using a gradient ethanol process, embedded in paraffin, and sliced into 5 μm sections for subsequent staining and histological analysis. Finally, the sections were placed on glass slides, and HE staining was performed.
2.2.13.3 The determination of calcium content by ICP-OES method. In terms of sample handling, we placed material slices extracted from the subcutaneous tissue of rats in a constant temperature oven at 80 °C until a constant weight was achieved. Following sample preparation, quantitative analysis of calcium elements was conducted using an ICP-OES instrument (PerkinElmer Optima 8000, USA). The samples were initially subjected to digestion treatment before being introduced into the ICP instrument for measurement. Throughout the measurement process, a series of standard calcium solutions were utilized for instrument calibration. All procedures were carried out in accordance with international standard methods to ensure the reliability and accuracy of the measurement results.
3 Results
3.1 Performance characterization
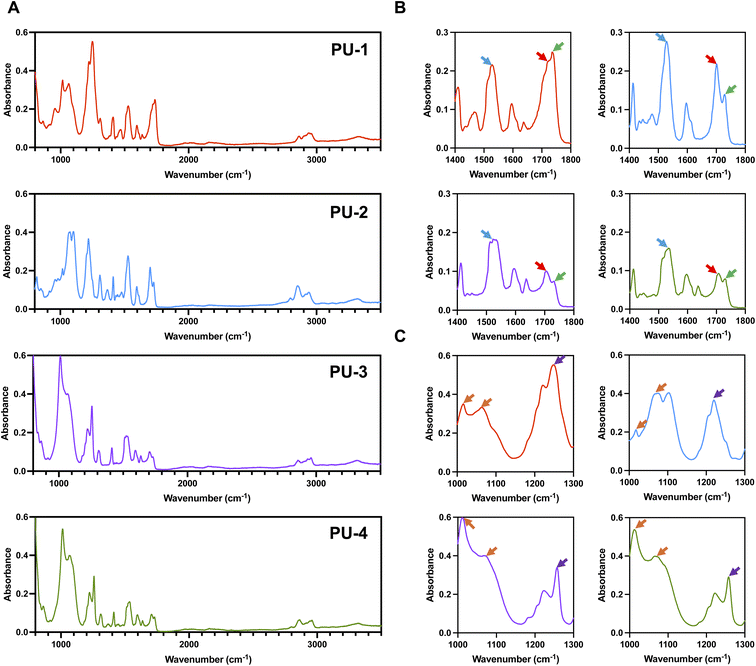
For polymer heart valves, the polymer material used as a long-term implant must possess biostability, biocompatibility, and mechanical properties. Due to its unique location, higher demands are placed on overall performance, particularly exceptional biostability and comprehensive mechanical properties, such as an implantation life of up to 15 years or more, low creep, moderate modulus, fatigue resistance, and excellent tensile performance.21,22 Accurate and comprehensive characterization of material performance is crucial not only for material selection but also for guiding material design and synthesis. This can truly achieve the goal of using molecular structure design to achieve desired performance. The polymer materials' performance characterization testing methods in this study include structural analysis, interfacial analysis, microphase separation analysis, thermal stability analysis, and mechanical performance analysis. Through these tests, we aim to establish connections between biocompatibility, biostability, and performance, providing essential data support for material selection, design, and medical applications.![[double bond, length as m-dash]](https://www.rsc.org/images/entities/char_e001.gif) O), 1735 cm−1 (non-hydrogen-bonded C
O), 1735 cm−1 (non-hydrogen-bonded C![[double bond, length as m-dash]](https://www.rsc.org/images/entities/char_e001.gif) O), and 1530 cm−1 (N–H and C–N). The characteristic absorption peaks of siloxane are around 1020 cm−1 and 1080 cm−1 (Si–O–Si). Siloxane molecules are linked to the soft segment of polyurethane through the CH2–Si(CH3) bond (1260 cm−1). As shown in Fig. 1, the mentioned infrared characteristic absorption peaks are evident in all four polymer materials, indicating that they are all siloxane polyurethanes.
O), and 1530 cm−1 (N–H and C–N). The characteristic absorption peaks of siloxane are around 1020 cm−1 and 1080 cm−1 (Si–O–Si). Siloxane molecules are linked to the soft segment of polyurethane through the CH2–Si(CH3) bond (1260 cm−1). As shown in Fig. 1, the mentioned infrared characteristic absorption peaks are evident in all four polymer materials, indicating that they are all siloxane polyurethanes.
![[thin space (1/6-em)]](https://www.rsc.org/images/entities/char_2009.gif) θ = λ/d and the scattering angle formula q = 4π
θ = λ/d and the scattering angle formula q = 4π![[thin space (1/6-em)]](https://www.rsc.org/images/entities/char_2009.gif) sin
sin![[thin space (1/6-em)]](https://www.rsc.org/images/entities/char_2009.gif) θ/λ. All siloxane-containing polyurethanes exhibit clear first-order scattering peaks in their SAXS scattering intensity distribution curves, indicating the presence of microphase separation structures in polyurethane samples. Using the mentioned equations, the calculated phase interval distances for these samples are all within the range of 15–30 nm. As shown in Fig. 3, the peak values of q in the SAXS spectra, closer to q = 0, indicate a greater degree of microphase separation. This suggests that PU-1 and PU-4 exhibit a more noticeable microphase separation degree, while PU-2 and PU-3 have a lower microphase separation degree. All samples' SAXS two-dimensional scattering patterns show circular scattering rings, indicative of the typical features of microphase separation between soft and hard segments and suggesting a random orientation of these microphase regions.
θ/λ. All siloxane-containing polyurethanes exhibit clear first-order scattering peaks in their SAXS scattering intensity distribution curves, indicating the presence of microphase separation structures in polyurethane samples. Using the mentioned equations, the calculated phase interval distances for these samples are all within the range of 15–30 nm. As shown in Fig. 3, the peak values of q in the SAXS spectra, closer to q = 0, indicate a greater degree of microphase separation. This suggests that PU-1 and PU-4 exhibit a more noticeable microphase separation degree, while PU-2 and PU-3 have a lower microphase separation degree. All samples' SAXS two-dimensional scattering patterns show circular scattering rings, indicative of the typical features of microphase separation between soft and hard segments and suggesting a random orientation of these microphase regions.
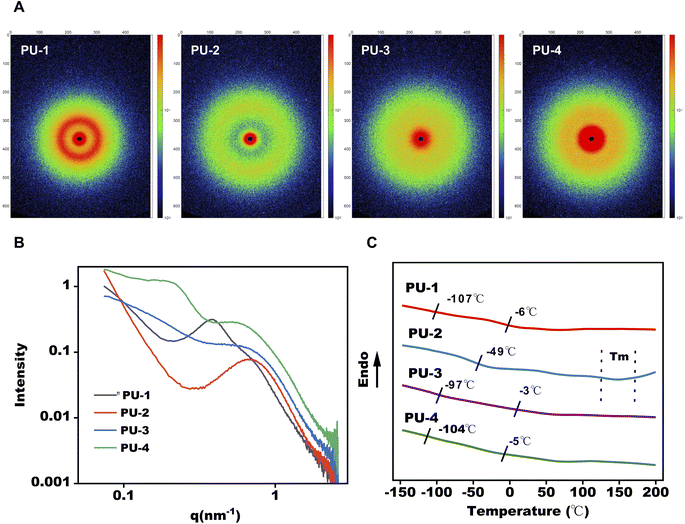 | ||
| Fig. 3 Microphase separation analysis of PUs. (A and B) Small angle X-ray scattering (SAXS) patterns for PUs. (C) DSC thermograms of PUs. | ||
Through differential scanning calorimetry (DSC) testing, we observe two glass transition temperatures in PU-1: −107 °C corresponds to the glass transition of polydimethylsiloxane (PDMS), and −6 °C is the glass transition temperature of polycarbonate. PU-2 does not show the Tg of PDMS, likely due to its lower silicon content and lower degree of phase separation. PU-3 and PU-4 both exhibit two glass transition temperatures, with PU-3's −97 °C and −3 °C corresponding to the glass transitions of polydimethylsiloxane and polyether, respectively. PU-4's −104 °C and −5 °C correspond to the glass transitions of polydimethylsiloxane and polyether, respectively. Furthermore, PU-3's glass transition temperature of polydimethylsiloxane at −97 °C is significantly lower than that of PU-1 and PU-4, indicating a lower degree of microphase separation in PU-3, consistent with SAXS results.
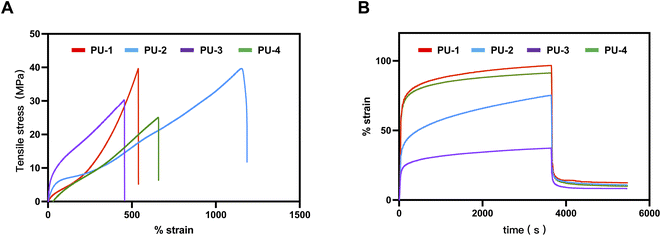 | ||
| Fig. 5 Microphase separation analysis of PUs. (A) Stress–strain curves of PUs. (B) Creep and recovery strain-time curves of PUs. | ||
| SiPUU | Elongation at break (%) | Ultimate tensile stress (MPa) | Young's modulus (MPa) |
|---|---|---|---|
| PU-1 | 561.42 ± 23.82 | 36.31 ± 3.43 | 10.74 ± 0.93 |
| PU-2 | 1165.61 ± 22.04 | 37.67 ± 1.51 | 16.83 ± 0.92 |
| PU-3 | 464.38 ± 10.33 | 29.71 ± 1.09 | 34.85 ± 2.55 |
| PU-4 | 616.51 ± 12.04 | 25.47 ± 0.30 | 10.05 ± 1.48 |
3.2 Biocompatibility
The design and evaluation of medical biomaterials require careful consideration of biocompatibility to ensure safety in clinical applications. This entails avoiding inflammation, cytotoxicity, and tissue damage caused by the biomaterial. In this study, we assessed the biocompatibility of four siloxane polyurethanes from several aspects, including cytotoxicity, inflammatory response, and the material's degradation level under in vivo conditions.4 Discussion
4.1 Performance characterization
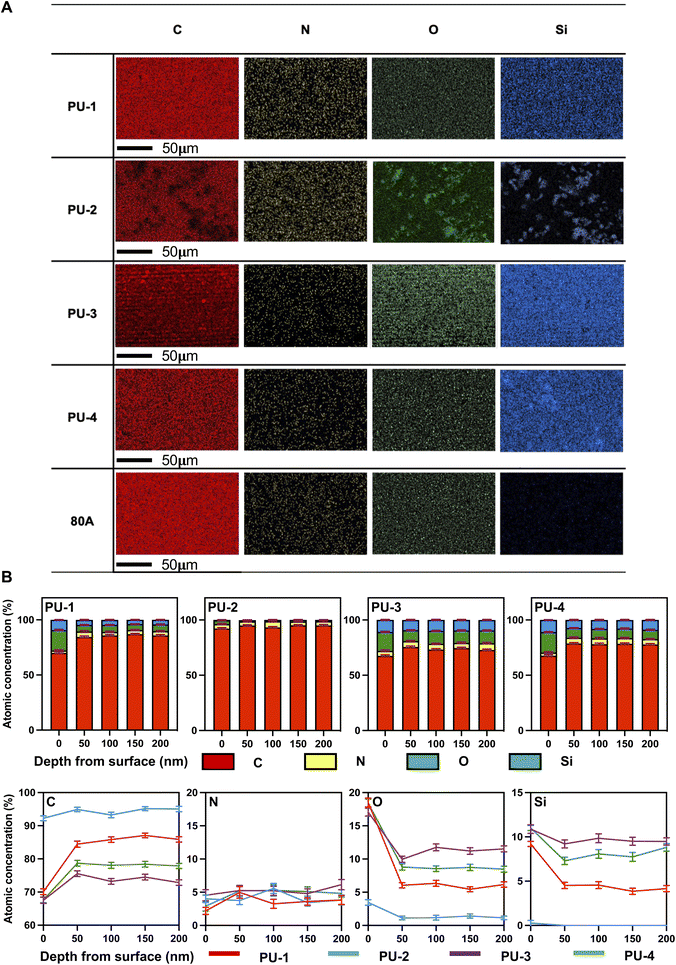
This study comprehensively evaluated the performance of four materials through diverse characterization techniques to investigate the correlation between their structure and properties. Initially, the molecular structure of the materials was preliminarily examined using FTIR spectroscopy. The high sensitivity of FTIR enabled the detection of specific functional group vibrations, providing insights into the basic molecular structure. This initial analysis laid the foundation for understanding the chemical composition of the materials, facilitating subsequent in-depth analyses.In terms of elemental composition, SEM-EDX and XPS techniques were employed. SEM-EDX provided visual observations of material surface morphology and elemental distribution, while XPS revealed the distribution of elements at different depths. These techniques offered crucial information on the chemical environment at material surfaces and interfaces, as well as the spatial distribution of elements.
Subsequently, the microphase separation performance of the materials was assessed using SAXS and DSC. SAXS's high resolution allowed the observation of changes in the materials' microstructure, contributing to an understanding of their phase separation characteristics. DSC results corroborated the SAXS findings, indicating a theoretical basis for the thermal processing of PU-2 within the 160–190 °C range.
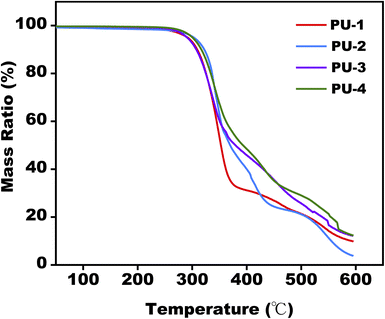
From a thermal stability perspective, TGA analysis provided insights into the materials' performance under high-temperature conditions. Evaluating these thermodynamic properties deepened our understanding of the materials' thermal behavior, offering a theoretical foundation for their processing applications at elevated temperatures.
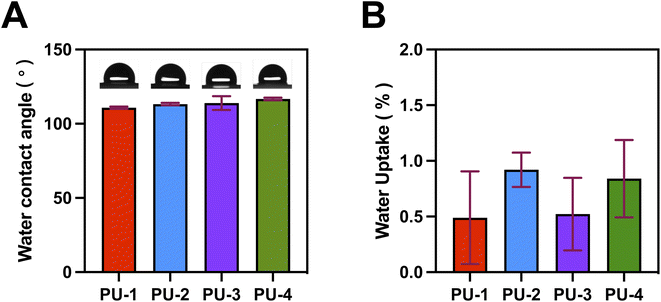
Finally, detailed studies were conducted on the materials' wettability and mechanical properties. Surface hydrophobicity testing provided insights into the materials' interactions with the external environment. Mechanical property testing revealed key characteristics such as strength and hardness. This comprehensive performance assessment enabled a thorough understanding of various aspects of the materials, laying the groundwork for their practical performance in diverse applications.
In summary, through these comprehensive characterization techniques, we gained in-depth insights into the molecular structure, microphase separation, elemental composition, thermodynamic properties, wettability and mechanical performance of the materials. The exploration of their interrelationships will provide robust guidance for future material design and performance optimization, driving research and applications in related fields.
Building upon the preliminary SEM-EDX analysis of surface elemental composition, XPS was further employed to assess the element distribution at different depths, exploring the evolution of the material's surface chemical environment. The concentration of silicon and oxygen elements gradually decreased with increasing depth. This prompted a deeper consideration of the distribution pattern of silicon elements in siloxane polyurethanes. We speculated that silicon elements in siloxane polyurethanes may preferentially accumulate at the material surface due to their lower free energy, explaining the decrease in silicon concentration with increasing etching depth. Simultaneously, the aggregation of silicon and oxygen elements on the material surface in the form of siloxane suggested a relationship with minimizing surface energy and interacting with adjacent elements.28 XPS depth profiling revealed critical features of the material surface's elemental composition, offering valuable information for a profound understanding of material performance and applications.
Our research findings indicate that compared to the silicon-based polyurethane material LifePolymer™ (tensile strength 35 MPa, Young's modulus 20 MPa, elongation at break 681%) used in polymer valve prostheses already undergoing clinical trials by Foldax company,9 our materials PU-1 and PU-2 exhibited tensile strengths of 36.31 MPa and 37.67 MPa, respectively, significantly higher than those of Foldax's product. However, the mechanical performance of PU-3 and PU-4 was relatively lower but still around 30 MPa.
One possible reason for the difference in tensile strength is the varying silicone content in the materials. Silicone polymers have lower intermolecular forces, so an excessive amount of silicone can reduce the mechanical strength of the material, consistent with our surface analysis results. Additionally, an excess of silicone may reduce material compatibility, thereby affecting its phase separation and, consequently,29 its mechanical performance.
The importance of elastic modulus cannot be overstated in the selection of heart valve materials as it directly affects hemodynamics. A higher elastic modulus may result in a smaller valve opening area, increasing the burden on the patient's heart. According to literature reports, the elastic modulus of materials used for artificial heart valves should be less than 35 Mpa,9 a requirement met by all four materials in our study.
Furthermore, due to the continuous stress exerted on heart valves in their working environment, creep fatigue leading to fracture is one of the primary failure modes of polymer materials. Creep rate is an important indicator of a material's resistance to creep, representing the slope of the curve during continuous stress loading to unloading. Our study revealed that PU-1, PU-3, and PU-4 exhibited extremely low creep rates, while PU-2 demonstrated poorer resistance to creep. Under a continuous stress of 4 MPa for one hour, the irreversible deformation was less than 10%, meeting the requirements for heart valve materials. Particularly, PU-3 showed an exceptionally low creep rate and irreversible deformation, indicating optimal creep performance.
Considering the results of tensile strength, elastic modulus, and creep performance tests, PU-3 demonstrated excellent characteristics in mechanical performance, making it potentially more suitable for heart valve applications.
4.2 Biocompatibility
Our experimental results revealed that after 7 days of contact between the materials and macrophages, the concentration of G-CSF in the leachate of PU-3 and PU-4 was significantly lower than that in the leachate of the control group, 80 A. The decreased levels of G-CSF indicate that compared to 80 A, the materials exhibit weaker pro-inflammatory capabilities. This observation could be attributed to the higher silicon content in PU-3 and PU-4 materials, which forms a silicon protective layer on the material surface, hindering macrophage adhesion. As a result, macrophages are less likely to adhere to the material surface, thus reducing the triggering of immune responses and inflammation upon material implantation.
Furthermore, after 7 days of material implantation, the concentration of IL-10 in the leachate of PU-3 was significantly higher than that in the leachate of 80 A. IL-10, being an anti-inflammatory factor, its lower concentration in the case of 80 A may not be sufficient to counteract the occurrence of inflammation. Therefore, compared to 80 A, PU-3 demonstrates superior inflammatory response capabilities, which is significant in the context of material biocompatibility and immunogenicity assessment.
In summary, our findings suggest that PU-3 and PU-4 materials exhibit lower pro-inflammatory potential compared to 80 A due to their higher silicon content, which inhibits macrophage adhesion and subsequent immune responses. Additionally, the elevated IL-10 levels observed in PU-3 indicate its potential as a favorable material in terms of inflammatory response regulation. These insights contribute to our understanding of material–host interactions and have implications for biomedical applications.
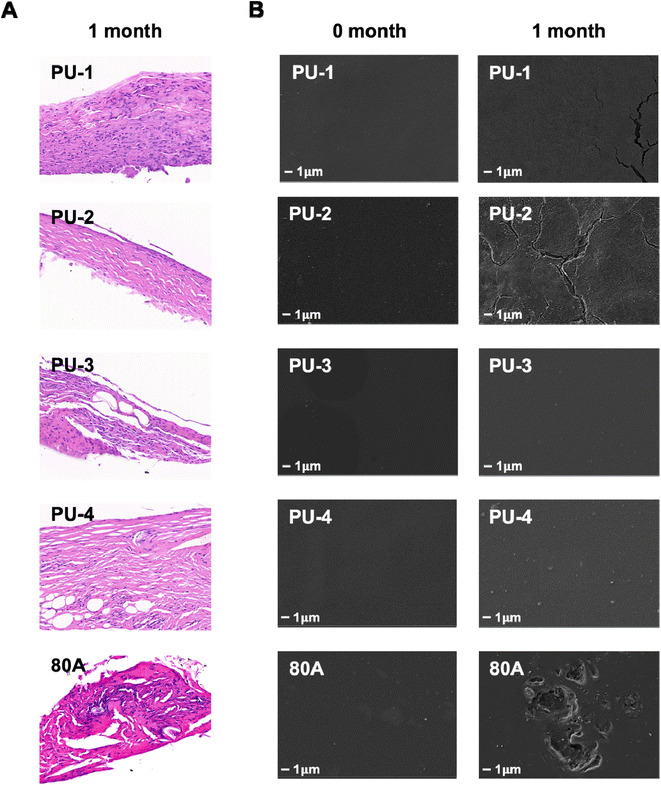
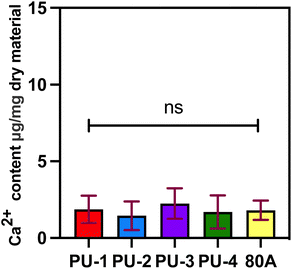
In this study, we characterized the level of calcification by measuring the calcium content using ICP-OES testing after 30 days of material implantation subcutaneously in rats. The results indicate that none of the four materials showed significant calcification after implantation, and there was no significant difference compared to the control group 80 A. In previous literature, it has been reported that the calcium content of bioprosthetic valves fixed with glutaraldehyde and implanted subcutaneously in rats for 30 days was measured at 100.01 ± 7.13 micrograms per milligram via ICP-OES analysis.36 In contrast, the calcium content of the four polymer materials currently under our investigation is significantly lower. This finding further highlights the superiority of polymer materials over bioprosthetic valves in terms of anti-calcification properties. It indicates that our materials possess better anti-calcification capabilities, which are crucial for long-term implantable cardiac valve materials. This result provides robust support for our study and underscores the potential application value of polymer materials in the field of cardiac valve prostheses.
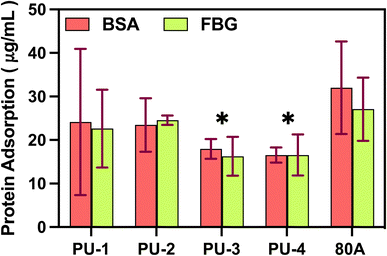
It is worth noting that PU-3 and PU-4, as polymers with high silicon content, exhibited excellent surface characteristics with low cell adhesion. This is attributed to the presence of silicon elements with a lower surface energy, which may alter the elemental distribution on the material surface, making it less prone to cell adhesion. This characteristic is significant in biomedical applications as it effectively reduces potential inflammatory cell adhesion, lowers the risk of inflammatory reactions, and also reduces blood cell adhesion, thus minimizing the potential danger of thrombus formation. Moreover, this feature contributes to enhancing the material's biocompatibility in specific applications. Based on these advantages, PU-3 and PU-4 have the potential for widespread applications, especially in the field of artificial heart valves, making them promising high-molecular-weight polymer materials. This not only positively influences the improvement of the performance and reliability of medical materials but also provides a valuable template for future biomedical material design.
In conclusion, our study provides a comprehensive assessment of the silicon-containing polyurethane materials in terms of performance characterization and biocompatibility. The results offer strong support for the selection of materials suitable for heart valve applications and provide useful references for future biomedical material design. However, further research is needed to validate these results and gain a deeper understanding of the performance of these materials in different clinical applications.
5 Conclusions
Through a series of tests, we conducted a detailed analysis of the performance of silicone-oxygen polyurethane in mechanical properties, biocompatibility, and biological stability. The results demonstrate outstanding mechanical performance for PU-1 and PU-2, with a tensile strength of 36 MPa for PU-1 and 38 MPa for PU-2. Meanwhile, PU-3 and PU-4 exhibited superior biological stability and biocompatibility.By combining SEM-EDX and XPS analyses, we explained the surface migration phenomenon of silicon elements in silicone-oxygen polyurethane. This surface migration is a key factor contributing to the enhanced biocompatibility and biological stability compared to 80 A. The surface migration of silicon elements may form a “silicon protective layer”, reducing the material's surface affinity, thereby slowing down cell and protein adsorption and enhancing biocompatibility. Additionally, surface elemental analysis revealed that the high silicon content in PU-3 and PU-4 is a major factor causing the reduction in mechanical performance while significantly improving biocompatibility and biological stability.
Considering the comprehensive factors of mechanical properties, biocompatibility, and biological stability, the high silicon content in PU-3 positions it with extensive prospects in biomedical applications. This study provides profound insights into the selection of high-molecular-weight polymer materials for artificial heart valve applications and emphasizes the importance of considering different performance indicators in material design. The superior performance of PU-3 makes it a promising candidate material worthy of in-depth research and development in the field of artificial heart valves in the future.
Conflicts of interest
There are no conflicts to declare.Acknowledgements
This work was supported by the CAMS Innovation Fund for Medical Science (CIFMS 2021-I2M-1-006).References
- K. S. German and A. Kalra, Curr. Opin. Support. Palliat. Care, 2019, 13, 14–17 CrossRef PubMed.
- J. S. Aluru, A. Barsouk, K. Saginala, P. Rawla and A. Barsouk, Med. Sci., 2022, 10(2), 32 Search PubMed.
- J. Yu, E. Qiao and W. Wang, Clin. Cardiol., 2022, 45, 701–716 CrossRef PubMed.
- D. B. Leviner, B. Zafrir, W. Saliba, N. Stein, A. Shiran and E. Sharoni, Eur. J. Cardio. Thorac. Surg., 2022, 62, ezac073 CrossRef PubMed.
- A. Sanaani, S. Yandrapalli and J. M. Harburger, Cardiol. Rev., 2018, 26, 177–186 CrossRef PubMed.
- S. Gopal, J. M. Hauser and S. K. Mahboobi, in StatPearls, StatPearls Publishing Copyright © 2023, StatPearls Publishing LLC., Treasure Island (FL), 2023 Search PubMed.
- E. Durand, A. Sokoloff, M. Urena-Alcazar, B. Chevalier, S. Chassaing, R. Didier, C. Tron, P. Y. Litzler, C. Bouleti, D. Himbert, T. Hovasse, O. Bar, G. Avinée, B. Iung, D. Blanchard, M. Gilard, A. Cribier, T. Lefevre and H. Eltchaninoff, Circ.: Cardiovasc. Interventions, 2019, 12, e007597 Search PubMed.
- B. Purinya, V. Kasyanov, J. Volkolakov, R. Latsis and G. Tetere, J. Biomech., 1994, 27, 1–11 CrossRef CAS PubMed.
- L. S. Dandeniyage, P. A. Gunatillake, R. Adhikari, M. Bown, R. Shanks and B. Adhikari, J. Biomed. Mater. Res., Part B, 2018, 106, 1712–1720 CrossRef CAS PubMed.
- L. S. Dandeniyage, R. Adhikari, M. Bown, R. Shanks, B. Adhikari, C. D. Easton, T. R. Gengenbach, D. Cookson and P. A. Gunatillake, J. Biomed. Mater. Res., Part B, 2019, 107, 112–121 CrossRef CAS PubMed.
- G. Gallagher, A. Padsalgikar, E. Tkatchouk, C. Jenney, C. Iacob and J. Runt, J. Biomed. Mater. Res., Part B, 2017, 105, 1544–1558 CrossRef CAS PubMed.
- C. Jenney, P. Millson, D. W. Grainger, R. Grubbs, P. Gunatillake, S. J. McCarthy, J. Runt and J. Beith, Adv. NanoBiomed Res., 2020, 1, 1712–1720 Search PubMed.
- R. L. Li, J. Russ, C. Paschalides, G. Ferrari, H. Waisman, J. W. Kysar and D. Kalfa, Biomaterials, 2019, 225, 119493 CrossRef CAS PubMed.
- J. Kaplan and M. Grinstaff, J. Visualized Exp., 2015, e53117, DOI:10.3791/53117.
- V. Thomas and M. Jayabalan, J. Biomed. Mater. Res., Part A, 2009, 89, 192–205 CrossRef PubMed.
- A. Rudolph, M. Teske, S. Illner, V. Kiefel, K. Sternberg, N. Grabow, A. Wree and M. Hovakimyan, PLoS One, 2015, 10, e0142075 CrossRef PubMed.
- C. Celesti, D. Iannazzo, C. Espro, A. Visco, L. Legnani, L. Veltri, G. Visalli, A. Di Pietro, P. Bottino and M. A. Chiacchio, Materials, 2022, 15, 8208 CrossRef CAS PubMed.
- L. Tang, X. Long, X. He, M. Ding, D. Zhao, F. Luo, J. Li, Z. Li, H. Tan and H. Zhang, J. Mater. Chem. B, 2021, 9, 3210–3223 RSC.
- A. D'Amore, S. K. Luketich, G. M. Raffa, S. Olia, G. Menallo, A. Mazzola, F. D'Accardi, T. Grunberg, X. Gu, M. Pilato, M. V. Kameneva, V. Badhwar and W. R. Wagner, Biomaterials, 2018, 150, 25–37 CrossRef PubMed.
- A. G. Kidane, G. Burriesci, M. Edirisinghe, H. Ghanbari, P. Bonhoeffer and A. M. Seifalian, Acta Biomater., 2009, 5, 2409–2417 CrossRef CAS PubMed.
- S. K. Singh, M. Kachel, E. Castillero, Y. Xue, D. Kalfa, G. Ferrari and I. George, Front. Cardiovasc. Med., 2023, 10, 1137827 CrossRef CAS PubMed.
- Z. A. Spigel, H. Zhu, A. M. Qureshi, D. J. Penny, C. A. Caldarone, J. S. Heinle and Z. M. Binsalamah, Semin. Thorac. Cardiovasc. Surg., 2021, 33, 184–191 CrossRef PubMed.
- I. Khan, N. Smith, E. Jones, D. S. Finch and R. E. Cameron, Biomaterials, 2005, 26, 621–631 CrossRef CAS PubMed.
- A. Simmons, J. Hyvarinen and L. Poole-Warren, Biomaterials, 2006, 27, 4484–4497 CrossRef CAS.
- H. Ishihara, I. Kimura, K. Saito and H. Ono, J. Macromol. Sci., Part B, 1974, 10, 591–618 CrossRef.
- C. Yunna, H. Mengru, W. Lei and C. Weidong, Eur. J. Pharmacol., 2020, 877, 173090 CrossRef PubMed.
- A. Yahyouche, X. Zhidao, J. T. Czernuszka and A. J. Clover, Acta Biomater., 2011, 7, 278–286 CrossRef CAS PubMed.
- Z.-h. Liu, Y.-h. Xiao, X.-y. Ma, X. Geng, L. Ye, A.-y. Zhang and Z.-g. Feng, Mater. Adv., 2022, 4608–4621 RSC.
- W. Wang, X. Bai, S. Sun, Y. Gao, F. Li and S. Hu, Int. J. Mol. Sci., 2022, 23, 12613 CrossRef CAS PubMed.
- L. Zhong, J. Jin, D. Zheng, W. Guan, Y. Guo, A. Chen, Y. Peng, Q. Gao, Y. Zheng and H. Huang, J. Mater. Sci.: Mater. Med., 2018, 29, 176 CrossRef PubMed.
- F. Venet and G. Monneret, Nat. Rev. Nephrol., 2018, 14, 121–137 CrossRef CAS PubMed.
- K. Nagata and C. Nishiyama, Int. J. Mol. Sci., 2021, 22, 4972 CrossRef CAS.
- E. Buck, S. Lee, Q. Gao, S. D. Tran, F. Tamimi, L. S. Stone and M. Cerruti, ACS Biomater. Sci. Eng., 2022, 8, 1506–1521 CrossRef CAS PubMed.
- L. C. Xu and C. A. Siedlecki, J. Biomed. Mater. Res., Part B, 2017, 105, 668–678 CrossRef CAS PubMed.
- K. Lin, Z. Li, Y. Tao, K. Li, H. Yang, J. Ma, T. Li, J. Sha and Y. Chen, Langmuir, 2021, 37, 10521–10528 CrossRef CAS PubMed.
- M. Hu, X. Peng, S. Shi, C. Wan, C. Cheng, N. Lei and X. Yu, J. Mater. Chem. B, 2022, 10, 8218–8234 RSC.
| This journal is © The Royal Society of Chemistry 2024 |

