 Open Access Article
Shock-induced plastic deformation of nanopowder Ti during consolidation and spallation
Debing He a,
Mingyang Wanga,
Wenbo Bi*b and
Liang Wang
 *a
*a
aCollege of Science, Hunan Agricultural University, Changsha, Hunan 410128, People's Republic of China. E-mail: wangliang0329@hunau.edu.cn
bGraduate School of China Academy of Engineering Physics, Beijing 100193, People's Republic of China. E-mail: biwenbo23@gscaep.ac.cn
First published on 13th March 2024
Abstract
Consolidating nanopowder metals via impact loading is a potentially significant method for synthesizing and processing bulk nanocrystalline materials. However, until now, the microstructural features, plastic deformation during consolidation, and corresponding mechanisms have been seldom revealed. Using molecular dynamics (MD) simulations, we have studied the plastic deformation, densification, spallation, and micro-jetting in nanopowder titanium (np-Ti) during shock. Upon impact, np-Ti undergoes a transition from heterogeneous plasticity, including basal stacking faults (SFs) and {10![[1 with combining macron]](https://www.rsc.org/images/entities/char_0031_0304.gif) 2} twinning, to homogeneous disordering, as the impact velocity increases. Then the nanopowder structure evolves into a bulk nanostructure after the final densification, contributed by pore collapse. The subsequent detwinning arises during the release and tension stage, conducing to a partial structural recovery. When the impact velocity up ≥ 1.0 km s−1, the spallation is following, prompted via GB-sliding and disordering. Upon shock impact, it also facilitates micro-jetting owing to the presence of nanopores, contributing to the pressure gradient and transverse velocity gradient.
2} twinning, to homogeneous disordering, as the impact velocity increases. Then the nanopowder structure evolves into a bulk nanostructure after the final densification, contributed by pore collapse. The subsequent detwinning arises during the release and tension stage, conducing to a partial structural recovery. When the impact velocity up ≥ 1.0 km s−1, the spallation is following, prompted via GB-sliding and disordering. Upon shock impact, it also facilitates micro-jetting owing to the presence of nanopores, contributing to the pressure gradient and transverse velocity gradient.
1. Introduction
Shock consolidation, is a unique technique for materials synthesis, by compacting powders into strong bulk materials using shock waves from an explosive or high-speed collision.1,2 When shock waves pass through, it contributes to an ultrahigh-pressure in the powders. Then the particle undergoes an apparent particle deformation and densification, due to a collapse of powder agglomerates.3 Compared to conventional methods, shock consolidation is one of the most efficient methods to manufacture bulk materials with improved properties.4–6 Many types of metallic powders, including particles with nano-size or nano-scale microstructures, have been consolidated using shock waves.7–17 Zhang et al.16 consolidated 30–50 nm silver nanopowders using shock waves for fully dense bulk nanostructured components. Nieh et al.15 also produced shock-compacted nanostructured bulk from aluminum powders with a size of 40–50 nm.It is extraordinarily difficult to experimentally obtain complete dynamic microscopic information during the process of consolidation, because of the extremely small size and a short time.18 The microstructural features, plasticity deformation in the consolidation process, and the corresponding mechanisms have rarely still unveiled until now, which determine the structures and properties of final bulk nanostructured materials.19 Molecular Dynamics (MD) simulation, is an effective method to clarify the process of shock consolidation, owing to its advantages in revealing atomic-scale structure evolution and interpreting the relevant experiments at the microscopic level. Huang et al.20 performed shock consolidation of Cu nanoparticles and characterized the dynamic tensile response. Mayer et al.21,22 investigated the shock consolidation of nanoparticles into a nanocrystalline coating and studied the plastic deformation of aluminum nanopowder at dynamic compaction. All of their results demonstrated that MD simulation is an effective method for investigating shock consolidation.
Titanium (Ti), a representative hexagonal close-packed (hcp) metal, and its alloys have attractive properties, such as low density, high strength-to-weight ratio, high melting point, excellent biocompatibility, and high corrosion resistance.23–25 Thus, they are widely applied in the aerospace.26 In engineering applications, Ti metal and its alloys are primarily used in the form of bulk polycrystals/nanocrystals. Utilizing the shock consolidation method, to synthesize bulk Ti metal from nanopowder Ti (np-Ti), is an essential technique in this regard. In this work, we systematically investigate the shock response and its microstructure deformation of np-Ti during shock consolidation at different impact velocities (0.5–3.0 km s−1), by conducting nonequilibrium molecular dynamics (NEMD) simulations, orientation mapping (OM), slip vectors and common neighbor analysis (CNA).
2. Model and methods
2.1. The details of models and simulations
Achieving equilibrium poses difficulty for the structure during shock, leading to a non-equilibrium state. NEMD27–30 is particularly suited for studying dynamic behaviours under non-equilibrium conditions, such as our study on diffusion, and strain rates. Additionally, materials are subjected to non-equilibrium processes (e.g., in materials synthesis or nanostructure), NEMD provides a more realistic representation of the system's behaviours. Consequently, the NEMD is implemented in our simulations. The large-scale atomic/molecular massively parallel simulator (LAMMPS)31 and the embedded atom method (EAM) potential developed by Ackland et al.32 are utilized. This potential can accurately describe the plastic properties,33 verified by density functional theory33 and experimental results.34 This potential also presents a reasonable accuracy for shock simulations. To check the performance of such EAM potential during shock loading, we carry out simulations under different shock strengths along different crystallographic orientations in single-crystal Ti. Here we choose the x-axis, parallel to the [0001], [10![[1 with combining macron]](https://www.rsc.org/images/entities/char_0031_0304.gif) 0], and [1
0], and [1![[2 with combining macron]](https://www.rsc.org/images/entities/char_0032_0304.gif) 10] crystallographic directions of the Ti crystal, as the impact direction. To illustrate the consistency between experiment and simulation, we compute wave velocity which describes the velocity of shock wave propagation in the single-crystal Ti configurations via
10] crystallographic directions of the Ti crystal, as the impact direction. To illustrate the consistency between experiment and simulation, we compute wave velocity which describes the velocity of shock wave propagation in the single-crystal Ti configurations via| us = Δx/Δt − u0, | (1) |
The us–up relations of the single-crystal Ti, shocked along three primary crystallographic orientations, i.e., [0001], [10![[1 with combining macron]](https://www.rsc.org/images/entities/char_0031_0304.gif) 0], and [1
0], and [1![[2 with combining macron]](https://www.rsc.org/images/entities/char_0032_0304.gif) 10], respectively [Fig. 1a], are in agreement with the theoretical29 and experimental results.33 The functions of pressure vs. normalized specific density (ρ/ρ0) are shown in Fig. 1b. Our simulation results are consistent with the experiments. It presents a reasonable accuracy of this potential for shock simulations from the results above.
10], respectively [Fig. 1a], are in agreement with the theoretical29 and experimental results.33 The functions of pressure vs. normalized specific density (ρ/ρ0) are shown in Fig. 1b. Our simulation results are consistent with the experiments. It presents a reasonable accuracy of this potential for shock simulations from the results above.
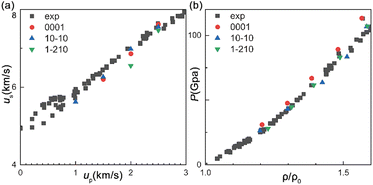 | ||
| Fig. 1 (a) The us–up plots obtained from our MD simulations, and experiments.33 (b) The corresponding plots of pressure (P) vs. normalized specific density (ρ/ρ0). | ||
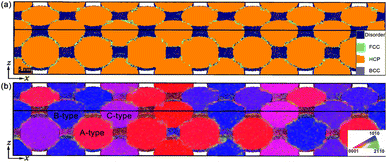
The np-Ti systems, with the three-dimensional nanoparticle superlattice structure, similar to face-centered cubic (FCC) crystal, are constructed, containing 28 spherical grains with an identical diameter (∼14.75 nm). Three types of grains are included, denoted as A, B, and C, respectively [Fig. 2b]. They are oriented relative to the x-axis ([0001] in A) by an angle of φ = 0°, 45°, and 90°, respectively. The dimensions of the configurations are about 146 × 20 × 20 nm3 [Fig. 2a], consisting of approximately 2.8 million atoms. To consider the potential size effects, we also construct an np-Ti system with the bigger particles (∼29.5 nm), containing about 18 million atoms. The configurations are first relaxed at 800 K, and then thermalized at the ambient conditions with a constant pressure-temperature (NPT) ensemble and 3D periodic boundary conditions, prior to shock loading. Thermal-induced stacking faults (SFs) and grain boundary-sliding (GB-sliding) are observed owing to their instabilities, leading to the change of grain shape [Fig. 2a].
Shock simulations are then performed with the microcanonical ensemble (NVE). Periodic boundary conditions are applied along the y and z axes, while a free boundary is applied along the x axis which is the shock direction. The time step for integration of the equation of motion is 1 fs. The small region on the left is set as the piston35 in our shock simulations. The interactions between the piston and the rest of the atoms in the configuration are described with the same interatomic potential, while the atoms in the piston do not participate in MD. An atomic piston delivers the shock with the piston velocity of up, ranging from 0.5 to 3.0 km s−1, starting at time t = 0 from x = 0 along the x-axis towards the free surface. After the piston is loaded to t = 40 ps and stopped, creating a release fan propagates toward the free surface. This release fan interacts with that due to the shock reflection from the surface and induces release and subsequent tension within the target interior.36
2.2. Analysis methodology
To describe the response during shock loading, we perform the 1D and 2D binning analyses,36 resolving spatially physical properties such as stresses σij (i, j = x, y, z). The bin width is 0.5 nm. The center-of-mass velocity![[v with combining macron]](https://www.rsc.org/images/entities/i_char_0076_0304.gif) i of a bin is removed when calculating σij within each bin: Δσij = −(m/Va)
i of a bin is removed when calculating σij within each bin: Δσij = −(m/Va)![[v with combining macron]](https://www.rsc.org/images/entities/i_char_0076_0304.gif) i
i![[v with combining macron]](https://www.rsc.org/images/entities/i_char_0076_0304.gif) j, where m is the atomic mass and Va is the atomic volume averaged over the bin. The pressure is obtained as
j, where m is the atomic mass and Va is the atomic volume averaged over the bin. The pressure is obtained as
 | (2) |
While the shear stress τ is defined as:
 | (3) |
To characterize the microstructure deformation, the CNA37 and slip vector methods38,39 are also implemented. To better reveal orientation effects and visualize the plasticity, such as the twins within the shocked crystals, we also performed OM analysis, following standard electron backscatter diffraction (EBSD) analysis.40
For hcp metals, the crystal orientation with respect to a reference coordinate system is also represented by a three-dimensional orthogonal rotation matrix R. Thus the hexagonal coordinate crystal system should first be transformed to the orthogonal coordinate system and the three crystallographic axes in the orthogonal coordinate system, where a1: [100], a2: [010], and a3: [001] correspond to the [0001], [10![[1 with combining macron]](https://www.rsc.org/images/entities/char_0031_0304.gif) 0], and [1
0], and [1![[2 with combining macron]](https://www.rsc.org/images/entities/char_0032_0304.gif) 10] directions in the hexagonal system, respectively. Then, R can be defined as the misorientation between three crystallographic axes, ai (i = 1, 2, and 3), and the x, y, and z axes in the coordinate system of observation. The direction angles αi, βi, γi (i = 1, 2, and 3) are defined as those between ai and the x, y, and z axes, respectively. The rotation matrix R is then expressed in terms of direction cosines as
10] directions in the hexagonal system, respectively. Then, R can be defined as the misorientation between three crystallographic axes, ai (i = 1, 2, and 3), and the x, y, and z axes in the coordinate system of observation. The direction angles αi, βi, γi (i = 1, 2, and 3) are defined as those between ai and the x, y, and z axes, respectively. The rotation matrix R is then expressed in terms of direction cosines as
 | (4) |
For a perfect hcp lattice, a set of 12 vectors, pointing from the central atom to its 12 nearest neighbors, is defined and ![[m with combining circumflex]](https://www.rsc.org/images/entities/i_char_006d_0302.gif) , which is normal to the mirror plane and has a positive projection in the z axis, is chosen as a unit vector corresponding to [0001]. The vector
, which is normal to the mirror plane and has a positive projection in the z axis, is chosen as a unit vector corresponding to [0001]. The vector ![[n with combining circumflex]](https://www.rsc.org/images/entities/i_char_006e_0302.gif) pointing from the central atom to one of its nearest neighbors on the mirror plane is taken as the second unit vector, corresponding to [1
pointing from the central atom to one of its nearest neighbors on the mirror plane is taken as the second unit vector, corresponding to [1![[2 with combining macron]](https://www.rsc.org/images/entities/char_0032_0304.gif) 10]. Thus, the crystallographic directions ai in the orthogonal coordinate system, corresponding to [0001], [10
10]. Thus, the crystallographic directions ai in the orthogonal coordinate system, corresponding to [0001], [10![[1 with combining macron]](https://www.rsc.org/images/entities/char_0031_0304.gif) 0], and [1
0], and [1![[2 with combining macron]](https://www.rsc.org/images/entities/char_0032_0304.gif) 10] in the hexagonal system, can be expressed as
10] in the hexagonal system, can be expressed as
(a1,a2,a3) = (![[n with combining circumflex]](https://www.rsc.org/images/entities/i_char_006e_0302.gif) , ,![[m with combining circumflex]](https://www.rsc.org/images/entities/i_char_006d_0302.gif) × × ![[n with combining circumflex]](https://www.rsc.org/images/entities/i_char_006e_0302.gif) , ,![[m with combining circumflex]](https://www.rsc.org/images/entities/i_char_006d_0302.gif) ). ).
| (5) |
Given ai and the x, y, and z axes, the nine direction angles αi, βi, and γi can be obtained, and therefore rotation matrix R can be computed with eqn (3). For an atom within a deformed region, there are nCN direction vectors from which ai is selected. Only the crystallites centered at an atom under consideration are deemed resolvable if 10 ≤ nCN ≤ 14, while other crystallites are considered as “unresolvable,” similar to unresolvable areas in experimental EBSD analysis. The values of ai for an arbitrary crystallite may deviate from those for a perfect lattice, leading to different direction angles, and R.
Given the R matrix for “each crystallite,” the orientation vectors Q, representing the projection of the system axes, X, onto the crystal system, can be obtained as
| Q = R·X, | (6) |
Which can also be expressed as
 | (7) |
For example, the crystal system projections of the reference system axes, i.e., x, y, and z axes, can be obtained as Qx = (cos![[thin space (1/6-em)]](https://www.rsc.org/images/entities/char_2009.gif) α1, cos
α1, cos![[thin space (1/6-em)]](https://www.rsc.org/images/entities/char_2009.gif) α2, cos
α2, cos![[thin space (1/6-em)]](https://www.rsc.org/images/entities/char_2009.gif) α3), Qy = (cos
α3), Qy = (cos![[thin space (1/6-em)]](https://www.rsc.org/images/entities/char_2009.gif) β1, cos
β1, cos![[thin space (1/6-em)]](https://www.rsc.org/images/entities/char_2009.gif) β2, cos
β2, cos![[thin space (1/6-em)]](https://www.rsc.org/images/entities/char_2009.gif) β3), and Qz = (cos
β3), and Qz = (cos![[thin space (1/6-em)]](https://www.rsc.org/images/entities/char_2009.gif) γ1, cos
γ1, cos![[thin space (1/6-em)]](https://www.rsc.org/images/entities/char_2009.gif) γ2, cos
γ2, cos![[thin space (1/6-em)]](https://www.rsc.org/images/entities/char_2009.gif) γ3), respectively.
γ3), respectively.
Then, a normalized vector C, representing the orientation in red-green-blue (RGB) color, can be obtained via
| C = (C1,C2,C3) | (8) |
 | (9) |
 and Q3 ≥ 0. For digital eight-bit color, the numerical representation of the “orientation mapping” (OM) vector QOM can be expressed as
 | (10) |
![[1 with combining macron]](https://www.rsc.org/images/entities/char_0031_0304.gif) 0], and [1
0], and [1![[2 with combining macron]](https://www.rsc.org/images/entities/char_0032_0304.gif) 10] are denoted with the primary colors red, green, and blue, respectively [Fig. 2b].
10] are denoted with the primary colors red, green, and blue, respectively [Fig. 2b].
However, the crystallographic direction for hcp systems is described with four indices in the hexagonal coordination systems, and the orientation vector of a crystallite, Qhex, can be transformed from its counterpart Q in the orthogonal coordinate system via
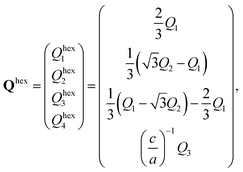 | (11) |
To quantitatively describe the dislocation slips and sliding, including their amount and direction, e on the atomic scale, the slip vector method is implemented, which is defined as
 | (12) |
3. Results and discussion
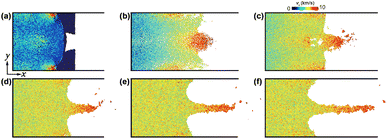
The shock simulations show no significant difference in plastic deformation for particles with a diameter smaller than 50 nm. For convenience, this paper discusses the simulation results of the configuration with the smaller system. The NEMD simulations of shock loading in np-Ti are performed for a range of particle velocities from 0.5 to 3.0 km s−1. During shock, wave propagation and interactions undergo a series of stages in np-Ti, including impact-induced shocks, subsequent release fans originating at free surfaces, and interaction of the opposing release fans, resulting in well-defined shock compression, release, tension, spallation, and micro-jetting.3.1. Shock compression stage
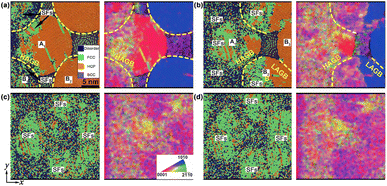
As shock strength increases (Fig. 3), plastic deformation during compression transitions from heterogeneous to homogeneous deformation along the transverse directions. At lower impact velocities (up = 0.5 km s−1), compression-induced plastic deformation exhibits anisotropy, with a preference for occurring at grain surfaces and near grain boundaries rather than within the internal grain structure [Fig. 3a].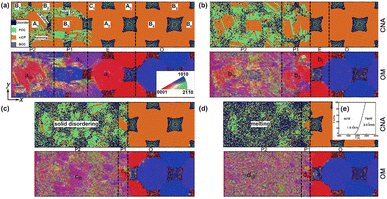 | ||
| Fig. 3 Atomic configurations and the corresponding OM for np-Ti during shock compression, at (a) up = 0.5 km s−1 (t = 16 ps), (b) 1.0 km s−1 (t = 14 ps), (c) 1.5 km s−1 (t = 12 ps), and (d) 2.0 km s−1 (t = 10 ps), respectively. (e) The calculated phase diagram42 for titanium in the P–T plane, which presents the point of 1.5 km s−1 (P = 24 GPa, T = 1800 K) and 2.0 km s−1 (P = 37 GPa, T = 2600 K) are located in the solid and liquid region, respectively. O: unshocked; E: elastic wave; P1: the plastic wave after yield; P2: the stable plastic wave. Regions I, II, and III represent different regions, which are also shown in Fig. 4. A1–C1: different grains. | ||
At lower-impact velocities (up = 0.5 km s−1), the compression-induced plastic deformation is anisotropic and prefers to arise at grain surfaces and near grain boundaries rather than internal grain [Fig. 3a]. This anisotropy causes the stress concentration or localization and leads to some plateaus of the stress (e.g., τ) [I–III, Fig. 4a]. It is also found that the density of SFs and twins within C-type grains is significantly lower than that in A- and B-type grains [Fig. 3a]. As a result, the compression-induced plasticity presents a strong dependence on the crystallographic orientation, leading to heterogeneous plastic deformation.
Two deformation procedures are included as up = 1.0 km s−1, i.e., the first heterogeneous at the shock front and the subsequent homogeneous plasticity behind. For the former, the crystallographic orientation dependence on the plasticity contributes to an apparent heterogeneity. For instance, the SFs are shown more difficult to activate in A-type grains, while easily within C-type grains [Fig. 3b]. The corresponding shear stress τ within A-type grain is higher than that within C-type grain [Fig. 4b]. For the latter, the density of SFs increases rapidly, with the SFs' nucleation and extension increasing, triggering a uniform distribution of plasticity within the grains [Fig. 3b]. Then the stress significantly decreases, and becomes more homogeneous [region III, Fig. 4b]. In addition, deformation twinning also presents a strong dependence of the crystallographic orientation. Upon impact, it is almost no deformation twinning arises within C-type grains, at up = 1.0 km s−1.
At the higher impact velocities (up ≥ 1.5 km s−1), the disordering within grains [Fig. 3c and d], related to the interaction of SFs, is governing structure deformation. Such disordering consists of two types: (i) the amorphization or solid-disordering (up = 1.5 km s−1); and (ii) the melting or the liquid (up = 2.0 km s−1). When up = 1.5 km s−1, solid-disordering, rather than melting, is dominated, owing to the corresponding P–T point is located at the solid region (P = 24 GPa, T = 1800 K, inset in Fig. 3). The corresponding diffusion coefficient is D ∼ 10−11 m2 s−1, much smaller than the ones for liquid (D ∼ 10−9 m2 s−1),41 confirming the solid state. During compression, such solid-disordering also presents a strong crystallographic dependence. For instance, amorphization or solid-state disordering prefers to arise within A-type grains [Fig. 3c], rather than B- and C-type grains, where only one type of SFs is emitted. Further to increase impact velocities [up = 2.0 km s−1, Fig. 3d], the numerous SFs homogeneously nucleate at grains and lead to melting within all grains. The corresponding P–T point is located in the liquid region [inset, Fig. 3], and the calculated D reaches 10−7 m2 s−1, in these disordering regions, consistent with that in liquid crystal,41 confirming the melting state. Contributed by the plasticity and disordering behind wave front, the subsequent collapse of nanopores accelerates the shrinkage and complete annihilation of voids, facilitating the nanopowder structure to evolve into a bulk nanostructure after pore collapse, and leading to the shock consolidations of np-Ti finally.
Based on the simulation results above, shock-induced deformation transitions from heterogeneous deformation to homogeneous disordering with the increase of the impact velocities. Simultaneously, the plastic deformation is also dependent on the microstructures, i.e., crystallographic orientation and GB characteristics, during shock. However, the underlying mechanism governing such anisotropy is still unrevealed. Thus, an explicit description of deformation, i.e., the evolutionary process and interaction with the microstructure, is necessary.
![[1 with combining macron]](https://www.rsc.org/images/entities/char_0031_0304.gif) 2}<10
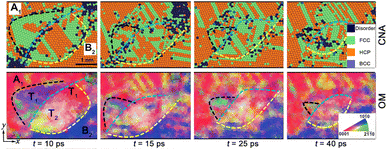
2}<10![[1 with combining macron]](https://www.rsc.org/images/entities/char_0031_0304.gif) 1> twinning (extension twinning, T1) prompts a typical rotated variant within shocked grain A1 (t = 10 ps, Fig. 5); while {10
1> twinning (extension twinning, T1) prompts a typical rotated variant within shocked grain A1 (t = 10 ps, Fig. 5); while {10![[1 with combining macron]](https://www.rsc.org/images/entities/char_0031_0304.gif) 2}<10
2}<10![[1 with combining macron]](https://www.rsc.org/images/entities/char_0031_0304.gif) 1>twins and the other twinning type, i.e., {10
1>twins and the other twinning type, i.e., {10![[1 with combining macron]](https://www.rsc.org/images/entities/char_0031_0304.gif) 1}<10
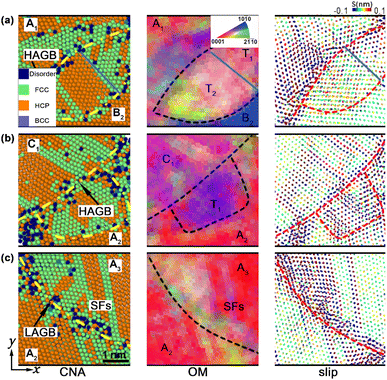
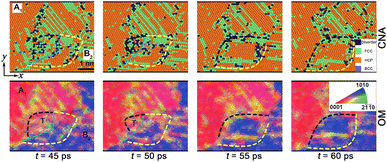
1}<10![[1 with combining macron]](https://www.rsc.org/images/entities/char_0031_0304.gif) 2> twins (compression twinning, T2), are nucleated within grain B2. Prompted by SFs, the twin boundary (TB) coarsening arises and then evolves into the typical GB. It also facilitates the GB migration, leading to the growth (t = 15 ps) and the subsequent shrinkage of the gains (t = 25 ps). Deformation twinning almost originates from the GBs and GB junctions and grows towards the interior (Fig. 6). In our simulations, two types of GBs, i.e., high-angle grain boundaries (HAGBs, with the large misorientation angle >5°) and low-angle grain boundaries (LAGBs, with the smaller misorientation angle <5°), are formed in np-Ti during shock consolidation. For HAGBs, the shock first induces GB-gliding and then mediates {10
2> twins (compression twinning, T2), are nucleated within grain B2. Prompted by SFs, the twin boundary (TB) coarsening arises and then evolves into the typical GB. It also facilitates the GB migration, leading to the growth (t = 15 ps) and the subsequent shrinkage of the gains (t = 25 ps). Deformation twinning almost originates from the GBs and GB junctions and grows towards the interior (Fig. 6). In our simulations, two types of GBs, i.e., high-angle grain boundaries (HAGBs, with the large misorientation angle >5°) and low-angle grain boundaries (LAGBs, with the smaller misorientation angle <5°), are formed in np-Ti during shock consolidation. For HAGBs, the shock first induces GB-gliding and then mediates {10![[1 with combining macron]](https://www.rsc.org/images/entities/char_0031_0304.gif) 1}<10
1}<10![[1 with combining macron]](https://www.rsc.org/images/entities/char_0031_0304.gif) 2> and {10
2> and {10![[1 with combining macron]](https://www.rsc.org/images/entities/char_0031_0304.gif) 2}<10
2}<10![[1 with combining macron]](https://www.rsc.org/images/entities/char_0031_0304.gif) 1> twins within grain B2, giving rise to the apparent lattice rotations, along with the stress release. Then another {10
1> twins within grain B2, giving rise to the apparent lattice rotations, along with the stress release. Then another {10![[1 with combining macron]](https://www.rsc.org/images/entities/char_0031_0304.gif) 2}<10
2}<10![[1 with combining macron]](https://www.rsc.org/images/entities/char_0031_0304.gif) 1> twins within grain A2 are followed, due to GB-sliding [Fig. 6a and b]. It is deduced that the HAGBs promote the twins' nucleation and growth. For LAGBs, no GB-sliding arises, inhibiting the emission of deformation twinning, although the SFs originate from the GB and propagate toward both grains [grain A2 and A3, Fig. 6c].
1> twins within grain A2 are followed, due to GB-sliding [Fig. 6a and b]. It is deduced that the HAGBs promote the twins' nucleation and growth. For LAGBs, no GB-sliding arises, inhibiting the emission of deformation twinning, although the SFs originate from the GB and propagate toward both grains [grain A2 and A3, Fig. 6c].
3.2. Release and tension stage
When two release fans interact with each other, it triggers tension and the subsequent detwinning and spallation in the np-Ti. Is it reversible for the plastic deformation? What is the mechanism of spallation? To answer these questions, an explicit description of their evolution is necessary.![[1 with combining macron]](https://www.rsc.org/images/entities/char_0031_0304.gif) 2} extension twinning in the hexagonal-closed pack (HCP) metals,43 such as Ti and Mg. Conducting the time-resolved, in situ synchrotron X-ray diffraction shock experiments, Williams et al. observed significant twinning during compression and the detwinning during release, in the FG AMX602 magnesium alloy.44 Yu et al.45 directly observed the fundamental morphology evolution of twinning-detwinning in the single-crystal Mg, during tension-compression loading along <0001>. Their results indicated that lots of {10
2} extension twinning in the hexagonal-closed pack (HCP) metals,43 such as Ti and Mg. Conducting the time-resolved, in situ synchrotron X-ray diffraction shock experiments, Williams et al. observed significant twinning during compression and the detwinning during release, in the FG AMX602 magnesium alloy.44 Yu et al.45 directly observed the fundamental morphology evolution of twinning-detwinning in the single-crystal Mg, during tension-compression loading along <0001>. Their results indicated that lots of {10![[1 with combining macron]](https://www.rsc.org/images/entities/char_0031_0304.gif) 2} twin lamellae formed at tension stage, became smaller and shorter, and even vanished thoroughly, under the reverse compression.
2} twin lamellae formed at tension stage, became smaller and shorter, and even vanished thoroughly, under the reverse compression.The reversible detwinning can also be observed in np-Ti, by characterizing the microstructures at the compression and tension. During tension, the {10![[1 with combining macron]](https://www.rsc.org/images/entities/char_0031_0304.gif) 2}<10
2}<10![[1 with combining macron]](https://www.rsc.org/images/entities/char_0031_0304.gif) 1> extension twinning (T1), which formed in grain A1 during shock (t = 10 ps, Fig. 5) exhibits a noticeable orientation change, gradually reverting from the variant phase to its parent phase (t = 40 ps, Fig. 5), although it is not recovered completely. Similarly, the another detwinning, i.e., the reversed {10
1> extension twinning (T1), which formed in grain A1 during shock (t = 10 ps, Fig. 5) exhibits a noticeable orientation change, gradually reverting from the variant phase to its parent phase (t = 40 ps, Fig. 5), although it is not recovered completely. Similarly, the another detwinning, i.e., the reversed {10![[1 with combining macron]](https://www.rsc.org/images/entities/char_0031_0304.gif) 1}<10
1}<10![[1 with combining macron]](https://www.rsc.org/images/entities/char_0031_0304.gif) 2> twinning, also arises within grain B2 at the tension stage (t = 40 ps, Fig. 5), they tend to be completely recovered, as shown in Fig. 9. Consequently, this reversible twinning-detwinning procedure prompts the structural recovery in the materials during shock and the subsequent tension loading. Such twinning-detwinning of nanopowder materials is in accordance with the research of Williams44 and Yu.45
2> twinning, also arises within grain B2 at the tension stage (t = 40 ps, Fig. 5), they tend to be completely recovered, as shown in Fig. 9. Consequently, this reversible twinning-detwinning procedure prompts the structural recovery in the materials during shock and the subsequent tension loading. Such twinning-detwinning of nanopowder materials is in accordance with the research of Williams44 and Yu.45
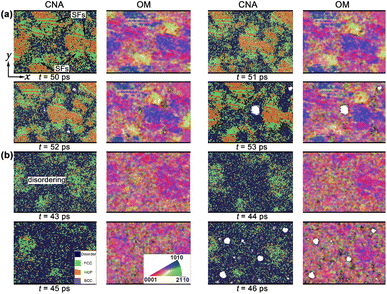 | ||
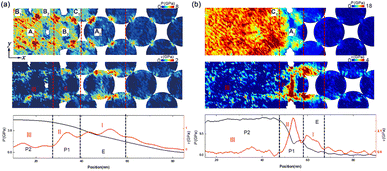
| Fig. 10 Deformation and spallation of np-Ti during release and tension stages, and the corresponding orientation maps. (a) up = 1.0 km s−1; (b) up = 1.5 km s−1. | ||
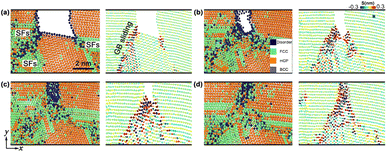
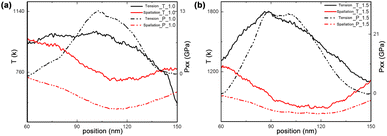
The disordering within the np-Ti is another important mechanism to promote the occurrence of spallation [Fig. 10b], with the increase of impact velocity (up = 1.5 km s−1). During tension, the np-Ti first becomes progressively disordered at an early stage [t = 44 ps, Fig. 10b], which then provides the conditions for void nucleation (t = 45 ps). Along with the nucleation of lots of voids in the disorder regions (t = 46 ps), the material structure eventually fails. Such disordering is essentially the result of melting leading to the softening of the local structure of np-Ti, owing to the plastic deformation in disordered regions, where dislocation slips accelerates the mechanical strength release and mobility of materials.48,49 It is shown that the corresponding pressure (P) at the tension stage decreases dramatically and eventually develops the tensile stress during tension; while the corresponding deformation exhibits a pronounced endothermic feature (Fig. 11), i.e., T decreases significantly, similar to the melting process of the crystals. Meanwhile, it is also observed that the decrease in T is much greater at 1.5 km s−1 than at 1.0 km s−1, indicating a higher degree of melting (Fig. 11). We calculate the atomic diffusion coefficient (D) for the tensile region at both shock velocities to characterize the melting-induced softening. For up = 1.0 km s−1, the corresponding D is approximately 10−11 m2 s−1, much smaller than the ones for liquid (D ∼ 10−9 m2 s−1),41 consisting with the characteristics of a solid structure, i.e. not softening enough. For up = 1.5 km s−1, the corresponding D is approximately 10−8 m2 s−1 (>10−9 m2 s−1), similar to a liquid, confirming the melting-induced softening. The spallation strength for liquid is lower than that for the solids, indicating that spallation is more likely to occur in the liquid regions.50
3.3. Micro-jetting
When impact velocity exceeds 2.0 km s−1, the uneven free surface of np-Ti tends to form micro-jetting. Here, Fig. 12 shows the evolution of the micro-jetting, including its growth in lateral and longitudinal dimensions, and the following necking. The growth of micro-jetting, first contributes to pronounced mass accumulation until t = 23 ps; and then, the following necking prompts the fission of jetting head. Both mass accumulation and necking can be attributed to the velocity gradients along the x-direction. It is shown that the vx for the jet head region is higher than in the other part, giving rise to two competing phenomena: the mass accumulation in the head and necking behind it.51 The decrease in their velocity gradients then reduces the mass accumulation and accelerates the necking at later times, which causes the subsequent fragmentation of a jet.To examine jetting formation in details, we perform 2D binning analyse. Fig. 13 presents 2D spatial distributions in terms of particle velocity (vy), and pressure (P). vy is symmetric about the axis of symmetry and is of the opposite sign near the free surface above and below the groove [Fig. 13a], leading to a more concentrated particle distribution in the jet column, making it less prone to rupture. Fig. 13b shows the induced pressure gradient, which drives the outward movement of atoms and thus jet formation. In summary, the fundamental mechanism for jet formation can be attributed to the pressure gradient and transverse velocity gradient near the metal–vacuum interface drives jetting, while the longitudinal velocity in the opposite direction keeps the jet column stable.
 | ||
| Fig. 13 (a) The velocity in the y direction vy; (b) two-dimensional pressure distribution P. up = 3.0 km s−1, t = 20 ps. | ||
4. Discussion
When shock waves pass through, it contributes to an ultra-high pressure in the powders. Then the particle undergoes an apparent particle deformation and densification, due to a collapse of powder agglomerates. Compared to conventional methods, shock consolidation is one of the most efficient methods to manufacture bulk materials with improved properties. Our simulations on shock-loaded np-Ti present apparent mechanism of consolidation at the atomic level: i.e., (i) the GB-sliding and SFs govern the densification process at the lower velocities; and (ii) melt-induced the flow deformation governs the filling of cavities at the higher velocities.Comparing our simulation results with the experimental analysis, our simulation presents more details of consolidation process than experiments and other simulations, which determine the structures and properties of final bulk nanostructured materials. For instance, experimentally, Matsumoto52 found that molten jet, dynamic friction of particles, and the plastic deformation around a void, facilitate the compaction, using an analysis of scanning electronic microscope (SEM). It is validated by the following experiments on fabrication of fine-grained W–Cu composites.53 In Kondo's experiment,54 it presented that local heating, induced by plasticity, accelerates the consolidation. Gao55 proposed a melting-welding consolidation mechanism based on the experiment for metallic powder with a random arrangement, which is similar to our simulated consolidation mechanism, but Gao's experiments did not go down to the atomic level to capture the microstructural features of the consolidation process and the corresponding mechanism. Thus, shock consolidation can be governed via varying the impact velocity as well as controlling the plastic deformation around the void.
5. Conclusions
Using MD simulations, we studied the plastic deformation, densification, spallation damage, and micro-jetting in np-Ti under shock impact and revealed the deformation modes in the consolidation and the corresponding mechanisms. The main conclusions are listed below:(a) Upon impact, it undergoes a transition from the heterogeneous plasticity, such as basal SFs and deformation twinning to the homogeneous disordering, with the increase of impact velocity.
(b) The plasticity and GB-sliding enable the shearing in the grains at lower velocities, and allow their movement toward the pores, while melt-induced the flow deformation governs the filling of cavities at the higher velocities, both contributing to the nanopowder structure to evolve into a bulk nanostructure, and the final densification.
(c) The release and tension wave conduces to a detwinning, and the subsequent spallation in np-Ti. The {10![[1 with combining macron]](https://www.rsc.org/images/entities/char_0031_0304.gif) 2} twin formed in compression undergoes an apparent shrinkage and the final annihilation, exhibiting a reversibility.
2} twin formed in compression undergoes an apparent shrinkage and the final annihilation, exhibiting a reversibility.
(d) Two mechanisms govern the spallation at up ≥ 1.0 km s−1: (i) GB-siding, via facilitating the nucleation and growth of numerous voids adjacent to GBs; and (ii) disordering, via softening the local structure of np-Ti.
(e) The pressure gradient and transverse velocity gradient near the metal–vacuum interface drives microjetting, owing to unevenness of free surface for np-Ti, at higher impact velocities.
Conflicts of interest
The authors have no conflicts to disclose.Acknowledgements
We acknowledge the support of Natural Science Foundation (NSF) of China (Grant no. 11802092 and no. U2230401), NSF of Hunan Province (Grant no. 2019JJ50221, 2019JJ40127, 2020JJ5260, and 2020JJ4375), the Funding of the Hunan Education Department Project (20A248 and 22B0225), the Double first-class construction project of Hunan Agricultural University (no. SYL2019063), Hunan Postgraduate Students Scientific Research and Innovation Program (no. CX20230682) and the computation platform of the National Super Computer Center in Changsha (NSCC).References
- K. Chen, Z. Jin, J. Li, G. Kennedy, Z. L. Wang, N. N. Thadhani, H. Zeng, S.-F. Cheng and J. P. Liu, J. Appl. Phys., 2004, 96, 1276–1278 CrossRef CAS.
- Z. Jin, K. Chen, J. Li, H. Zeng, S.-F. Cheng, J. Liu, Z. Wang and N. Thadhani, Acta Mater., 2004, 52, 2147–2154 CrossRef CAS.
- Q. Zhou and P. Chen, J. Alloys Compd., 2016, 657, 215–223 CrossRef CAS.
- M. A. Meyers, Dynamic Behavior of Materials, John wiley & sons, 1994 Search PubMed.
- N. N. Thadhani, Prog. Mater. Sci., 1993, 37, 117–226 CrossRef CAS.
- V. Viswanathan, T. Laha, K. Balani, A. Agarwal and S. Seal, Mater. Sci. Eng., R, 2006, 54, 121–285 CrossRef.
- S. Ando, Y. Mine, K. Takashima, S. Itoh and H. Tonda, J. Mater. Process. Technol., 1999, 85, 142–147 CrossRef.
- M. Brochu, T. Zimmerly, L. Ajdelsztajn, E. J. Lavernia and G. Kim, Mater. Sci. Eng., A, 2007, 466, 84–89 CrossRef.
- G. A. Emelchenko, I. G. Naumenko, V. A. Veretennikov and Y. A. Gordopolov, Mater. Sci. Eng., A, 2009, 503, 55–57 CrossRef.
- W. H. Gourdin, Mater. Sci. Eng., 1984, 67, 179–184 CrossRef CAS.
- Z. Q. Jin, K. H. Chen, J. Li, H. Zeng, S. F. Cheng, J. P. Liu, Z. L. Wang and N. N. Thadhani, Acta Mater., 2004, 52, 2147–2154 CrossRef CAS.
- P. Kasiraj, T. Vreeland, R. B. Schwarz and T. J. Ahrens, Acta Metall., 1984, 32, 1235–1241 CrossRef CAS.
- A. G. Mamalis and G. N. Gioftsidis, J. Mater. Process. Technol., 1990, 23, 333–345 CrossRef.
- D. G. Morris, Mater. Sci. Eng., 1983, 57, 187–195 CrossRef CAS.
- T. G. Nieh, P. Luo, W. Nellis, D. Lesuer and D. Benson, Acta Mater., 1996, 44, 3781–3788 CrossRef CAS.
- L. Zhang, A. M. Elwazri, T. Zimmerly and M. Brochu, Mater. Sci. Eng., A, 2008, 487, 219–227 CrossRef.
- H. N. Kim, S. N. Chang and D. K. Kim, Scr. Mater., 2009, 61, 871–874 CrossRef CAS.
- J. Feng, J. Xie, M. Zhang, X. Liu, Q. Zhou, R. Yang and P. Chen, J. Appl. Phys., 2020, 127, 234101 CrossRef.
- R. Sarathi, T. K. Sindhu, S. R. Chakravarthy, A. Sharma and K. V. Nagesh, J. Alloys Compd., 2009, 475, 658–663 CrossRef CAS.
- L. Huang, W. Z. Han, Q. An, W. A. Goddard III and S. N. Luo, J. Appl. Phys., 2012, 111, 095101 Search PubMed.
- A. E. Mayer and A. A. Ebel, J. Appl. Phys., 2017, 122, 150903 CrossRef.
- A. E. Mayer, A. A. Ebel and M. K. A. Al-Sandoqachi, Int. J. Plast., 2020, 124, 22–41 CrossRef CAS.
- A. S. Khan and H. Liu, Int. J. Plast., 2012, 37, 1–15 CrossRef CAS.
- Z. W. Wyatt, W. J. Joost, D. Zhu and S. Ankem, Int. J. Plast., 2012, 39, 119–131 CrossRef CAS.
- T. Hama, A. Kobuki and H. Takuda, Int. J. Plast., 2017, 91, 77–108 CrossRef CAS.
- B. Feng and V. I. Levitas, Int. J. Plast., 2017, 96, 156–181 CrossRef CAS.
- S. R. Niezgoda, A. K. Kanjarla, I. J. Beyerlein and C. N. Tomé, Int. J. Plast., 2014, 56, 119–138 CrossRef CAS.
- H. Wang, P. Wu, J. Wang and C. Tomé, Int. J. Plast., 2013, 49, 36–52 CrossRef CAS.
- H. Zong, T. Lookman, X. Ding, S.-N. Luo and J. Sun, Acta Mater., 2014, 65, 10–18 CrossRef CAS.
- J. Rodriguez-Nieva, C. Ruestes, Y. Tang and E. Bringa, Acta Mater., 2014, 80, 67–76 CrossRef CAS.
- S. Plimpton, J. Comput. Phys., 1995, 117, 1–19 CrossRef CAS.
- G. J. Ackland, Philos. Mag., 1992, 66, 917–932 CrossRef CAS.
- C. Woodward, D. R. Trinkle, L. G. Hector and D. L. Olmsted, Phys. Rev. Lett., 2008, 100, 045507 CrossRef CAS PubMed.
- D. Singh, in Forcefields for Atomistic-Scale Simulations: Materials and Applications, ed. A. Verma, S. Mavinkere Rangappa, S. Ogata and S. Siengchin, Springer Nature Singapore, Singapore, 2022,99, pp. 99–122 Search PubMed.
- B. L. Holian and P. S. Lomdahl, Science, 1998, 280, 2085–2088 CrossRef CAS PubMed.
- S.-N. Luo, Q. An, T. C. Germann and L.-B. Han, J. Appl. Phys., 2009, 106, 045103 Search PubMed.
- G. J. Ackland and A. P. Jones, Phys. Rev. B: Condens. Matter Mater. Phys., 2006, 73, 054104 CrossRef.
- L. Wang, F. Zhao, F. P. Zhao, Y. Cai, Q. An and S. N. Luo, J. Appl. Phys., 2014, 115, 223106 Search PubMed.
- J. F. Tang, J. C. Xiao, L. Deng, W. Li, X. M. Zhang, L. Wang, S. F. Xiao, H. Q. Deng and W. Y. Hu, Phys. Chem. Chem. Phys., 2018, 20, 28039–28048 RSC.
- V. Randle, Microtexture Determination and its Applications, CRC Press, 2023 Search PubMed.
- F. Zhao, B. Li, W. Jian, L. Wang and S. Luo, J. Appl. Phys., 2015, 118, 224702 Search PubMed.
- S. Pecker, S. Eliezer, D. Fisher, Z. Henis and Z. Zinamon, J. Appl. Phys., 2005, 98, 043516 CrossRef.
- Q. Sun, T. Xia, L. Tan, J. Tu, M. Zhang, M. Zhu and X. Zhang, Mater. Sci. Eng., A, 2018, 735, 243–249 CrossRef CAS.
- S. Chen, Y. Li, N. Zhang, J. Huang, H. Hou, S. Ye, T. Zhong, X. Zeng, D. Fan and L. Lu, Phys. Rev. Lett., 2019, 123, 255501 CrossRef CAS PubMed.
- Q. Yu, J. Zhang and Y. Jiang, Philos. Mag. Lett., 2011, 91, 757–765 CrossRef CAS.
- Y. Ashkenazy and R. S. Averback, Appl. Phys. Lett., 2005, 86, 214701 CrossRef.
- S. Srinivasan, M. Baskes and G. Wagner, J. Appl. Phys., 2007, 101, 065902 CrossRef.
- T. Kvačkaj, A. Kováčová, M. Kvačkaj, R. Kočiško, L. Lityńska-Dobrzyńska, V. Stoyka and M. Miháliková, Micron, 2012, 43, 720–724 CrossRef.
- Y. C. Lin, Q. Wu, G. D. Pang, X. Y. Jiang and D. G. He, Adv. Enzyme, 2020, 22, 1901193 CAS.
- Y. Liao, M. Xiang, X. Zeng and J. Chen, Mech. Mater., 2015, 84, 12–27 CrossRef.
- B. Li, F. Zhao, H. Wu and S. Luo, J. Appl. Phys., 2014, 115, 073504 CrossRef.
- H. Matsumoto and K.-I. Kondo, J. Mater. Sci., 1989, 24, 4042–4047 CrossRef CAS.
- Q. Zhou and P. Chen, J. Alloys Compd., 2016, 657, 215–223 CrossRef CAS.
- K.-I. Kondo and S. Sawai, J. Am. Ceram. Soc., 1990, 73(7), 1983–1991 CrossRef CAS.
- J. Gao, B. Shao and K. Zhang, J. Appl. Phys., 1991, 69, 7547–7555 CrossRef CAS.
| This journal is © The Royal Society of Chemistry 2024 |

