 Open Access Article
Scalable synthesis of high-quality, reduced graphene oxide with a large C/O ratio and its dispersion in a chemically modified polyimide matrix for electromagnetic interference shielding applications
Zahid Mehmood ,
Syed Aizaz Ali Shah
 *,
Saeed Omer,
Ramsha Idrees and
Shaukat Saeed
 *
*
Department of Chemistry, Pakistan Institute of Engineering and Applied Sciences (PIEAS), Islamabad-45650, Pakistan. E-mail: syedaizazalishah@gmail.com; shaukat@pieas.edu.pk
First published on 4th March 2024
Abstract
High-purity reduced graphene oxide (RGO or rGO) with appreciable conductivity is a desired conductive filler for lightweight polymer composites used in coatings, electronics, catalysts, electromagnetic interference (EMI) shielding, and energy storage devices. However, the intrinsic conductivity and the uniform dispersion of RGO in relatively polar matrices are challenging, leading to poor overall conductivity and performance of the composite material. The reported study improved the RGO intrinsic conductivity by increasing its C/O ratio while also simultaneously enhancing its compatibility with the polyimide (PI) matrix through ester linkages for better dispersion. A two-step reduction method drastically increased the number of structural defects and carbon content in the resulting RGO, corresponding to a maximum ID/IG and C/O of 1.54 and ∼87, respectively. Moreover, the 2D nanosheets with limited hydroxyl (–OH) groups effectively interacted with anhydride-terminated polyamic acid (AT-PAA) through chemical linkages to make high-performance RGO/PI nanocomposites. Consequently, the polymer matrix composites possessed the highest direct current conductivity of 15.27 ± 0.61 S cm−1 for 20 wt% of the prepared RGO. Additionally, the composite material was highly stiff (3.945 GPa) yet flexible (easily bent through 180°), lightweight (∼0.34 g cm−3), and capable of forming thin films (162 ± 15 μm). Unlike most polymer matrix composites, it showcased one of its class's highest thermal stabilities (a weight loss of only 5% at 638 °C). Ultimately, the composite performed as an effective electromagnetic interference (EMI) shielding material in the X-Band (8 to 12 GHz), demonstrating outstanding shielding effectiveness (SE), shielding effectiveness per unit thickness (SEt), specific shielding effectiveness (SSE), and absolute shielding effectiveness (SSEt) of 46 dB, 2778 dB cm−2, 138 dB cm3 g−1, and 8358 dB cm2 g−1, respectively. As a consequence of this research, the high-purity RGO and its high-performance PI matrix nanocomposites are anticipated to find practical applications in conductive coatings and flexible substrates demanding high-temperature stability.
1. Introduction
Due to their high-temperature stability, superior mechanical properties, strong chemical and radiation resistance, ease of processibility, light weight, and versatility, polyimides (PIs) are greatly desirable for applications in cutting-edge aviation, medical, electronic, and aerospace technologies.1,2 However, the poor electrical conductivity of these high-performance engineering polymers substantially limits their use in various exigent roles. For instance, electromagnetic interference (EMI), a growing concern for the effective operation of electronic/communication devices employed by the earlier-mentioned technologies, can not be prevented by polyimides due to their insulating character. Since the polymer is widely used in adhesives, coatings, and enclosures of various components in these devices,3,4 it is highly demanded to incorporate EMI shielding capability in these materials.Electrical conductivity is one of the critical parameters for improving the EMI shielding performance of polymeric materials.5 Incorporating conducting fillers in insulating polymers such as polyimides leads to the formation of highly conducting percolated networks within the host matrices. Consequently, the electrical conductivity and EMI shielding effectiveness of the insulating polymers can be effectively enhanced.6 For instance, reduced graphene oxide (RGO), due to its high intrinsic conductivity, two-dimensional (2D) morphology, and high specific surface area, has attained considerable attention as a conductive filler in developing conductive polymer composites (CPCs) for EMI shielding applications.7–9 Li et al.10 incorporated 16 wt% of thermally reduced RGO (with C/O ratio of 5.6) in PI matrix to obtain a lightweight (0.28 g cm−3) conductive polymer composite with an EMI shielding effectiveness of 17–21 dB/0.8 mm thickness in X-band (8–12 GHz) demonstrating a promising performance. However, for commercial applications, shielding effectiveness of >20 dB is a usual requirement,5 and therefore, further study is required to improve the performance of these high-potential CPCs.
The quality of RGO can be a critical parameter in enhancing the conductivity and EMI shielding capability of RGO/PI composites. In this regard, the presence of residual oxygen in RGO can lead to poor electrical conductivity.11 Therefore, a substantial decrease in the oxygen functional groups and restoration of sp2 hybridization can improve the quality of RGO and the subsequent EMI shielding performance of its PI-based composites. For this purpose, the reduction step in the commercial synthesis of conductive filler grade RGO is critical and needs special attention. The single-step reduction utilizing the commonly used reducing agents such as hydrogen sulfide, hydrazine, sodium borohydride, hydrohalic acids, metal iodides, ascorbic acid, and amino acids usually insufficiently reduces GO into RGO with a carbon-to-oxygen ratio of 2.7 to 10.3.12–14 Consequently, the product possesses only limited conductivity. On the other hand, Wei et al.15 found that multistep reduction of GO was more effective compared to the single-step process. For instance, De Silva et al.16 employed a mixture of hydroiodic acid and trifluoroacetic acid followed by thermal reduction with ethanol to obtain high-quality RGO of as low as 0.46 kΩ sq−1 sheet resistance. Nevertheless, the second step reduction was carried out at an elevated temperature of 800 °C for 30 minutes, limiting the practicality and scalability of the method. Therefore, there is a pressing demand for a practical method to produce high-quality, reduced graphene oxide in scalable quantities for high-performance CPCs.
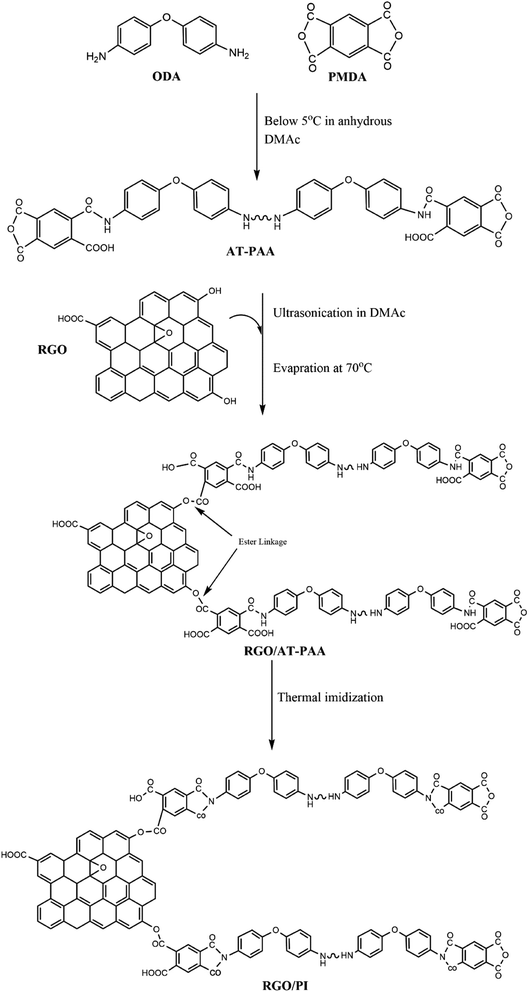
Therefore, in the present study, high-quality RGO of a large C/O ratio is prepared using a facile and scalable approach. The method employed a two-step reduction, which, unlike the previous studies, involved a mixture of sodium borohydride and hydrazine followed by thermal reduction at a moderate temperature of 120 °C for 10 minutes only. Furthermore, for better dispersion of the filler in the PI matrix, excess anhydride was used to obtain anhydride-terminated polyamic acid (AT-PAA) in an attempt to develop strong interfacial bonding between the hydroxyl (OH) groups on the RGO and ester (COOR) terminals of the polymer through esterification reaction. Consequently, a high-performance CPC is developed, exhibiting outstanding EMI shielding capabilities suitable for high-temperature and lightweight applications in aviation and other advanced technologies.
2. Experimental
2.1. Materials
The chemicals in the synthesis of graphene analogs were graphite, sodium peroxidisulphate (Na2S2O8, ≥98%), potassium permanganate (KMnO4, ≥99.0%), sulphuric acid (H2SO4, 98%), hydrogen peroxide (H2O2, 36%), hydrazine (N2H4, 65%), and sodium borohydride (NaBH4, ≥98.0%). Similarly, for polyimide synthesis, 4,4′-oxydianiline (ODA, 97%), pyromellitic dianhydride (PMDA, 97%), and anhydrous dimethyl acetamide (DMAc, 99.8%) were used. All chemicals were purchased from Sigma Aldrich and used without further purification.2.2. Expansion of graphite
For the synthesis of GO, pristine graphite (PG) was expanded by mixing it with sulphuric acid (98%) and sodium peroxidisulphate (Na2S2O8). In a typical experiment, 0.34 mol (∼4.0 g) of PG was mixed with 30 mL of concentrated H2SO4 and 0.1 mol (∼24.3 g) of Na2S2O8. The mixture was stirred for 2 hours in a water bath maintained at 50 °C. The resulting mixture was kept at a standstill for an hour, exhibiting expansion about three times its original volume. The as-obtained product in each experiment was filtered, washed with deionized water 3–4 times, dried at 100 °C, and labeled as EG.2.3. Synthesis of graphene oxide (GO)
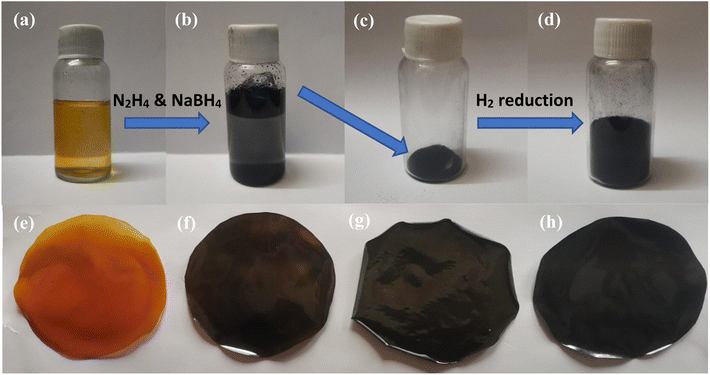
Graphene oxide was synthesized by wet chemical oxidation of the expanded graphite as per our previously reported modified Hummers' method.17 For instance, 4.0 g of EG was mixed with 20 mL of 98% sulphuric acid and stirred for about 20 minutes. Maintaining the mixture's temperature below 10 °C with an ice bath, 20.0 g of KMnO4 was slowly added with continuous stirring, followed by 10.0 g of Na2S2O8 and 60 mL of H2O2. The reaction mixture was then stirred for 2 hours, and a dark brown product was centrifuged and dried at 70 °C for further experiments. The obtained product was labeled as GO and dissolved in water through ultrasonication (Fig. 1a).2.4. Reduction of the graphene oxide (GO)
The GO synthesized in Section 2.3 was reduced in two steps to obtain the RGO. The first step involved sodium borohydride and hydrazine reduction, while the second step employed hydrogen gas reduction. In a typical reduction experiment, 5.0 g of the GO was dispersed in 30 mL of 5% w/v NaOH solution through ultrasonication for about 30 minutes. 10.0 g of NaBH4 was then added to the solution and stirred for 2 hours, followed by 20 mL of N2H4 for 30 minutes. The color of the solution appeared to change from dark brown to black, along with the appearance of a flaky solid (Fig. 1b). Finally, the suspension was centrifuged, washed with ethanol and water, dried, and labelled as RGO-1 (Fig. 1c).Further reduction of the RGO-1 was carried out in a hydrogen furnace. A known amount of the dried RGO-1 was taken into the vessel of the hydrogen furnace, which was subsequently vacuumed to about 8.9 × 10⁻⁴ bar, and then filled with 1.0 bar hydrogen gas. The temperature of the furnace was then maintained at about 120 °C for ten minutes. An expansion of about 10 times (Fig. 1d) was observed for the initial volume of the RGO-1 following the completion of the process. The expanded product was finally collected and labeled as RGO-2.
2.5. Synthesis of the anhydride-terminated polyamic acid (AT-PAA)
Anhydride-terminated polyamic acid (AT-PAA) with anhydride end groups was synthesized using a previously reported protocol with slight modification.18 Under an inert environment, 3.0 mmol (∼0.6193 g) of ODA was mixed with a suitable amount of DMAc and stirred for about 10 minutes to ensure its complete dissolution. About 3.1 mmol (∼0.6971 g) of precisely weighed PMDA was then added slowly to the ODA solution along with continuous mechanical stirring. The reaction was carried out for 24 hours at about ≤5 °C with constant stirring, resulting in the AT-PAA solution of about 12 wt% solid content.2.6. Preparation of the reduced graphene oxide-polyimide (RGO/PI) composite
A simple solution casting method was used to fabricate RGO-2/PI composite films. A known amount of RGO-2 (as per Table 1) was dispersed in 20 mL of DMAc for about 30 minutes to obtain a uniform dispersion. Subsequently, a known amount of AT-PAA (as per Table 1) was added to each sample and stirred well for about 20 minutes to ensure homogenous mixing of the components. Each solution was then poured into 4-inch-wide Teflon dishes and heated at 70 °C overnight. Finally, the resulting solid films (RGO-2/PAA) were thermally treated at 100, 200, and 300 °C for one hour each to obtain RGO-2/PI composites (Fig. 1e–h).| Sr. no. | Sample ID | PI matrix (wt%) | RGO-2 filler (wt%) | Sample thickness (μm) | Sample density (g cm−3) |
|---|---|---|---|---|---|
| 1 | RGO(0)/PI | 100 | 0 | 160 ± 12 | ∼0.33 |
| 2 | RGO(4)/PI | 96 | 4 | 165 ± 10 | ∼0.33 |
| 3 | RGO(8)/PI | 92 | 8 | 161 ± 08 | ∼0.33 |
| 4 | RGO(12)/PI | 88 | 12 | 168 ± 10 | ∼0.33 |
| 5 | RGO(16)/PI | 84 | 16 | 170 ± 10 | ∼0.34 |
| 6 | RGO(20)/PI | 80 | 20 | 162 ± 15 | ∼0.34 |
The synthetic protocol can be visualized, as illustrated in Fig. 2.
3. Characterization
Scanning electron microscopy (SEM, Mira3 TESCAN FE-SEM) was employed to characterize the samples' morphology. To analyze functional groups present in the materials, Fourier transform infrared (FTIR) spectrometer (Shimadzu IRAffinity-1S) was used in attenuated total reflectance (ATR) mode (frequency range = 4000–500 cm−1). Raman spectra of the samples were recorded in the 500–2500 cm−1 range using a μ-Ramboss Spectrometer (Dongwoo Optron, Co., Ltd). For surface analysis, X-ray photoelectron spectroscopy (XPS) was performed using NanoESCA (Scienta-Omicron). X-ray diffractometry (XRD) was carried out using X'Pert-Pro-MPD (PANalytical Inc.) employing Kα emissions (wavelength = 1.54056 Å) of Cu source. Thermogravimetric analysis of the samples was performed using TG/DSC1 (Mettler-Toledo). 10–15 mg of the samples were thermally heated at the rate of 10 K min−1 under a nitrogen flow of 40 ml min−1. EMA 502 Elemental Analyzer CHNS–O (VELP Scinetifica Inc.) was used to analyze the elemental composition of the synthesized samples. Each material was analyzed in five replicates, and the average values were reported. UV-visible spectral analysis was done by dispersing the samples in water or DMAc for about 30 minutes and then recording the absorption spectra using a double-beam Thermo Scientific Evolution 350 UV-Vis spectrophotometer. Direct current (DC) conductivity of the prepared polymeric films was determined using a four-probe conductivity meter (Ossila). The thickness of the films was measured using Mitutoyo 400S Flat Anvil ABSOLUTE Thickness Gauge. EMI shielding effectiveness (EMI-SE) at room temperature was measured using a Rhodes & Schwarz ZNA-50 Vector Network Analyzer and a WR-90 rectangular waveguide in the radio frequency range of 8.2 GHz to 12.4 GHz (X-Band). The scattering parameters S11 and S21 obtained from the experiments were used to calculate the shielding effectiveness values by the following equations:5
SET = −10![[thin space (1/6-em)]](https://www.rsc.org/images/entities/char_2009.gif) log log![[thin space (1/6-em)]](https://www.rsc.org/images/entities/char_2009.gif) T = −10 T = −10![[thin space (1/6-em)]](https://www.rsc.org/images/entities/char_2009.gif) log(|S21|2) log(|S21|2)
| (1) |
SER = −10![[thin space (1/6-em)]](https://www.rsc.org/images/entities/char_2009.gif) log(1 − R) = −10 log(1 − R) = −10![[thin space (1/6-em)]](https://www.rsc.org/images/entities/char_2009.gif) log(1 − |S11|2) log(1 − |S11|2)
| (2) |
 | (3) |
| SEM = SET − SER − SEA | (4) |
 | (5) |
 | (6) |
 | (7) |
4. Results and discussion
4.1. Characterization of the RGO
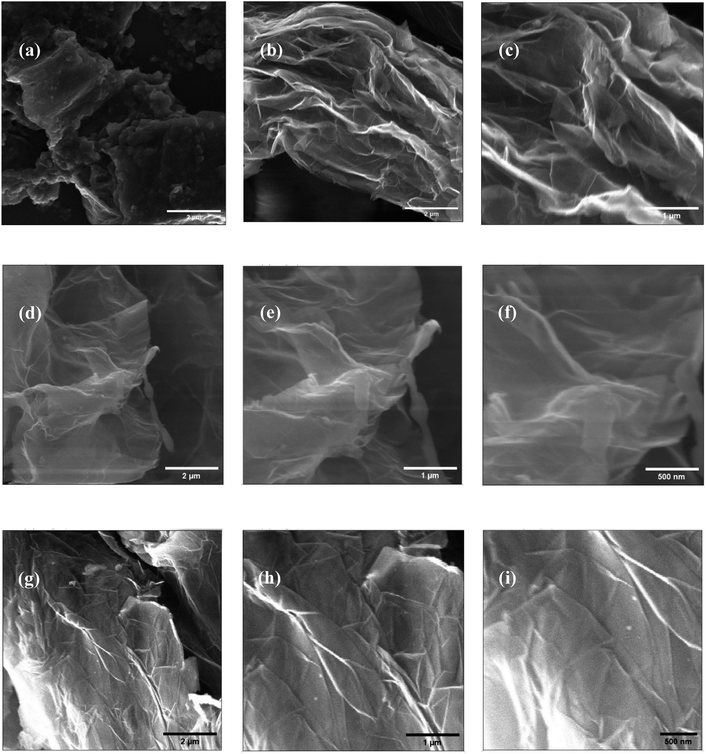
The morphology of the precursor and synthesized materials is illustrated in Fig. 3. The pristine graphite appeared dense flaky solid representing a stacked morphology (Fig. 3a). After oxidation via the modified Hummers' method, the obtained GO (Fig. 3b–f) appeared as a loose assembly of wrinkled nanosheets with 2D lamellar morphology, confirming the graphite's successful oxidation and exfoliation. The sheet thickness in the GO sample was about 100 nm, much greater than that of single-layered graphene, attributed to the presence of oxygen moieties over the layers.19 Moreover, the folds or wrinkles at the edges of the sheets originated from interactions between the oxygen-containing groups on the GO.20,21 On the other hand, RGO-2 (Fig. 3g–i) consisted of a more flat, thin, and closely packed 2D sheets, indicating poor interactions due to lesser number of oxygen groups present between the layers.21,22 Therefore, the reduction process has effectively converted GO into RGO with minimal oxygen functionalities. Furthermore, the thickness of RGO-2 nanosheets was about 5–10 nm, which, compared to the 1.2 nm thick single-layered RGO,23 suggested the preparation of a few layered RGO in the present study.FTIR studies were carried out to investigate the chemical changes brought about by the chemical reactions occured during the synthesis of RGO. As depicted in Fig. 4a, the FTIR spectrum of pristine graphite exhibited typical peaks at about 3435, 2928, 2838, and 1616 cm−1, corresponding to O–H, C–H (sp2), C–H (sp3), and C![[double bond, length as m-dash]](https://www.rsc.org/images/entities/char_e001.gif) C vibrations, respectively.24 Additionally, bending vibrations of O–H and C–O–C bonds were observed at 1401 and 1016 cm−1, respectively.25 The spectrum revealed that the graphite structure consisted of C
C vibrations, respectively.24 Additionally, bending vibrations of O–H and C–O–C bonds were observed at 1401 and 1016 cm−1, respectively.25 The spectrum revealed that the graphite structure consisted of C![[double bond, length as m-dash]](https://www.rsc.org/images/entities/char_e001.gif) C bonds and contained –H, –OH, and –O– functional groups.
C bonds and contained –H, –OH, and –O– functional groups.
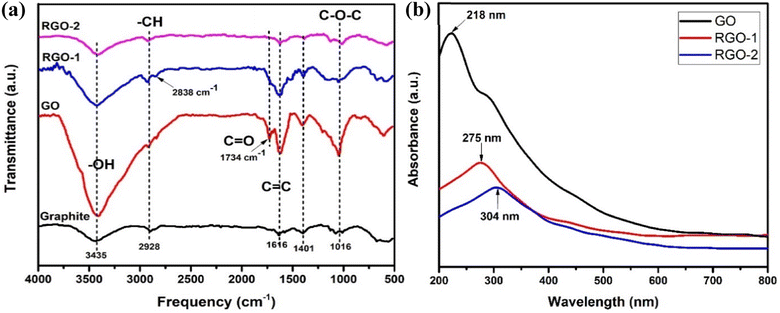 | ||
| Fig. 4 (a) FTIR spectra of graphite, GO, RGO-1, and RGO-2. (b) UV-visible spectra of GO, RGO-1, and RGO-2. | ||
Following the oxidation of graphite into GO, all vibrations associated with oxygen moieties (–OH and –O–) significantly intensified (Fig. 4a), confirming the successful synthesis of GO. Moreover, a broad absorption band in the 3550–2450 cm−1 range could also be observed, indicating the presence of carboxylic acid (–COOH) groups in the GO samples. Moreover, the vibrational bands due to sp2 and sp3 hybridized C–H bonds were also visible in the GO spectrum. Additionally, an IR absorption peak at 1734 cm−1 corresponding to carbonyl (C![[double bond, length as m-dash]](https://www.rsc.org/images/entities/char_e001.gif) O) stretching vibrations appeared for the GO, confirming the existence of carboxyl groups. The GO structure was, therefore, characterized to consist of C
O) stretching vibrations appeared for the GO, confirming the existence of carboxyl groups. The GO structure was, therefore, characterized to consist of C![[double bond, length as m-dash]](https://www.rsc.org/images/entities/char_e001.gif) C with abundant –H, –OH, –O–, and –COOH functionalities.
C with abundant –H, –OH, –O–, and –COOH functionalities.
Upon reduction, the resulting RGO-1 retained all the functional groups of the GO; however, their number was reduced, as suggested by the decreased intensities of the oxygen-containing moieties (Fig. 4a). Therefore, RGO-1 could be characterized as partially reduced GO with plenty of oxygen functional groups. However, the followed-up H2 reduction of RGO-1 to RGO-2 drastically modified the IR spectrum similar to that of the pristine graphite, suggesting the complete reduction of GO. The peaks associated with the oxygen functional groups significantly diminished, with intensities reaching below that of the pristine graphite. Consequently, RGO-2 could be structurally similar to the pristine graphite with a C![[double bond, length as m-dash]](https://www.rsc.org/images/entities/char_e001.gif) C network and a comparable amount of –H, –OH, and –O– functional groups.
C network and a comparable amount of –H, –OH, and –O– functional groups.
Quantitative analysis of the C, H, and O elements was carried out to quantify and compare the chemical composition of the synthesized and precursor materials, and the average results (in mass percent) are provided in Table 2. The analysis indicated that the pristine graphite contained primarily carbon (95.0 ± 1.20 wt%) with only a deficient amount (3.31 ± 0.10 wt%) of oxygen. Upon oxidation, the carbon content decreased to a significantly smaller value of 52.60 ± 0.10 wt% in the GO. However, the subsequent two-step reduction process effectively restored the carbon content in RGO-2 with a value (98.4 ± 1.50 wt%) exceeding that of the pure graphite (95.0 ± 1.20 wt%), supporting the FTIR deductions.
| Element | Graphite | GO | RGO-1 | RGO-2 |
|---|---|---|---|---|
| Carbon (wt%) | 95.0 ± 1.20 | 52.6 ± 0.10 | 91.9 ± 1.95 | 98.4 ± 1.50 |
| Oxygen (wt%) | 3.31 ± 0.10 | 39.9 ± 1.20 | 7.01 ± 0.20 | 1.51 ± 0.06 |
| Hydrogen (wt%) | 1.73 ± 0.06 | 7.40 ± 0.22 | 1.20 ± 0.05 | 0.100 ± 0.004 |
| Total (wt%) | 100.04 ± 1.36 | 99.9 ± 1.52 | 100.11 ± 2.20 | 100.01 ± 1.564 |
Among all the samples, RGO-2 was characterized by the highest carbon-to-oxygen atomic ratio (C/O) of 86.89, which confirmed its high chemical purity exceeding the reported values for similar methods26.
UV-visible spectrophotometric characterization was conducted to confirm the existence of extended conjugation in graphene and its analogs. The absorption spectra of GO, RGO-1, and RGO-2 are shown in Fig. 4b, where the GO exhibited an optimum maximum wavelength (λmax) of 218 nm, indicating π–π* transition due to C![[double bond, length as m-dash]](https://www.rsc.org/images/entities/char_e001.gif) C in the material. This was slightly lower than the previously reported value27 of λmax, suggesting a more effective oxidation of the graphite sample. Moreover, a shoulder peak in 350–450 nm range indicated n–π* transitions attributed to the presence of carbonyl groups on the GO nanosheets.28 Successful conversion of the GO into RGO was also confirmed by comparing the UV-visible spectra, where a redshift from 218 nm of the GO characteristic peak to 275 nm and 304 nm for the RGO-1 and RGO-2, respectively, confirmed the restoration of π conjugated system in the RGO samples. Moreover, the disappearance of the shoulder peak in the 350–450 nm region confirmed the reduction process. Compared to the reported literature,29–34 the λmax was higher for the RGO-2 prepared in the current study, indicating a greater extent of π conjugated system that could be highly suitable for higher electrical conductivity.
C in the material. This was slightly lower than the previously reported value27 of λmax, suggesting a more effective oxidation of the graphite sample. Moreover, a shoulder peak in 350–450 nm range indicated n–π* transitions attributed to the presence of carbonyl groups on the GO nanosheets.28 Successful conversion of the GO into RGO was also confirmed by comparing the UV-visible spectra, where a redshift from 218 nm of the GO characteristic peak to 275 nm and 304 nm for the RGO-1 and RGO-2, respectively, confirmed the restoration of π conjugated system in the RGO samples. Moreover, the disappearance of the shoulder peak in the 350–450 nm region confirmed the reduction process. Compared to the reported literature,29–34 the λmax was higher for the RGO-2 prepared in the current study, indicating a greater extent of π conjugated system that could be highly suitable for higher electrical conductivity.
XRD was carried out to determine the crystal structures and interlayer spacings of the pristine graphite, GO, RGO-1, and RGO-2; the diffractograms are shown in Fig. 5a. Pristine graphite depicted a highly crystalline structure with a strong basal diffraction peak at 2θ = 26.6°, indicating an inter-layer d-spacing of about 0.85 nm between the (002) planes of the crystal.35 On the other hand, the synthesized GO lacked the ordered (002) planes of graphite and showed a broad diffraction peak at 2θ = 11.4° indicative of the (001) plane, suggesting successful exfoliation of the graphite source. Upon reduction by N2H4 and NaBH4, the (001) diffraction peak disappeared along with the restoration of (002) planes at 2θ = 24.4° and 23.9° in RGO-1 and RGO-2, confirming the restacking of the exfoliated layer as evidenced by the SEM. However, compared to the pristine graphite, the diffraction peak corresponding to the (002) plane shifted to lower 2θ values for RGO-1 and RGO-2, suggesting a relatively larger interlayer spacing indicative of a loosely packed lattice. The peak intensities also significantly decreased, which suggested a few layers of graphene packed together in an ordered manner. Among the prepared samples, the RGO-2 exhibited the largest interlayer spacing, suggesting that the hydrogen gas reduction step resulted in expansion and exfoliation of the RGO-1 layers.
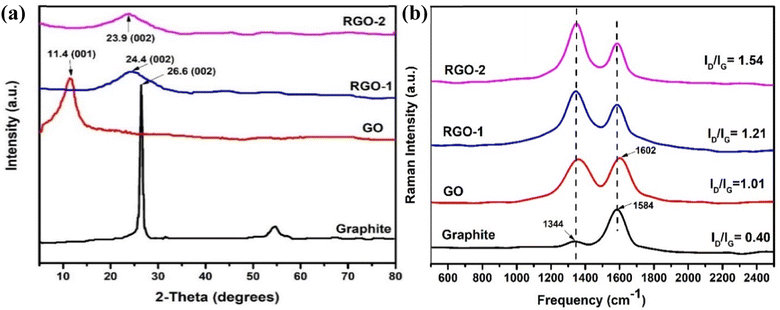 | ||
| Fig. 5 (a) X-ray diffractograms and (b) Raman spectra of the pristine graphite, GO, RGO-1, and RGO-2 samples. | ||
The changes in the graphitic structure were monitored by Raman spectroscopy. It is evident from the literature that graphite has a highly ordered carbon structure, resulting in crystallinity and in-phase vibration of its lattice at about 1584 cm−1 (G band) due to the E2g mode of first-order Raman scattering. Moreover, another Raman band at about 1344 cm−1 (D band) suggests defects and disorders in its structure's bond angles, lengths, and edges.36,37 Fig. 5b illustrates the Raman spectra of the pristine graphite, GO, RGO-1, and RGO-2. It is evident from the figure that the intensity of the D band in pristine graphite is the lowest, indicating fewer defects in the structure of pristine graphite. Upon oxidation into GO, the intensities of G and D bands significantly changed, indicating pronounced disorder in the graphite structure. Moreover, the G band shifted to a slightly higher (+18 cm−1) frequency in the case of GO due to the higher oxygen content and the subsequent defects at the grain boundaries.38 In the case of RGO-1 and RGO-2, the D band's intensity was enhanced compared to the G band, indicating more disordered structures.
The D to G band intensity ratio, ID/IG, is a numerical measure of disorder in graphitic structure. This ratio increased from 0.40 to 1.01, 1.21, and 1.54 for graphite, GO, RGO-1, and RGO-2, respectively (Fig. 5b), indicating that the oxidation and reduction processes induced a significant disorder in the structure. The higher ratio of ID to IG indicates that the sp2 carbon domains had been reduced in size due to defects induced during the reduction process. In summary, the increase in the ID/IG ratio and the variation in the Raman shift indicated disruption of the ordered graphitic structure during the formation of GO and the subsequent RGO-1 and RGO-2. Moreover, the ID/IG ratio of 1.54 for RGO-2 indicated a substantial degree of disorder in its graphitic structure, which is the highest reported so far to the best of our knowledge. It is clear from the study that the hydrogen gas treatment caused the reduction of RGO-1 and disrupted the graphene structure to a further extent, resulting in the increased ID/IG ratio.
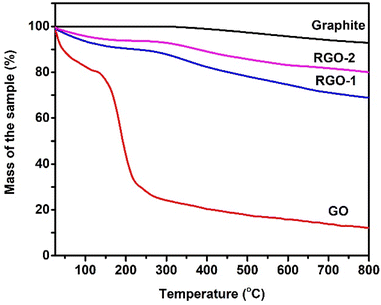
TGA thermograms of the pristine graphite, GO, RGO-1, and RGO-2 are depicted in Fig. 6. Pure graphite exhibited only about 5% weight loss up to about 800 °C, indicating high thermal stability. This thermal stability of graphite is due to its compact layered structure and low oxygen content.39 In the case of graphene oxide, an evident two-step weight loss of ∼21% and ∼57% could be observed up to 100 °C and 300 °, respectively. This weight loss in the first step can be attributed to trapped moisture in the sample, while the second stage weight loss happened due to thermal degradation of the oxygen-rich graphene oxide layers.40
 | ||
| Fig. 6 TGA thermograms of the pristine graphite, GO, RGO-1, and RGO-2 taken under an inert atmosphere. | ||
RGO-1 and RGO-2 followed similar degradation profiles with relatively higher thermal stabilities and lower weight loss. A progressive decrease in the moisture content suggested by the first degradation step could be noted for RGO-1 (∼5%) and RGO-2 (∼3), indicating increased hydrophobicity due to the elimination of polar oxygen groups, as evidenced by the FTIR spectra. The thermal degradation of RGO-1 and RGO-2 also significantly decreased to ∼20% and ∼16%, respectively, compared to ∼57% for GO, which confirmed the lowering of oxygen content in accordance with the CHNS–O analysis. Furthermore, the increased onset temperature in the case of RGO confirmed the restoration of thermally stable aromatic sp2 hybridized structure, supporting the UV-visible spectrophotometric results. Although containing lower oxygen content than the pristine graphite, the RGO-2 resulted in more significant moisture loss and thermal degradation. This observation could be related to a probable higher specific surface area and loose packing of the RGO-2 sheets, as the SEM and XRD suggested, thereby facilitatingexcellent moisture absorption and easy oxygen penetration during degradation.
4.2. Characterization and performance evaluation of the RGO/PI nanocomposites
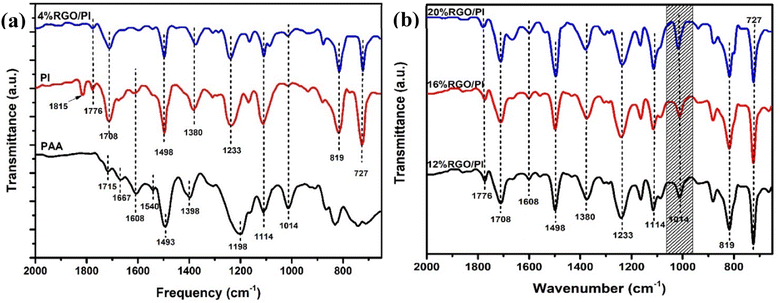
The FTIR spectra in Fig. 7a and b confirmed the successful synthesis of AT-PAA, PI, and the RGO/PI nanocomposites. In the case of AT-PAA, the peaks at 1715, 1667, and 1540 cm−1 corresponded to the carbonyl (C![[double bond, length as m-dash]](https://www.rsc.org/images/entities/char_e001.gif) O) group of the carboxylic acids, the amide I (CONH) and amide II (CNH), respectively.18 Two new peaks at 1776 cm−1 and 727 cm−1 corresponding respectively to asymmetric stretching and bending modes of the imide group confirmed the successful conversion of PAA into PI in the composite materials.18 Additionally, the peak at 1398 cm−1 in PAA shifted to 1380 cm−1, which is attributed to the C–N stretching in the imide group.
O) group of the carboxylic acids, the amide I (CONH) and amide II (CNH), respectively.18 Two new peaks at 1776 cm−1 and 727 cm−1 corresponding respectively to asymmetric stretching and bending modes of the imide group confirmed the successful conversion of PAA into PI in the composite materials.18 Additionally, the peak at 1398 cm−1 in PAA shifted to 1380 cm−1, which is attributed to the C–N stretching in the imide group.
 | ||
| Fig. 7 (a) FTIR spectra of the PAA, PI, and 4% RGO-2/PI nanocomposite. (b) FTIR spectra of the 12, 16, and 20% RGO-2/PI nanocomposites. | ||
A comparison of the FTIR spectra of the RGO/PI composites revealed a slight peak blue shift in the vibrational bands with increased loading of RGO in the PI matrix. For instance, the peak at 1608 cm−1 in pristine PI drastically reduced and shifted to a lower wavenumber of 1576 cm−1 at 20% loading. More notably, the peak at 1014 cm−1, corresponding to C–O–C, increased with the percent loading of RGO from 4% to 20%. These spectral changes, thus, suggested chemical interactions between the PI matrix and the RGO filler. Particularly, the increase in the intensity of the absorption band at 1576 cm−1 indicated the formation of ester bonds between the –COOH of AT-PAA and the residual –OH groups in RGO-2. Since –OH groups are present at the edges of RGO, the polyimide chains could be connected to the RGO sheets without disturbing its basal structure. Furthermore, these covalent linkages could enhance the dispersion of the conducting filler in the polymer matrix to impart a higher electrical conductivity to the composite.
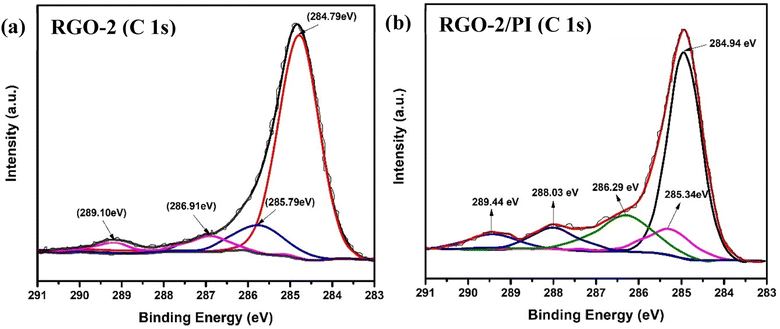
The surface chemical composition of the RGO and RGO/PI composite was analyzed by X-ray photoelectron spectroscopy for further insight. Fig. 8 shows the deconvoluted XPS of the C 1s peak. Four sub-peaks at binding energies of 284.79, 285.79, 286.91, and 289.10 eV, corresponding to C![[double bond, length as m-dash]](https://www.rsc.org/images/entities/char_e001.gif) C (sp2 hybridized carbon), C–C (sp2 hybridized carbon), C–O/C–O–C (hydroxyl or epoxy groups), and –O–C
C (sp2 hybridized carbon), C–C (sp2 hybridized carbon), C–O/C–O–C (hydroxyl or epoxy groups), and –O–C![[double bond, length as m-dash]](https://www.rsc.org/images/entities/char_e001.gif) O (ester or carboxy groups), respectively, can be fitted in the resolved XPS of RGO-2 (Fig. 8a).41–45 It could be noted that the peak at 284.79 eV had the highest intensity, suggesting the predominant existence of C
O (ester or carboxy groups), respectively, can be fitted in the resolved XPS of RGO-2 (Fig. 8a).41–45 It could be noted that the peak at 284.79 eV had the highest intensity, suggesting the predominant existence of C![[double bond, length as m-dash]](https://www.rsc.org/images/entities/char_e001.gif) C bonds on the surface of the RGO.
C bonds on the surface of the RGO.
In the case of the composite RGO-2 (20%)/PI, the deconvoluted C1s XPS spectrum (Fig. 8b) depicted an additional peak at 288.03 eV in addition to a slight change in the positions of the peaks at 284.94, 285.34, 286.29, and 289.44 eV corresponding to C![[double bond, length as m-dash]](https://www.rsc.org/images/entities/char_e001.gif) C (+0.15 eV), C–C (+0.45 eV), C–O/C–O–C (+0.62 eV), and O–C
C (+0.15 eV), C–C (+0.45 eV), C–O/C–O–C (+0.62 eV), and O–C![[double bond, length as m-dash]](https://www.rsc.org/images/entities/char_e001.gif) O (+0.34 eV). These changes could be attributed to an interaction between the filler and matrix, resulting in the formation of ester linkage between –OH groups of the RGO-2 sheets and the carboxylic acids of AT-PAA.46 These observations supported the FTIR results.
O (+0.34 eV). These changes could be attributed to an interaction between the filler and matrix, resulting in the formation of ester linkage between –OH groups of the RGO-2 sheets and the carboxylic acids of AT-PAA.46 These observations supported the FTIR results.
Scanning electron microscopy (SEM) of the composite revealed a solid and compact morphology (Fig. 9a) consisting of well-dispersed RGO inside the polymer matrix. The protruding sheets with lateral dimensions of about 5–8 μm (Fig. 9b) indicated a higher aspect ratio of the dispersed RGO. Furthermore, the RGO sheets could be seen as well dispersed, forming a conductive network that can facilitate efficient charge transfer within the insulating polymer matrix. Supported by the FTIR and XPS results, it can, therefore, be suggested that the interfacial bonding between the matrix and the filler enhanced the compatibility between the two components and prevented agglomeration of the latter.
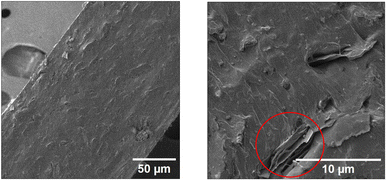 | ||
| Fig. 9 Cross-sectional view of the RGO-2 (20%)/PI under different resolutions. The selected region (red circle) shows protuding 2D sheets of the RGO-2 in the PI matrix. | ||
To further confirm the interfacial bonding and the reinforcement effect of RGO on PI, dynamic mechanical analysis (DMA) was performed as show in Fig. 10a. The pristine polymer showed an appreciably high storage modulus (E′) of 3.610 GPa at 50 °C which decreased with temperature. The incorporation of RGO gradually enhanced the stiffness of the polymer to a maximum value of 3.945 GPa for 20 wt% RGO-2 at 50 °C (Fig. 10b). This significant increase in the storage modulus of the PI indicated uniform distribution and strong interfacial bonding of the RGO that inhibited the movement of the polymer chains under stress.47
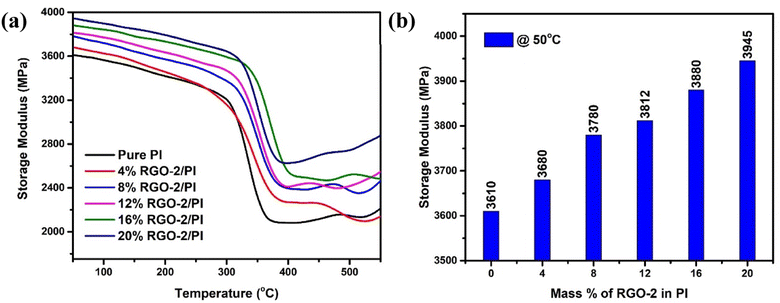 | ||
| Fig. 10 DMA results of the RGO-2/PI composites. (a) Storage modulus as a function of temperature, and (b) storage modulus as a function of RGO-2 content at 50 °C. | ||
Fig. 11a illustrates the thermal degradation behavior of the RGO-2/PI composites. All the composites showed a single-step degradation with varying thermal stabilities. A comparison drawn at 5% weight loss (Fig. 11b) showed increased thermal stability with increased loading of RGO-2. The T5% was noted to increase from 504 °C of the pristine PI to 638 °C of the 20 wt% loaded RGO-2/PI nanocomposite, demonstrating higher thermal stability than the previously reported48 RGO/PI composites. The superior thermal stability of these composites is attributed to enhanced heat dissipation due to the presence of well distributed conductive RGO-2 and strong interfacial bonding.49 Another critical factor responsible for the very high thermal stability may be radical scavenging by the RGO-2, retarding the degradation process.50
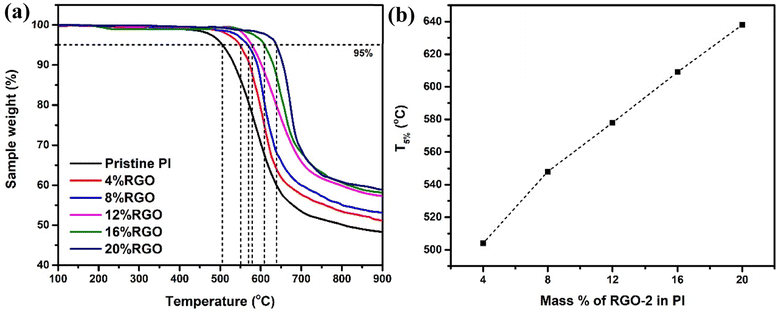 | ||
| Fig. 11 (a) TGA curves for the Pristine PI and RGO-2/PI composites and (b) T5% as a function of the composition. | ||
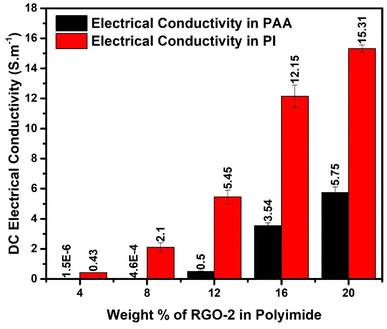
Electrical conductivity is an important performance parameter of conducting polymer composites. The effect of thermal imidization and the RGO loading on the DC conductivity of the composites was explored in detail. For this purpose, RGO-2/AT-PAA and RGO-2/PI containing 4, 8, 12, 16, and 20 wt% RGO-2 were tested using four probe conductivity measurements, and the results are compared in Fig. 12. The pure polyimide and PAA exhibit extremely low electrical conductivity in the range of 10−16 S cm−1 and 10−9 S cm−1, respectively, rendering them insulating.10 However, a substantial increase in their conductivity was noticed by incorporating the RGO-2 and increasing its mass percentage in the composite films. This transition from insulator to conductor can be attributed to the formation of a highly conductive network of RGO plates inside the polymer matrix (Fig. 9). Comparing the increase in conductivity of PAA and PI, the same amount of 4 wt% RGO increased the conductivity by about 103 and 1016 times, respectively. It is, therefore, suggested that the thermal imidization process also contributed to the enhancement of conductivity, probably due to further reduction and annealing of the RGO during the thermal treatment.10 Consequently, the RGO-2 20%/PI possessed the highest conductivity of 15.27 ± 0.61 S cm−1, much higher than the previously reported10 PI foam-based RGO-containing composites. This superior conductivity is attributed to the intrinsic quality of the prepared RGO-2, the ester linkages, and a uniform distribution in the polymer matrix.
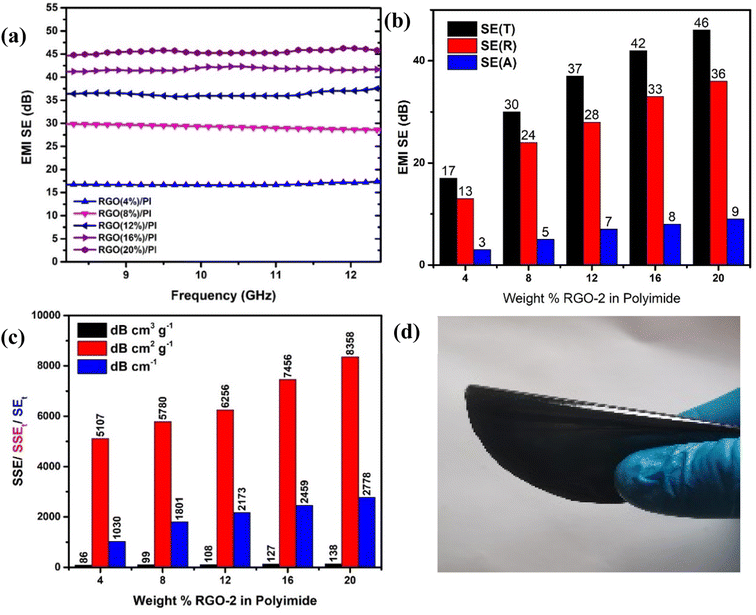
Higher electrical conductivity is one of the important requirements for EMI shielding materials.51,52 According to the literature53 the reflection component of the total shielding effectiveness is highly sensitive to the conductivity of the material among other properties. It was, therefore, anticipated that the prepared conductive composites could result in enhanced EMI shielding due to their superior conductivity. This was confirmed by carrying out EMI shielding studies on the samples containing 4, 8, 12, 16, and 20 wt% RGO-2 in the X-Band of EM radiations (Fig. 13a).
The results confirmed that the total shielding effectiveness increased from 17 dB to 30 dB, 37 dB, 42 dB and 46 dB for the samples containing 4, 8, 12, 16, and 20 wt% of RGO-2, respectively. Moreover, the increased RGO loading significantly enhanced the reflection component (Fig. 13b) of the shielding phenomenon, indicating that the conductivity of the composite films was the major reason for EMI shielding due to the impedance mismatch. The maximum EMI shielding of 46 dB at a very low density and thickness of only ∼0.34 g cm−3 and 162 ± 15 μm, respectively, was superior to most of the reported54–56 materials in the literature.
A comparison of Table 1 and Fig. 12 reveals that increasing RGO content in the PI matrix increased the conductivity, yet the density of the material remained intact. Consequently, the results in Fig. 13c indicated appreciably high SSE values up to 138 dB cm3 g−1, which is attractive for applications requiring lightweight shielding materials. Moreover, the composite materials had superior film-forming abilities with thicknesses as small as a few tens of micrometers (Table 1). Resultantly, the SEt and SSEt yielded significantly high values up to 2778 dB cm−2 and 8358 dB cm2 g−1 respectively, for the RGO-2 20%/PI composite making it highly suitable for EMI shielding protective coatings. These high SEt and SSEt values could be attributed to the high-performance RGO-2 as an effective conductive filler and its uniform dispersion, forming a highly conductive network inside the polymer matrix.
To demonstrate the practical utility of the composite film as an EMI shielding material, it was manually twisted by 180° (Fig. 13d) without any damage or fracture, indicating its high flexibility and suitability for flexible electronics.
5. Conclusion
High-quality reduced graphene oxide (RGO) with a high C/O ratio and a substantially large number of defects was chemically synthesized by reducing graphene oxide (GO) in a two-step process. Compared to the typical single-step reduction, the two-step reduction employing hydrogen gas almost entirely reduced GO, with the resulting product containing only a tiny fraction of oxygen-containing functional groups and loosely packed multilayered graphene nanosheets. The resulting RGO also possessed a chemical structure and π conjugation similar to that of pure graphite, suggesting high intrinsic conductivity. This high-purity RGO is anticipated to find applications in high-performance electronics and composite materials for applications in cutting-edge technologies. For instance, hydroxyl (–OH) functional groups at the edges of the RGO successfully reacted with anhydride-terminated polyamic acid to form high-performance, lightweight, mechanically flexible, electrically conductive, and thermally stable polyimide-based nanocomposites. The superior properties of the nanocomposites resulted from the better interfacial bonding between the polymer and the conducting filler. Consequently, the RGO formed a uniform conductive network in the PI matrix, imparting a higher electrical conductivity and effectively shielding electromagnetic interference in the X-band of electromagnetic radiation. This high-performance CPC is suitable for applications in high-temperature coatings and flexible substrates in electronics and engineering devices.Conflicts of interest
There are no conflicts of interest to declare.References
- A. Sezer Hicyilmaz and A. Celik Bedeloglu, Applications of Polyimide Coatings: A Review, SN Applied Sciences, 2021, 3, 1–22 CrossRef.
- S. A. A. Shah, R. Idrees and S. Saeed, A critical review on polyimide derived carbon materials for high-performance supercapacitor electrodes, J. Energy Storage, 2022, 55, 105667 CrossRef.
- I. Gouzman, E. Grossman, R. Verker, N. Atar, A. Bolker and N. Eliaz, Advances in polyimide-based materials for space applications, Adv. Mater., 2019, 31(18), 1807738 CrossRef.
- J. Ma, M. Zhan and K. Wang, Ultralightweight silver nanowires hybrid polyimide composite foams for high-performance electromagnetic interference shielding, ACS Appl. Mater. Interfaces, 2015, 7(1), 563–576 CrossRef CAS PubMed.
- Z. Yu, T. Dai, S. Yuan, H. Zou and P. Liu, Electromagnetic interference shielding performance of anisotropic polyimide/graphene composite aerogels, ACS Appl. Mater. Interfaces, 2020, 12(27), 30990–31001 CrossRef CAS PubMed.
- P. Saini and M. Arora, Microwave absorption and EMI shielding behavior of nanocomposites based on intrinsically conducting polymers, graphene and carbon nanotubes, New Polym. Spec. Appl., 2012, 3, 73–112 Search PubMed.
- M. S. Cao, X. X. Wang, W. Q. Cao and J. Yuan, Ultrathin graphene: electrical properties and highly efficient electromagnetic interference shielding, J. Mater. Chem. C, 2015, 3(26), 6589–6599 RSC.
- D. X. Yan, H. Pang, B. Li, R. Vajtai, L. Xu, P. G. Ren, J. H. Wang and Z. M. Li, Structured reduced graphene oxide/polymer composites for ultra-efficient electromagnetic interference shielding, Adv. Funct. Mater., 2015, 25(4), 559–566 CrossRef CAS.
- Y. Chen, J. Li, T. Li, L. Zhang and F. Meng, Recent advances in graphene-based films for electromagnetic interference shielding: Review and future prospects, Carbon, 2021, 180, 163–184 CrossRef CAS.
- Y. Li, X. Pei, B. Shen, W. Zhai, L. Zhang and W. Zheng, Polyimide/graphene composite foam sheets with ultrahigh thermostability for electromagnetic interference shielding, RSC Adv., 2015, 5(31), 24342–24351 RSC.
- S. Kang, J. Zhuang, S. Kang, Y. Peng and S. Guan, Synthesis of high-quality graphene with enhanced electrochemical properties by two-step reduction method, Ceram. Int., 2019, 45(18), 23954–23965 CrossRef CAS.
- I. Bychko, A. Abakumov, O. Didenko, M. Chen, J. Tang and P. Strizhak, Differences in the structure and functionalities of graphene oxide and reduced graphene oxide obtained from graphite with various degrees of graphitization, J. Phys. Chem. Solids, 2022, 164, 110614 CrossRef CAS.
- C. Liu, F. Hao, X. Zhao, Q. Zhao, S. Luo and H. Lin, Low temperature reduction of free-standing graphene oxide papers with metal iodides for ultrahigh bulk conductivity, Sci. Rep., 2014, 4(1), 3965 CrossRef PubMed.
- S. Pei, J. Zhao, J. Du, W. Ren and H.-M. Cheng, Direct reduction of graphene oxide films into highly conductive and flexible graphene films by hydrohalic acids, Carbon, 2010, 48(15), 4466–4474 CrossRef CAS.
- M. Wei, L. Qiao, H. Zhang, S. Karakalos, K. Ma, Z. Fu, M. T. Swihart and G. Wu, Engineering reduced graphene oxides with enhanced electrochemical properties through multiple-step reductions, Electrochim. Acta, 2017, 258, 735–743 CrossRef CAS.
- K. K. H. De Silva, K. Shibata, P. Viswanath, H. H. Huang and M. Yoshimura, High-Quality Monolayer Reduced Graphene Oxide Films via Combined Chemical Reduction and Ethanol-Assisted Defect Restoration, Adv. Mater. Interfaces, 2022, 9(18), 2200503 CrossRef CAS.
- Z. Mehmood, M. Aamir, M. Sher, M. Sohail, R. Qadeer, N. Revaprasadu, M. A. Malik and J. J. O. Akhtar, A facile approach to synthesis graphene oxide/bismuth oxide nanocomposites and their superior sunlight driven photocatalytic activity, Optik (Stuttg.), 2019, 197, 163035 CrossRef CAS.
- M. Khalil, S. Saeed and Z. Ahmad, Mechanical and thermal properties of polyimide/silica hybrids with imide-modified silica network structures, J. Appl. Polym. Sci., 2008, 107(2), 1257–1268 CrossRef CAS.
- V. Nebol'Sin, V. Galstyan and Y. Silina, Graphene oxide and its chemical nature: Multi-stage interactions between the oxygen and graphene, Surf. Interfaces, 2020, 21, 100763 CrossRef.
- K. Mkhoyan, A. Contryman, J. Silcox, D. Stewart, G. Eda, C. Mattevi, S. Miller and M. Chhowalla, Microanalysis, Atomic and electronic structure of graphene-oxide, Microscopy, 2010, 16(S2), 1704–1705 CAS.
- S. Bose, T. Kuila, A. K. Mishra, N. H. Kim and J. H. Lee, Dual role of glycine as a chemical functionalizer and a reducing agent in the preparation of graphene: an environmentally friendly method, J. Mater. Chem., 2012, 22(19), 9696–9703 RSC.
- D. K. Pandey, T. F. Chung, G. Prakash, R. Piner, Y. P. Chen and R. Reifenberger, Folding and cracking of graphene oxide sheets upon deposition, Surf. Sci., 2011, 605(17–18), 1669–1675 CrossRef CAS.
- C. Liu, G. Hu and H. Gao, Preparation of few-layer and single-layer graphene by exfoliation of expandable graphite in supercritical N, N-dimethylformamide, J. Supercrit. Fluids, 2012, 63, 99–104 CrossRef CAS.
- U. A. Kanta, V. Thongpool, W. Sangkhun, N. Wongyao and J. Wootthikanokkhan, Preparations, characterizations, and a comparative study on photovoltaic performance of two different types of graphene/TiO 2 nanocomposites photoelectrodes, J. Nanomater., 2017, 2017, 2758294 Search PubMed.
- Z. Hu, Y. Chen, Q. Hou, R. Yin, F. Liu and H. Chen, Characterization of graphite oxide after heat treatment, New J. Chem., 2012, 36(6), 1373–1377 RSC.
- M. U. Khan and M. A. Shaida, Reduction mechanism of graphene oxide including various parameters affecting the C/O ratio, Mater. Today Commun., 2023, 106577 CrossRef CAS.
- L. Shahriary and A. A. Athawale, Graphene oxide synthesized by using modified hummers approach, Int. J. Renew. Energy Environ. Eng, 2014, 2(01), 58–63 Search PubMed.
- M. L. Protopapa, E. Burresi, M. Plamisano, E. Pesce, L. Latterini, N. Taurisano, G. Quaglia, R. Mazzaro and V. Morandi, Changing the Microstructural and Chemical Properties of Graphene Oxide Through a Chemical Route, Appl. Spectrosc., 2022, 76(12), 1452–1464 CrossRef CAS PubMed.
- B. Meka Chufa, B. Abdisa Gonfa, T. Yohannes Anshebo and G. Adam Workneh, A novel and simplest green synthesis method of reduced graphene oxide using methanol extracted Vernonia Amygdalina: large-scale production, Adv. Condens. Matter Phys., 2021, 2021, 1–10 CrossRef.
- S. Setiadji, B. Nuryadin, H. Ramadhan, C. Sundari, T. Sudiarti, A. Supriadin and A. Ivansyah, In Preparation of reduced Graphene Oxide (rGO) assisted by microwave irradiation and hydrothermal for reduction methods, in Proceedings of the IOP Conference Series: Materials Science and Engineering, IOP Publishing, 2018, p. 012079 Search PubMed.
- S. Dutta, S. Sarkar, C. Ray and T. Pal, Benzoin derived reduced graphene oxide (rGO) and its nanocomposite: application in dye removal and peroxidase-like activity, RSC Adv., 2013, 3(44), 21475–21483 RSC.
- N. M. Dat, P. N. B. Long, D. C. U. Nhi, N. N. Minh, H. M. Nam, M. T. Phong and N. H. Hieu, Synthesis of silver/reduced graphene oxide for antibacterial activity and catalytic reduction of organic dyes, Synth. Met., 2020, 260, 116260 CrossRef CAS.
- J. Paredes, S. Villar-Rodil, A. Martínez-Alonso and J. M. Tascon, Graphene oxide dispersions in organic solvents, Langmuir, 2008, 24(19), 10560–10564 CrossRef CAS.
- (a) S. Park and R. S. Ruoff, Chemical methods for the production of graphenes, Nat. Nanotechnol., 2009, 4(4), 217–224 CrossRef CAS; (b) D. R. Dreyer, S. Park, C. W. Bielawski and R. S. Ruoff, The chemistry of graphene oxide, Chem. Soc. Rev., 2010, 39(1), 228–240 RSC.
- J. Liu, S. Fu, B. Yuan, Y. Li and Z. Deng, Toward a universal “adhesive nanosheet” for the assembly of multiple nanoparticles based on a protein-induced reduction/decoration of graphene oxide, J. Am. Chem. Soc., 2010, 132(21), 7279–7281 CrossRef CAS PubMed.
- F. Tuinstra and J. L. Koenig, Raman spectrum of graphite, J. Chem. Phys., 1970, 53(3), 1126–1130 CrossRef CAS.
- A. C. Ferrari, Raman spectroscopy of graphene and graphite: Disorder, electron–phonon coupling, doping and nonadiabatic effects, Solid State Commun., 2007, 143(1–2), 47–57 CrossRef CAS.
- V. Gupta, N. Sharma, U. Singh, M. Arif and A. Singh, Higher oxidation level in graphene oxide, Optik, 2017, 143, 115–124 CrossRef CAS.
- W. Jiang, G. Nadeau, K. Zaghib and K. Kinoshita, Thermal analysis of the oxidation of natural graphite—effect of particle size, Thermochim. Acta, 2000, 351(1–2), 85–93 CrossRef CAS.
- J. Song, X. Wang and C.-T. Chang, Preparation and characterization of graphene oxide, J. Nanomater., 2014, 2014, 276143 Search PubMed.
- J. Chen, B. Yao, C. Li and G. Shi, An improved Hummers method for eco-friendly synthesis of graphene oxide, Carbon, 2013, 64, 225–229 CrossRef CAS.
- B. Shen, D. Lu, W. Zhai and W. Zheng, Synthesis of graphene by low-temperature exfoliation and reduction of graphite oxide under ambient atmosphere, J. Mater. Chem. C, 2013, 1(1), 50–53 RSC.
- J. L. Li, K. N. Kudin, M. J. McAllister, R. K. Prud’homme, I. A. Aksay and R. Car, Oxygen-driven unzipping of graphitic materials, Phys. Rev. Lett., 2006, 96(17), 176101 CrossRef.
- J. F. Moulder, W. F. Stickle, P. E. Sobol and K. D. Bomben, Handbook of X-Ray Photoelectron Spectroscopy, ed. J. Chastain, Perkin-Elmer Corp., Eden Prairie, MN, 1992 Search PubMed.
- L. Shen, L. Zhang, K. Wang, L. Miao, Q. Lan, K. Jiang, H. Lu, M. Li, Y. Li and B. Shen, Analysis of oxidation degree of graphite oxide and chemical structure of corresponding reduced graphite oxide by selecting different-sized original graphite, RSC Adv., 2018, 8(31), 17209–17217 RSC.
- Y. Jin, Y. Zheng, S. G. Podkolzin and W. Lee, Band gap of reduced graphene oxide tuned by controlling functional groups, J. Mater. Chem. C, 2020, 8(14), 4885–4894 RSC.
- S. Qin, C. Chen, M. Cui, A. Zhang, H. Zhao and L. Wang, Facile preparation of polyimide/graphene nanocomposites via an in situ polymerization approach, RSC Adv., 2017, 7(5), 3003–3011 RSC.
- Y. Li, X. Pei, B. Shen, W. Zhai, L. Zhang and W. J. R. A. Zheng, Polyimide/graphene composite foam sheets with ultrahigh thermostability for electromagnetic interference shielding, RSC Adv., 2015, 5(31), 24342–24351 RSC.
- T. Huang, Y. Xin, T. Li, S. Nutt, C. Su, H. Chen, P. Liu and Z. J. A. Lai, a. m.; interfaces, Modified graphene/polyimide nanocomposites: reinforcing and tribological effects, ACS Appl. Mater. Interfaces, 2013, 5(11), 4878–4891 CrossRef CAS.
- X. Huang, X. Qi, F. Boey and H. Zhang, Graphene-based composites, Chem. Soc. Rev., 2012, 41(2), 666–686 RSC.
- D. Chung, Electromagnetic interference shielding effectiveness of carbon materials, J. carbon, 2001, 39(2), 279–285 CrossRef CAS.
- X. C. Tong, Advanced Materials and Design for Electromagnetic Interference Shielding, CRC press, 2016 Search PubMed.
- L. Omana, A. Chandran, R. E. John, R. Wilson, K. C. George, N. V. Unnikrishnan, S. S. Varghese, G. George, S. M. Simon and I. Paul, Recent advances in polymer nanocomposites for electromagnetic interference shielding: A Review, ACS omega, 2022, 7(30), 25921–25947 CrossRef CAS PubMed.
- Z. Chen, C. Xu, C. Ma, W. Ren and H. M. Cheng, Lightweight and flexible graphene foam composites for high-performance electromagnetic interference shielding, Adv. Mater., 2013, 25(9), 1296–1300 CrossRef CAS PubMed.
- H. B. Zhang, Q. Yan, W. G. Zheng, Z. He and Z. Z. Yu, Tough graphene− polymer microcellular foams for electromagnetic interference shielding, ACS Appl. Mater., 2011, 3(3), 918–924 CrossRef CAS PubMed.
- B. Santhosi, K. Ramji and N. M. Rao, Design and development of polymeric nanocomposite reinforced with graphene for effective EMI shielding in X-band, Phys. B, 2020, 586, 412144 CrossRef CAS.
| This journal is © The Royal Society of Chemistry 2024 |

