DOI:
10.1039/D4RA00505H
(Paper)
RSC Adv., 2024,
14, 11037-11056
Construction of magnetic MoS2/NiFe2O4/MIL-101(Fe) hybrid nanostructures for separation of dyes and antibiotics from aqueous media†
Received
19th January 2024
, Accepted 2nd April 2024
First published on 5th April 2024
Abstract
In this study, MoS2/NiFe2O4/MIL-101(Fe) nanocomposite was synthesized by hydrothermal method and used as an adsorbent for the elimination of organic dyes and some antibiotic drugs in aqueous solutions. The synthesized nanocomposite underwent characterization through different techniques, including scanning electron microscopy (FE-SEM), energy-dispersive X-ray spectroscopy (EDX), Brunauer–Emmett–Teller (BET) surface area analysis, Fourier transform infrared (FT-IR) spectroscopy, X-ray diffraction (XRD), zeta potential analysis, vibrating sample magnetometry (VSM), and UV-vis diffuse reflectance spectroscopy (UV-vis DRS). These results demonstrated the successful insertion of MoS2within the cavities of MIL-101(Fe). The as-prepared magnetic nanocomposite was used as a new magnetic adsorbent for removing methylene blue (MB) and rhodamine B (RhB) organic dyes and tetracycline (TC) and ciprofloxacin (CIP) antibiotic drugs. For achieving the optimized conditions, the effects of initial pH, initial dye and drug concentration, temperature, and adsorbent dose on MB, TC, and CIP elimination were investigated. The results revealed that at a temperature of 25 °C, the highest adsorption capacities of MoS2/NiFe2O4/MIL-101(Fe) for MB, TC, and CIP were determined to be 999.1, 2991.3, and 1994.2 mg g−1, respectively. The pseudo-second-order model and Freundlich model are considered suitable for explaining the adsorption behavior of the MoS2/NiFe2O4/MIL-101(Fe) nanocomposite. The magnetic nanocomposite was very stable and had good recycling capability without any change in its structure.
1. Introduction
The industrialization of the modern world and the increase in population have caused many environmental problems. Various inorganic and organic contaminants, including heavy metals, dyes, endocrine-disrupting compounds, pharmaceuticals, and personal care products, have often been detected in numerous drinking water sources and wastewaters worldwide.1,2 Organic dyes are commonly utilized across multiple industries, including textiles, pharmaceuticals, cosmetics, medicine, paper, and leather.3,4 Dye pollutants are highly toxic and do not break down easily. After these pollutants enter the water environment, they affect the lives of living organisms and cause diseases such as kidney and bladder cancer, as well as damage to nervous tissues.5,6 Dye molecules have a very complex and stable structure and cause various diseases.7,8 Another group of water pollutants are antibiotics.9 Antibiotics, antihypertensive drugs, and painkillers are excreted in the form of urine and faces, so a large amount of their residues can be seen in sewage effluents, soil, surfaces, and underground water.10–13 Two types of well-known, available, and inexpensive antibiotics that are prescribed to fight infectious diseases, bacteria, fungi, and parasites in humans, livestock, and poultry are tetracycline and ciprofloxacin, which can be detected in aquatic environments.14–17 The presence of these compounds, due to their metabolic properties, lack of decomposition, and accumulation in the environment, has caused serious problems in the lives of biological species. Therefore, it is very important to remove such compounds from water sources. In this regard, the design and synthesis of new and efficient adsorbents for efficient elimination of pollutants from wastewater is an attractive target.
There are various methods to remove organic dyes and antibiotic compounds, including photocatalysis,18,19 Fenton reaction, surface adsorption,20 advanced oxidation,21 and biological treatment.22 The method of surface adsorption is suitable as an effective process to remove these impurities from water. For the adsorption process, clay, graphene oxide, carbon nanotubes, and biochar have been used as adsorbents.23–25 Other compounds, such as TiO2, ZnO, and molybdenum disulfide (MoS2), can also be used as adsorbents to remove aqueous pollutants. Among the reported adsorbents, the two-dimensional 2D MoS2 material can be very promising due to its high oxidation ability, chemical stability, and adjustable distance between layers.26–29 These characteristics have made this compound suitable for use in the manufacture of lubricants, the manufacture of lithium and sodium batteries, and in nana devices.30,31 The main problem of with composition is the limited number of active sites attributed to the van der Waals interactions in the layered crystals, which facilitate the aggregation of MoS2 nanosheets. In order to overcome these constraints, researchers have employed metal–organic frameworks (MOFs) to augment the characteristics of MoS2. MOFs have garnered significant interest in adsorption and separation applications owing to their extensive pore structures.32–35 MOFs are porous and crystalline materials that consist of a metal component and an organic ligand and have a large emission area and very high porosity. MOFs have gained significant recognition as an excellent adsorbent for efficiently eliminating pollutants. These MOFs possess remarkable environmental compatibility and exhibit minimal toxicity, making them highly suitable for pollution removal purposes. Coupling MoS2 with MOF porous structure significantly increases the ability to remove pollutants from aqueous environments.36–39 However, these MOF-based composites are not easily recyclable in aqueous environments. For convenient separation of these compounds, they can be combined with magnetic nanoparticles such as nickel ferrite. Utilizing an external magnet, magnetic separation presents a direct approach to improve the recyclability of samples.
In this research, MoS2 nanosheets with a flower-like morphology were integrated into the MIL-101(Fe) metal organic framework along with NiFe2O4 magnetic nanoparticles to create a novel magnetically recoverable MoS2/NiFe2O4/MIL-101(Fe) ternary nanocomposite. The structure and morphological features of the nanocomposite were thoroughly investigated using various techniques. The MoS2/NiFe2O4/MIL-101(Fe) nanocomposite exhibited remarkable effectiveness in adsorbing a wide range of environmental contaminants like methylene blue (MB), methyl orange (MO), and rhodamine B (RhB), as well as pharmaceutical compounds like tetracycline (TC) and ciprofloxacin (CIP) from water solutions. Moreover, the nanocomposite can be effortlessly extracted from the reaction setup using an external magnet. These findings highlight the potential of the synthesized nanocomposite in the treatment of wastewater contaminated with organic pollutants.
2. Experimental
2.1. Materials
Terephthalic acid (H2BDC, 98%), iron(III) chloride hexahydrate (FeCl3·6H2O, 99%), N,N-dimethylformamide (DMF, 99%), sodium hydroxide (NaOH, 98%), nickel(II) nitrate hexahydrate (Ni(NO3)3·6H2O, 98%), iron(III) nitrate nonahydrate (Fe(NO3)3·9H2O, 98%), thiourea (CH4N2S, 98%) (99%), sodium molybdate (Na2MoO4·2H2O, 98%), oxalic acid (C2H2O4·2H2O, 98%), methylene blue (MB, C16H18ClN3S, 99%), methyl orange (MO, C14H14N3NaO3S, 99%), rhodamine B (RhB, C28H31ClN2O3, 99%) were provided from Merck Chemical Co. and tetracycline (TC, 99.5%), ciprofloxacin (CIP, 95.5%) drugs were obtained from Exir pharmaceutics Co. (Boroujerd, Iran).
2.2. Synthesis of flower-like MoS2 nanosheets
The MoS2 sample was prepared using the hydrothermal method. 4 mmol of sodium molybdate (Na2MoO4·2H2O) was dissolved with 15 mmol of thiourea (CH4N2S) and 3 mmol of oxalic acid in (C2H2O4·2H2O) 40 mL of deionized water and stirred for 3 hours. Then the clear solution was transferred into a Teflon-lined autoclave and placed in an oven at 200 °C for 24 hours. The autoclave was cooled to room temperature, and then the precipitate was dried in an oven at 80 °C for 4 hours.
2.3. Synthesis of magnetic NiFe2O4 nanoparticles
By employing the hydrothermal method, nickel-ferrite (NiFe2O4) nanoparticles were successfully synthesized. Fe (NO3)3·9H2O (1.62 g) and Ni (NO3)2·6H2O (0.705 g) were combined with 25 mL of distilled water and stirred for 30 min, then 10 mL of a 6 M NaOH solution was added. The suspension was stirred for 1 hour. Then, it was transferred to an autoclave lined with Teflon and subjected to a temperature of 200 °C for 24 hours. The autoclave was cooled to room temperature. The sediment obtained was washed several times with water and ethanol to remove impurities. Then, it was placed in an oven at a temperature of 60 °C for 12 hours to dry.
2.4. Fabrication of magnetic MoS2/NiFe2O4/MIL-101(Fe) nanocomposite
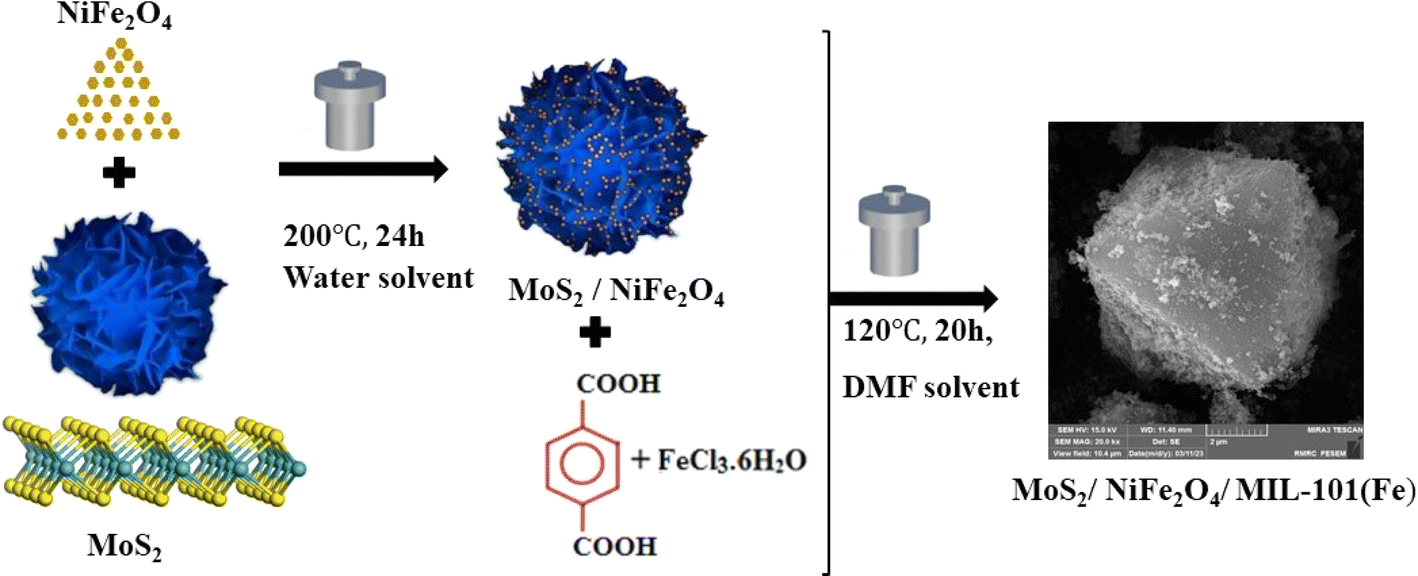
For the fabrication of MoS2/NiFe2O4/MIL-101(Fe) magnetic adsorbent, FeCl3·6H2O (1.35 g), H2BDC (0.415 g), MoS2 (0.6 g), and NiFe2O4 (0.25) g were mixed with 30 mL of DMF, and it was stirred for 30 minutes. Then the resulting suspension was transferred to a Teflon-lined autoclave and placed at a temperature of 120 °C for 20 hours. The autoclave was cooled to room temperature. After washing several times with DMF, the resulting precipitate was dried in an oven at a temperature of 60 °C (Fig. 1).
 |
| | Fig. 1 The preparation process of MoS2/NiFe2O4/MIL-101(Fe) nanocomposite. | |
2.5. Characterization
FT-IR spectra were recorded using a Shimadzu-8400S spectrometer (Japan) in the wavenumber range of 400–4000 cm−1. The structure and level of crystallinity of samples were determined by using a Philips 8440 X-Pert X-ray diffractometer (Netherland), operating at 40 mA and 40 kV with copper radiation (k = 0.1542 nm). UV-vis spectra were recorded on a Carry 100 Varian spectrophotometer (USA). N2 adsorption–desorption isotherms and BJH pore-size distribution plots of samples were determined by using a Micro metrics PHS-1020 instrument (Japan) at 77 K. The degassing process of samples was performed at 150 °C. The magnetic properties of samples at 27 °C within the range of ±15![[thin space (1/6-em)]](https://www.rsc.org/images/entities/char_2009.gif) 000 Oe was carried out using a vibrating magnetometer (Iran). The surface charge of the materials was investigated by zeta potential measurements on a HORIBA Scientific Zetasizer (Japan). A MIRA3 TESCAN scanning electron microscope (Czech) was employed to examine the morphology of the prepared materials, while X-ray energy analysis (EDX) was utilized for elemental analysis of the samples.
000 Oe was carried out using a vibrating magnetometer (Iran). The surface charge of the materials was investigated by zeta potential measurements on a HORIBA Scientific Zetasizer (Japan). A MIRA3 TESCAN scanning electron microscope (Czech) was employed to examine the morphology of the prepared materials, while X-ray energy analysis (EDX) was utilized for elemental analysis of the samples.
2.6. Dye absorption tests
In this investigation, the solutions of organic dyes (MB, RhB, and MO) were separately prepared in deionized water. The stock aqueous solutions had a concentration of 200 ppm. Subsequently, dilution was performed using these solutions. The absorbance spectra of MB, MO, and RhB dyes were monitored measured by a UV-vis spectrophotometer at wavelengths of 664, 463, and 554 nm, respectively. Various parameters including different dye concentrations, pH effects, temperature effects, and absorbent dosage were investigated. In order to assess the influence of the initial concentration, 25 mg of magnetic nanocomposite was poured into dye solutions of RhB, MB, and MO. The dye solutions had concentrations varying from 25 to 150 ppm, and a volume of 30 mL was used. To examine the impact of pH on the adsorption process, the initial pH of the MB solutions was adjusted by adding HCl (0.1 mol L−1) for acidic conditions and NaOH (0.1 mol L−1) for alkaline conditions in the range of 2–10. Furthermore, we investigated the effect of temperature on the adsorption process by conducting experiments at temperatures ranging from 25 to 65 °C.
To assess the composite's effectiveness, the solutions containing the magnetic adsorbent were collected using a magnet after each use. Afterwards, they were subjected to repeated washing with ethanol and DMF. After that, the adsorbent underwent a 24 hours drying process at 60 °C in an oven and was subsequently utilized for further testing. The equilibrium capacity of adsorption (qe in mg g−1) and the percentage of removal (R (%)) were obtained through the use of the following equations (eqn (1) and (2)):
| | |
R (%) = (C0 − Ce) × 100/C0
| (2) |
Here,
C0 and
Ce (mg L
−1, ppm) symbolize the initial and ultimate concentrations of the pollutant, whereas
V (L) and
m (g) indicate the volume of the pollutant solution and the mass of the absorbent substance, respectively.
2.7. Drug adsorption tests
The magnetic MoS2/NiFe2O4/MIL-101(Fe) nanocomposite was utilized to facilitate the adsorption process of TC and CIP drugs. In this study, various factors were investigated, including pH, temperature, adsorbent dose, and initial drug concentration. The temperature levels considered were 25, 35, 45, 55, and 65 °C. The acidic conditions studied included pH 2 and 4, while the neutral conditions were around pH 7, and the alkaline conditions were pH 8 and 10. The initial drug concentrations were categorized as low drug concentrations (25 mg L−1), medium drug concentrations (50, 75, and 100 mg L−1), and high drug concentrations (125 mg L−1). The adsorbent doses were selected as 15, 25, 35 and 45 mg.
To examine the adsorption process, medicinal solutions of TC and CIP with a concentration of 200 mg L−1 were prepared separately and subsequently diluted. Then, specific amounts of magnetic adsorbent were added to a 50 mL aqueous drug solution and stirred. Afterward, the medicinal solution was separated from the magnetic adsorbent. The concentrations of TC and CIP drugs were determined using UV-vis spectrophotometry at wavelengths of 373 and 337 nm, respectively. The pH of the solutions was adjusted by using HCl (0.1 mol L−1) and NaOH (0.1 mol L−1) aqueous solutions.
To investigate the impact of temperature on adsorption, a series of experiments were conducted at different temperatures, namely 25, 35, 45, 55, and 65 °C, in order to evaluate their respective effects. For every given temperature, 25 mg of magnetic adsorbent was used in a 50 mL drug solution. After each test, the magnetic adsorbent was separated from the drug solution using a magnet. It was then washed multiple times with DMF and ethanol before undergoing a 24 hours drying process in an oven set to 60 °C. To compute the adsorption capacities (qe) of the two antibiotics, the above equations (eqn (1) and (2)) were employed.
3. Results and discussion
3.1. Characterization of the as-prepared samples
3.1.1 FT-IR analysis. FT-IR spectroscopy is a useful method for analyzing functional groups in organic and inorganic materials. Fig. 2 exhibits the IR spectra of NiFe2O4, MIL-101(Fe), MoS2, and the MoS2/NiFe2O4/MIL-101(Fe) composite samples over the range of 400–4000 cm−1. The FT-IR spectrum of NiFe2O4 in Fig. 2(a) shows two bands at 601 and 424 cm−1, which are attributed to the stretching vibrations of the metal–oxygen bond at the tetrahedral and octahedral sites in spinel structures, respectively.40 The presence of characteristic peaks at 547, 748, 1014, 1392, and 1600 cm−1 in Fig. 2(b) provides evidence for the successful synthesis of MIL-101(Fe).41 The 1014 cm−1 band was assigned to the C–O–C bending vibrations, whereas the 748 cm−1 band was indicative of the C–H bending vibrations. Furthermore, the confirmation of the O–C![[double bond, length as m-dash]](https://www.rsc.org/images/entities/char_e001.gif) O asymmetric and symmetric vibrations at 1600 and 1392 cm−1 reinforces the conclusions drawn in prior research.42 Fig. 2(c) illustrates the FT-IR spectrum of MoS2, where the presence of a peak at 474 cm−1 indicates the characteristic S–S bond of MoS2. Additionally, the spectrum exhibits prominent and distinct peaks at 3435 cm−1 and 1620 cm−1, corresponding to the stretching vibration of –OH groups and the existence of adsorbed water. These spectral characteristics provide valuable information regarding the molecular properties and environmental interactions of MoS2.43 In Fig. 2(d), the nanocomposite exhibits the existence of magnetic NiFe2O4 through distinctive bands in the range of 400–600 cm−1.44 Moreover, the emergence of bands around 1600 and 1392 cm−1 can be attributed to the existence of carboxylate groups within the MIL-101(Fe) constituent. The intensity of the weak band at 474 cm−1, which is attributed to the S–S bond of MoS2, exhibits a decline after exposure to the composite. The observed attenuation of the S–S bond confirms the structural modifications occurring within the composite and validates the synthesis process.
O asymmetric and symmetric vibrations at 1600 and 1392 cm−1 reinforces the conclusions drawn in prior research.42 Fig. 2(c) illustrates the FT-IR spectrum of MoS2, where the presence of a peak at 474 cm−1 indicates the characteristic S–S bond of MoS2. Additionally, the spectrum exhibits prominent and distinct peaks at 3435 cm−1 and 1620 cm−1, corresponding to the stretching vibration of –OH groups and the existence of adsorbed water. These spectral characteristics provide valuable information regarding the molecular properties and environmental interactions of MoS2.43 In Fig. 2(d), the nanocomposite exhibits the existence of magnetic NiFe2O4 through distinctive bands in the range of 400–600 cm−1.44 Moreover, the emergence of bands around 1600 and 1392 cm−1 can be attributed to the existence of carboxylate groups within the MIL-101(Fe) constituent. The intensity of the weak band at 474 cm−1, which is attributed to the S–S bond of MoS2, exhibits a decline after exposure to the composite. The observed attenuation of the S–S bond confirms the structural modifications occurring within the composite and validates the synthesis process.
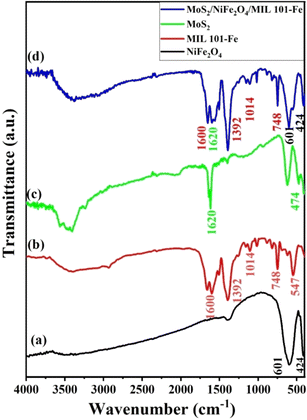 |
| | Fig. 2 FT-IR spectra of (a) NiFe2O4, (b) MIL-101(Fe), (c) MoS2, and (d) MoS2/NiFe2O4/MIL-101(Fe). | |
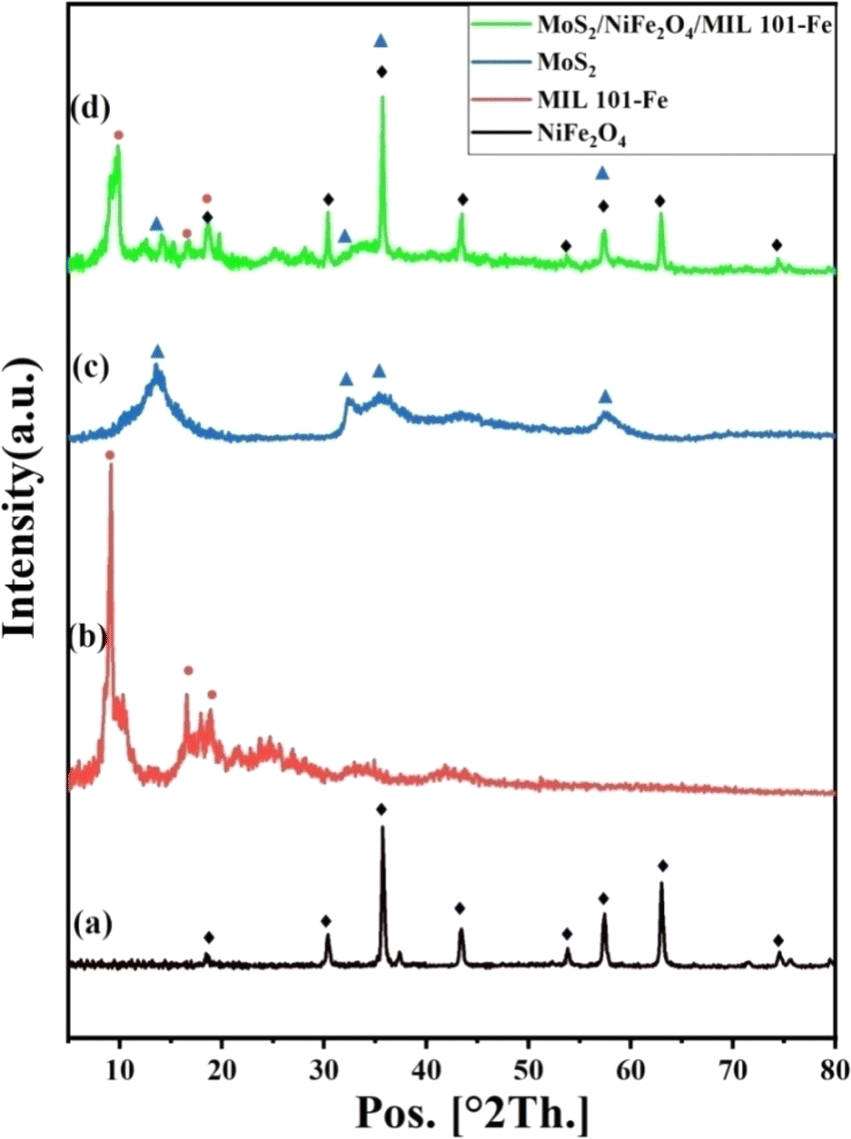
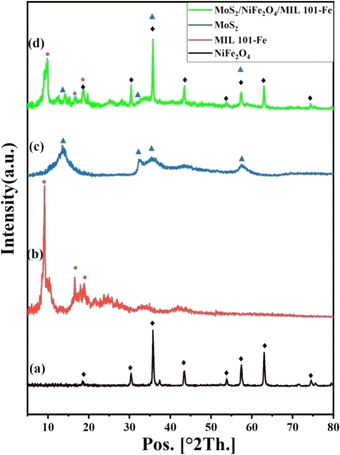
3.1.2 Powder X-ray diffraction (XRD). The XRD analysis was used to analyze the crystallographic information of the materials synthesized. In Fig. 3, the XRD diffraction patterns of NiFe2O4, MoS2, MIL-101(Fe), and the MoS2/NiFe2O4/MIL-101(Fe) composite are displayed. Fig. 3(a) shows the XRD peaks of the synthesized NiFe2O4 nanoparticles. The structure of NiFe2O4 was cubic spinel. Sharp peaks appeared at 2θ = 35.88° (311), whereas other peaks appeared at 2θ = 30.47° (220), 38.06° (222), 43.44° (400), 53.75° (422), 57.31° (511), and 62.93° (440).40 The XRD pattern of MIL-101(Fe) is depicted in Fig. 3(b), showing distinct diffractions at 2θ values of 9.36°, 18.98°, and 23.70°, corresponding to the crystal planes (311), (511), and (852) of the MIL-101(Fe) phase.42 Fig. 3(c) shows the XRD pattern of MoS2 with peaks located at 13.64°, 32.36°, 35.57°, 43.46°, and 57.54°, corresponding to (002), (100), (102), (104), and (110) hexagonal crystallographic planes of MoS2.43 The XRD analysis of the MoS2/NiFe2O4/MIL-101(Fe) composite in Fig. 3(d) demonstrates the existence of distinct peaks corresponding to MoS2, NiFe2O4, and MIL-101(Fe). However, the characteristic peak intensity was obviously decreased, indicating the good dispersion of MoS2 and NiFe2O4 in the MIL-101(Fe) MOF after the synthesis of the MoS2/NiFe2O4/MIL-101(Fe) composite.
 |
| | Fig. 3 XRD patterns of (a) NiFe2O4, (b) MIL-101(Fe), (c) MoS2, and (d) MoS2/NiFe2O4/MIL-101(Fe). | |
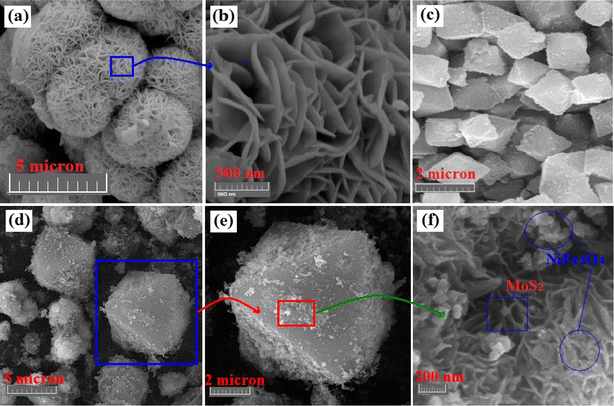
3.1.3 Structural morphology. The structural morphology and shape of the crystals were analyzed using field emission scanning electron microscopy (FESEM), and the corresponding images are shown in Fig. 4. For the case of MoS2, as shown in Fig. 4(a) and (b), the nanosheets were agglomerated, forming hierarchical microspheres, with the MoS2 nanosheets (thickness: 5–10 nm) stacked in layers. As shown in Fig. 4(c), the nascent MIL-101(Fe) crystals have well-defined octahedral shapes with a diameter of 1–2 μm. This indicates uniform growth of the MOF crystals during hydrothermal synthesis, imparting regular crystallinity. Furthermore, for the nanocomposite in Fig. 4(d), the similar octahedral crystal structure was decorated with MoS2 patches on the outer surface of the MOF crystals, with no alteration of the overall crystal shape or morphology. Indeed, the introduction of MoS2 changed the sizes of the octahedrons from 1–2 μm to 5–10 μm with a rough surface. As can be seen in Fig. 4(e), the MoS2 nanosheets were uniformly distributed and anchored on the surfaces of the MIL-101(Fe) crystals. From the high-resolution image of the MoS2 patches on the outer surface of the composite in Fig. 4(f), it can be observed that the NiFe2O4 nanoparticles are well dispersed densely on the surface of sheet-like MoS2 patches. The agglomerated patch-like growth of MoS2 nanosheets imparts surface heterogeneity and defects, and this kind of structure is highly efficient for the introduction of a large number of active sites and boosting the adsorption process.
 |
| | Fig. 4 FESEM images of (a and b) MoS2, (c) nascent MIL-101(Fe) MOF crystals, (d and e) MoS2/NiFe2O4/MIL-101(Fe) ternary nanocomposite and (f) high-resolution image of MoS2 patches on MIL-101(Fe) crystals. | |
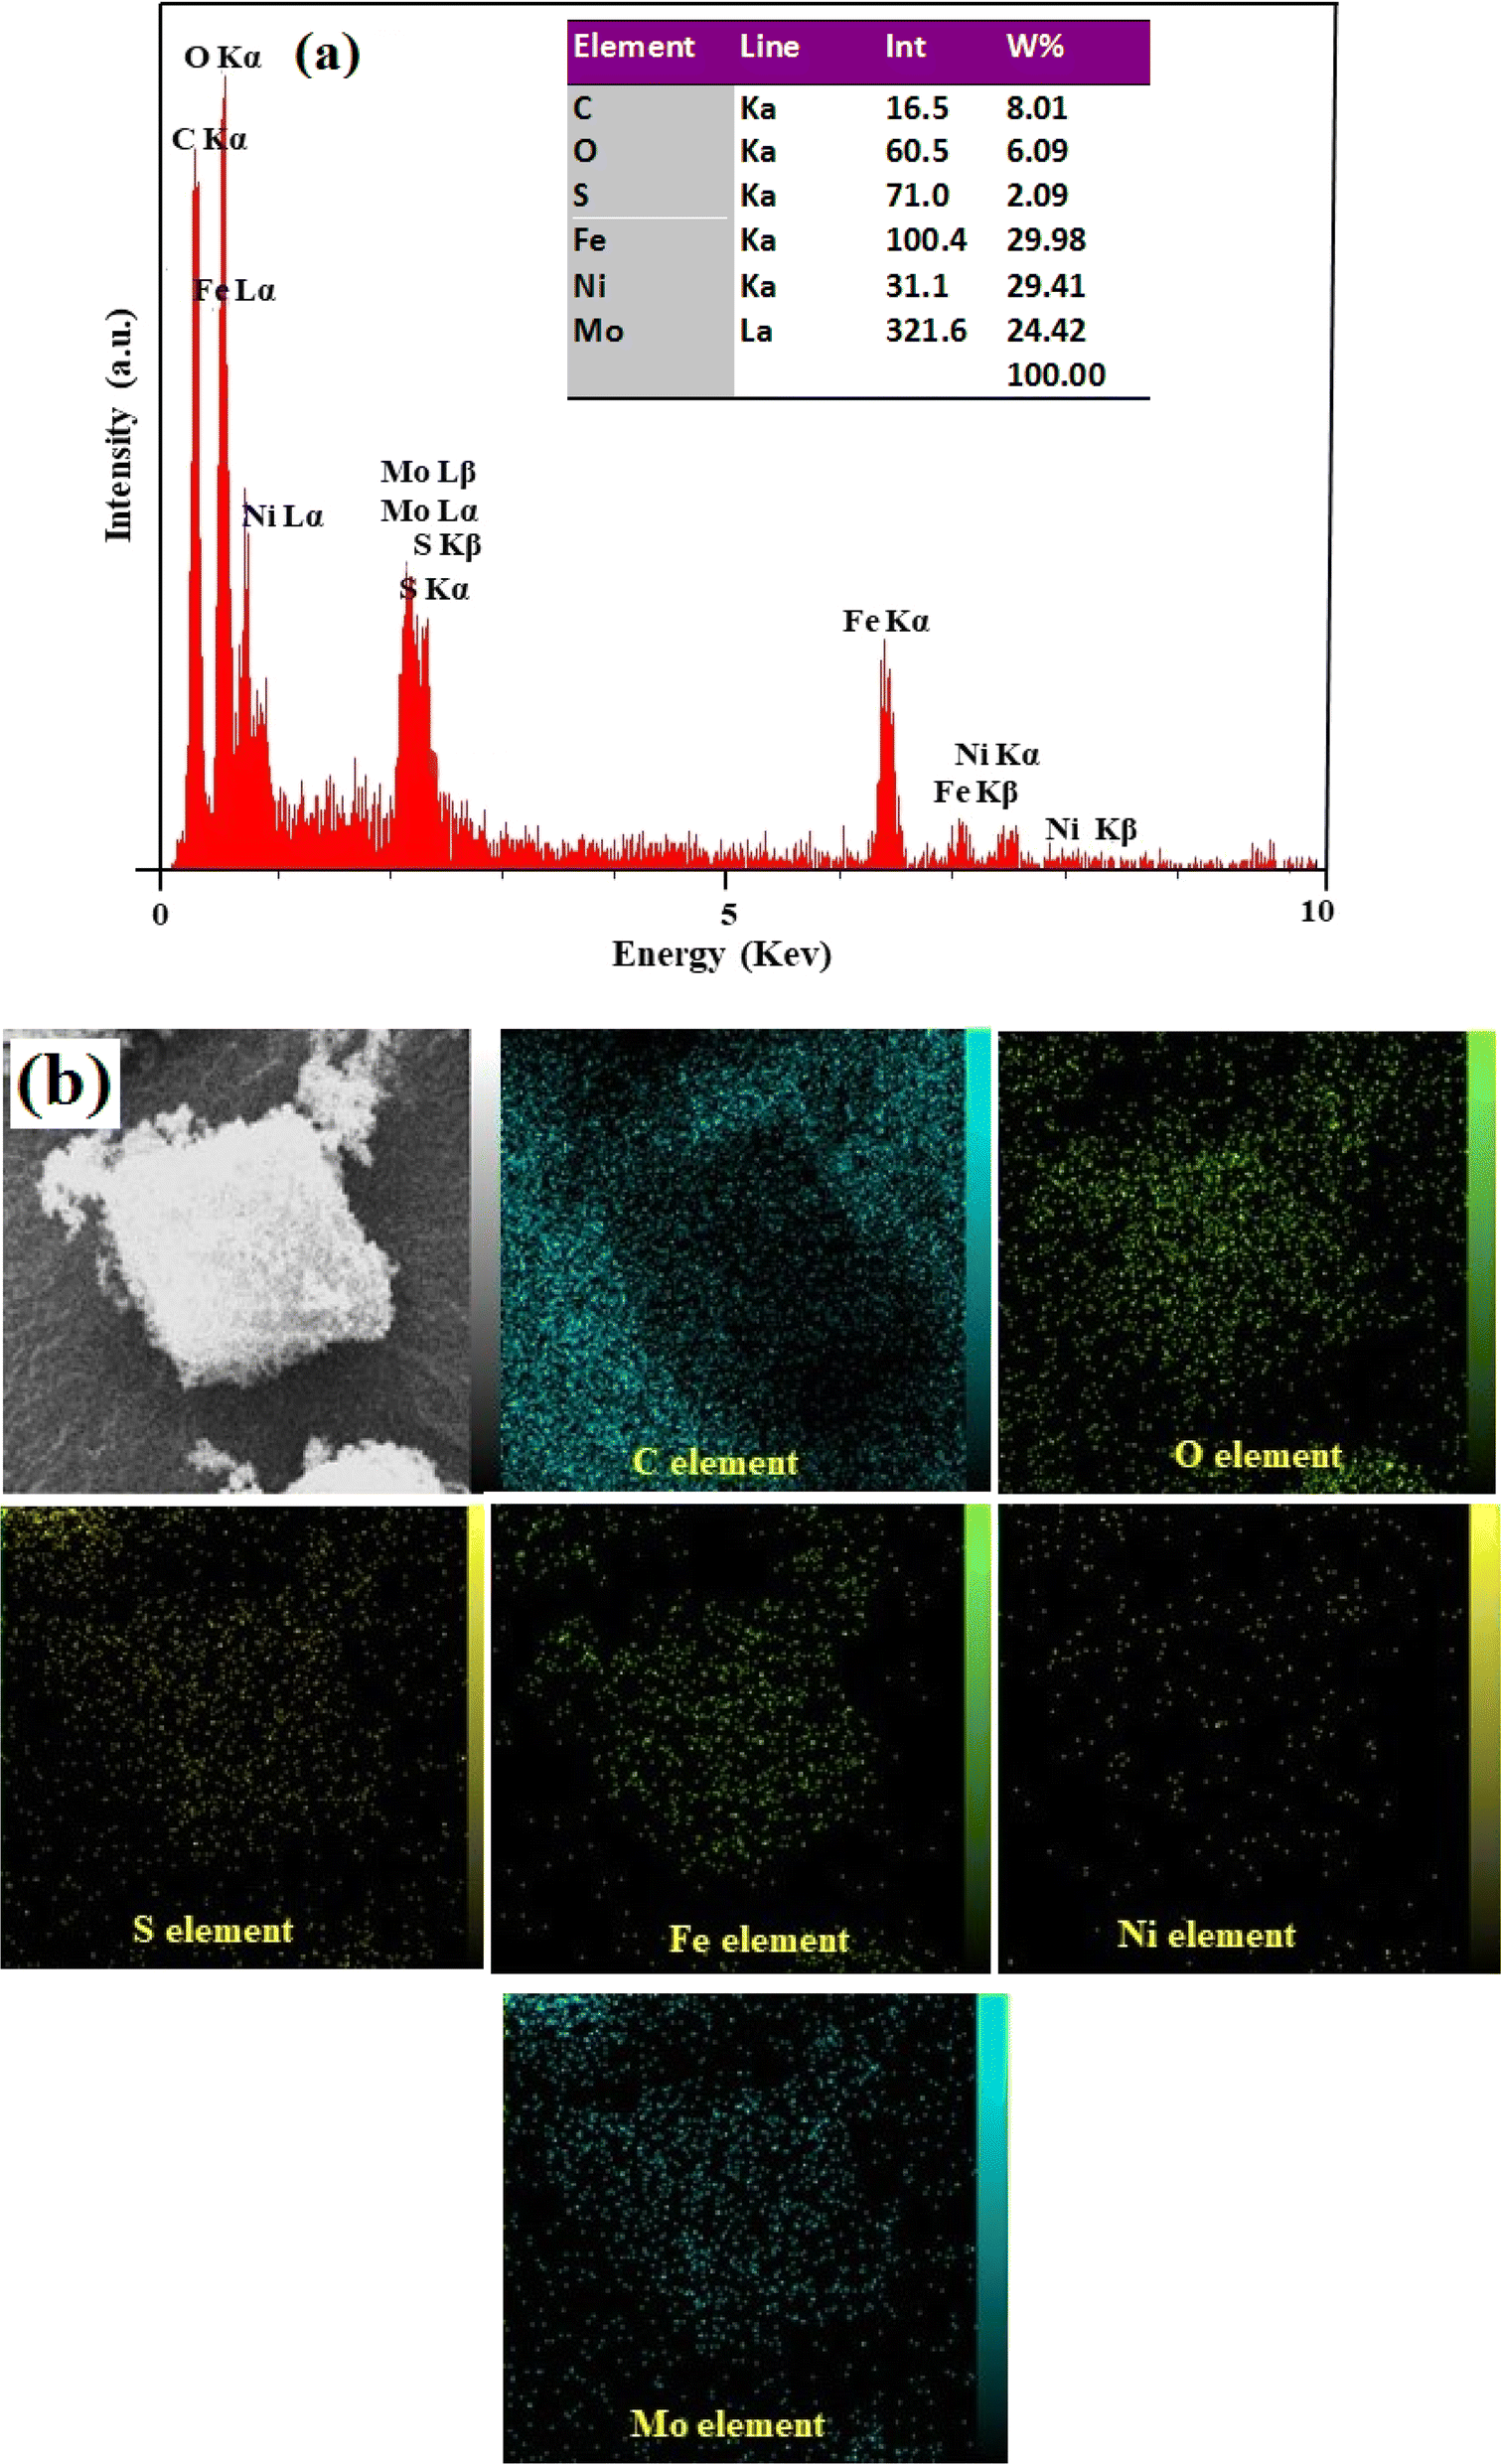
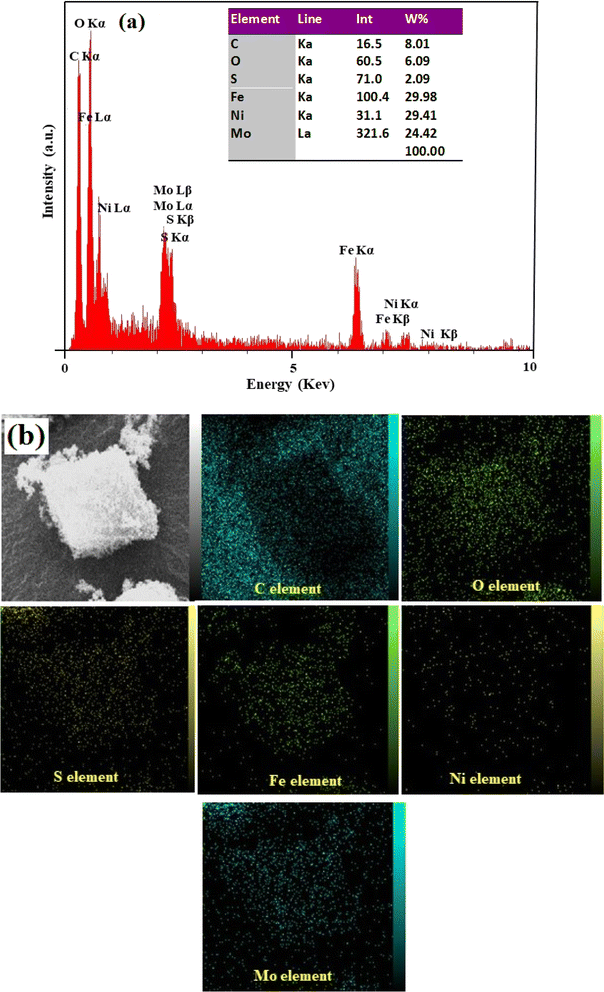
3.1.4 EDX analysis. Energy dispersive X-ray spectroscopy (EDX) is a powerful tools used to study the chemical composition of materials at the nanoscale. Analysis of the X-ray spectrum emitted from a sample can determine the elemental composition of the sample with high precision and accuracy. The EDX spectrum confirms the presence of various elements in the composite. The results of EDX mapping confirm the distribution of elements and the homogeneity of the samples. Fig. 5(a) confirmed the presence of multiple elements, including C, O, S, Fe, Ni and Mo elements within the composite. The table in the inset of Fig. 5(a) shows the quantitative elemental analysis results of the MoS2/NiFe2O4/MIL-101(Fe) nanocomposite. In addition, EDX elemental mappings of an octahedral crystal structure of the MIL-101(Fe) MOF decorated with MoS2 and NiFe2O4 in Fig. 5(b) show that elements were uniformly distributed over the MoS2/NiFe2O4/MIL-101(Fe) composite.
 |
| | Fig. 5 (a) EDX spectrum and (b) an indicative SEM image of the MoS2/NiFe2O4/MIL-101(Fe) with corresponding elemental mappings. | |
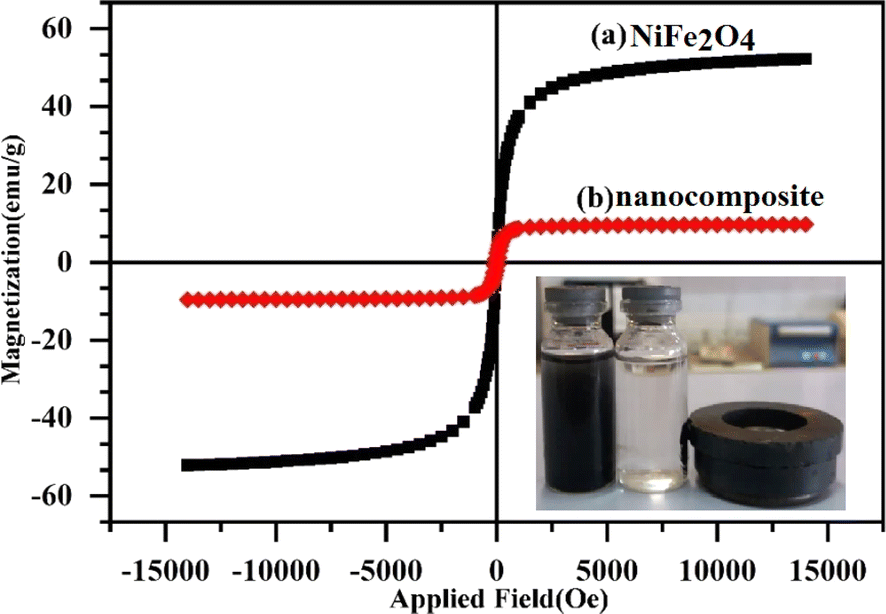
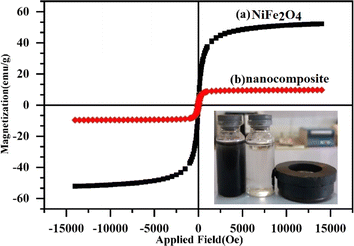
3.1.5 Magnetic properties. The magnetic parameters of NiFe2O4 nanoparticles and MoS2/NiFe2O4/MIL-101(Fe) nanocomposite samples, including magnetic saturation (MS), coercivity (HC), and magnetic retardation (Mr), were obtained from their hysteresis curves. The hysteresis curves in Fig. 6 exhibit superparamagnetic behavior at room temperature, revealing the presence of small magnetic nanoparticles. The saturation magnetization (MS) value for MoS2/NiFe2O4/MIL-101(Fe) nanocomposite is about 11.52 emu g−1, which is lower than that of pure NiFe2O4 nanoparticles (53.92 emu g−1). The primary cause of this decrease can be attributed to the presence of non-magnetic MoS2/MIL-101(Fe) particles in the nanocomposite. As shown in the inset of Fig. 6, the synthesized nanocomposite still possesses a sufficient magnetization for easy and fast separation from the contaminated water using a magnet. Then, the magnetic property of the nanocomposite helps us to separate the particles easily after its use in the adsorption process.
 |
| | Fig. 6 Magnetization curves of (a) NiFe2O4 and (b) MoS2/NiFe2O4/MIL-101(Fe) samples. | |
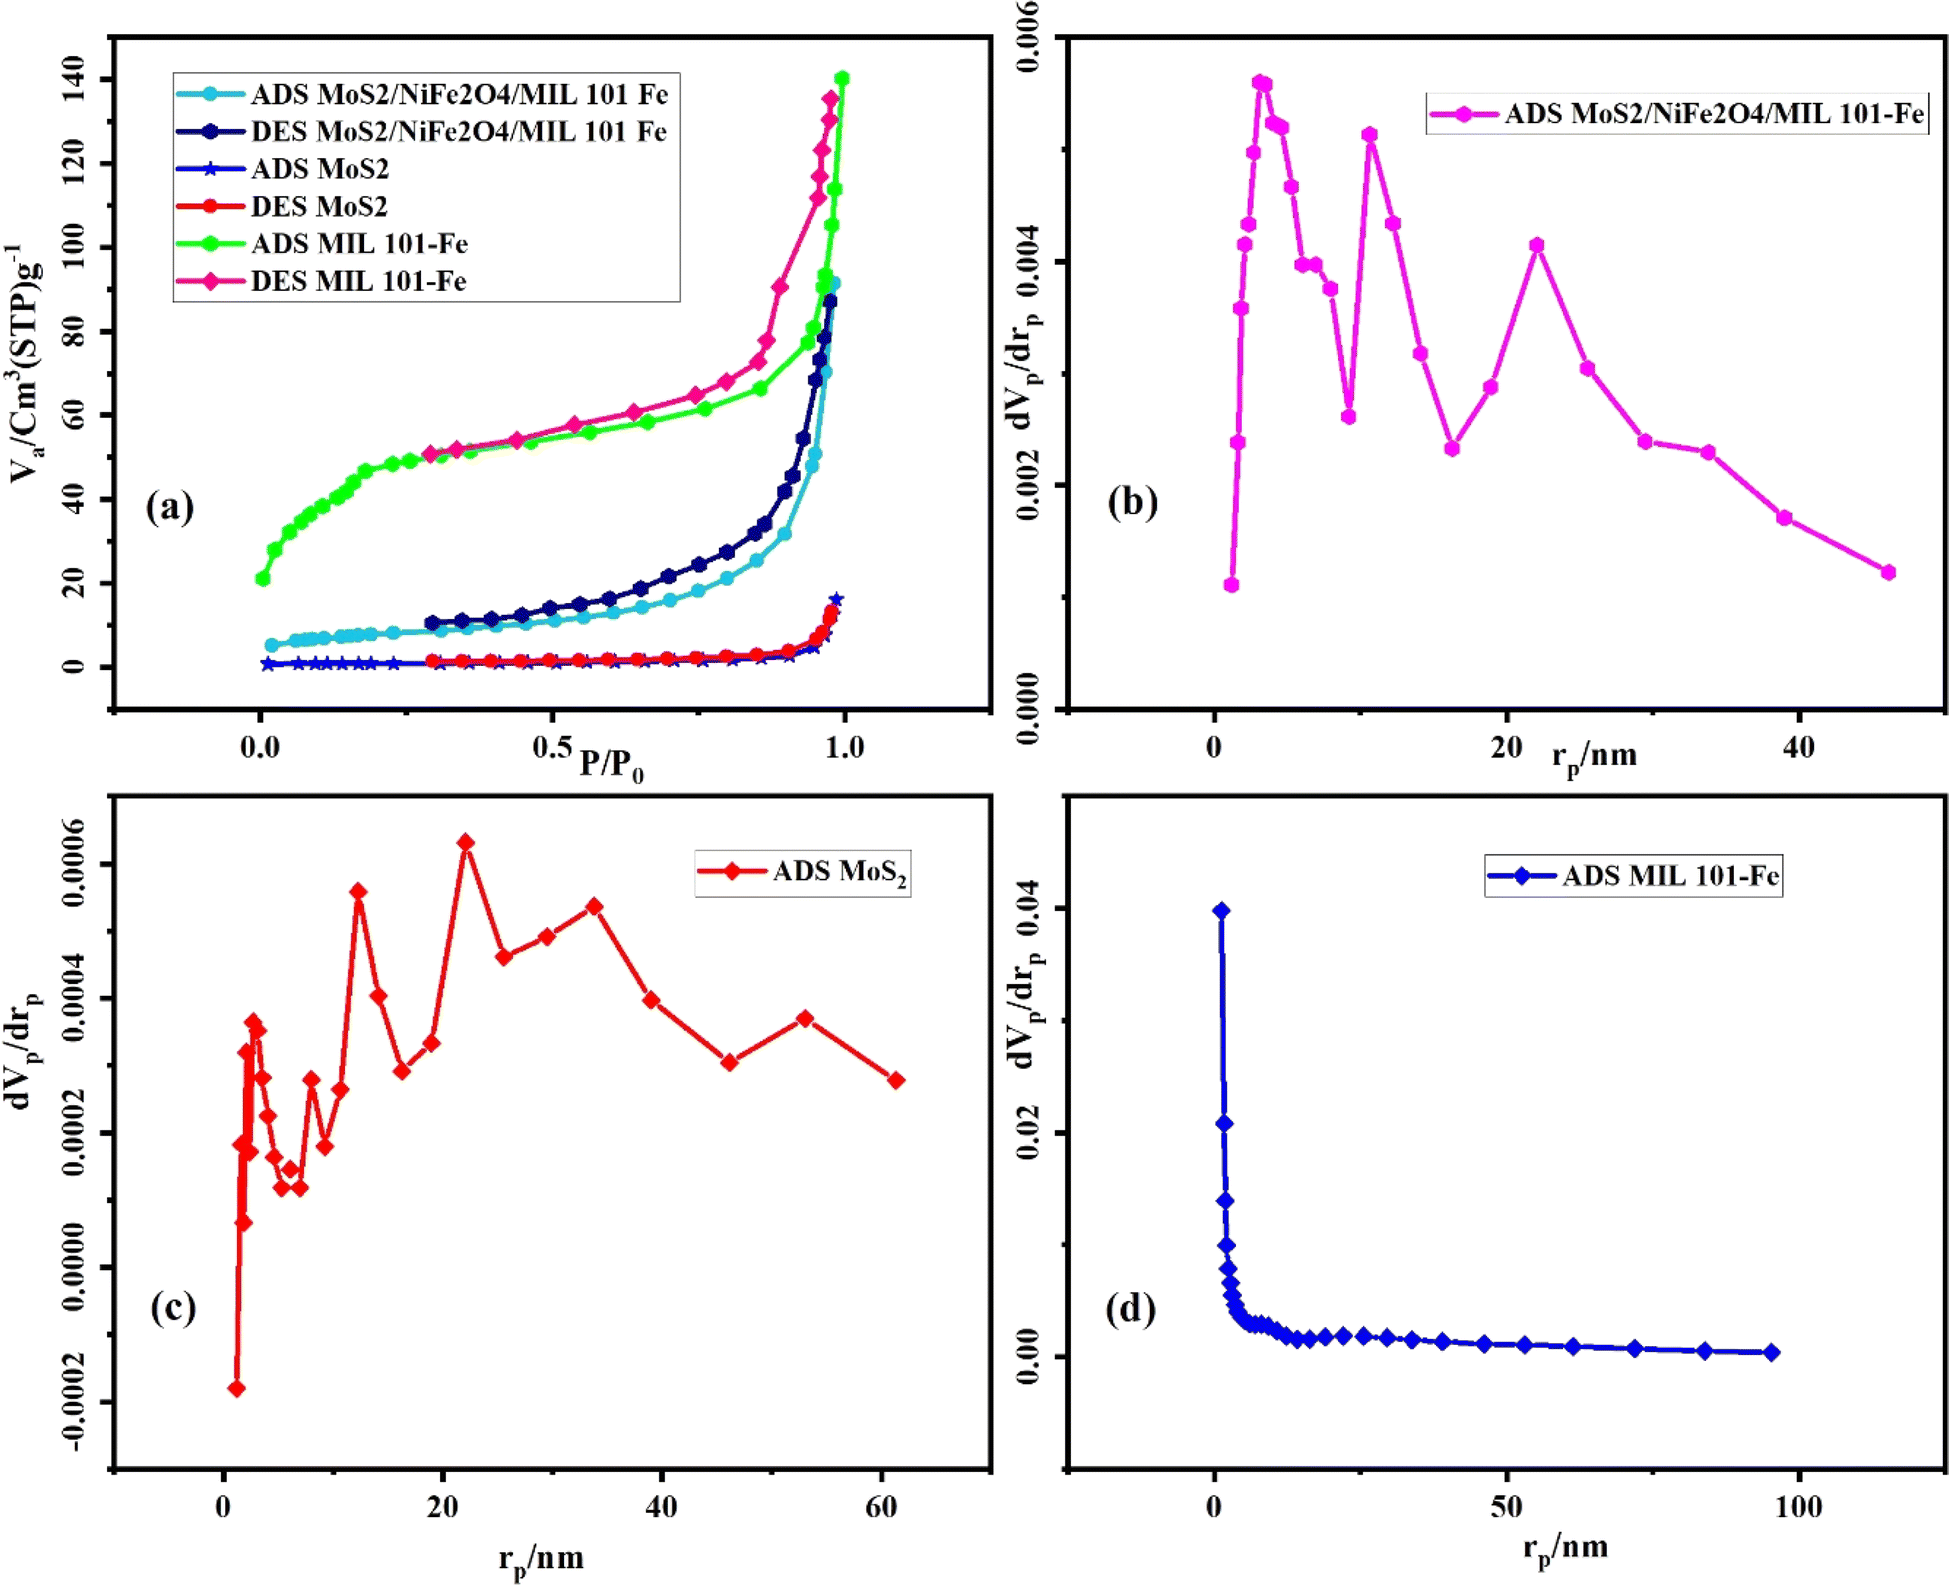
3.1.6 BET analysis. By using the data related to N2 adsorption–desorption on the MoS2/NiFe2O4/MIL-101(Fe) nanocomposite at different relative pressures, useful information such as the volume, size, and size distribution of the pores was obtained, which is shown in Fig. 7 and Table 1. According to the classification of absorption isotherms based on IUPAC, in this study, type I and IV isotherms were seen, which are related to mesoporous materials. The BET surface areas calculated from the isotherms are as follows: pure MoS2 (3.5 m2 g−1), MIL-101(Fe) (167.0 m2 g−1), and MoS2/NiFe2O4/MIL-101(Fe) (29.2 m2 g−1). The Barrett–Joyner–Halenda (BJH) model provided information on the pore size distribution using the adsorption branch of the isotherm. The MoS2/NiFe2O4/MIL-101(Fe) composite exhibits a reduced surface area and pore volume compared to pure MIL-101(Fe). These decreases may be attributed to the incorporation of MoS2, which has relatively lower BET surface area and pore volumes.
 |
| | Fig. 7 (a) N2 adsorption–desorption isotherms and (b–d) BJH pore-size distribution plots for the MoS2/NiFe2O4/MIL-101(Fe), MoS2 and MIL-101(Fe) samples. | |
Table 1 The textural properties of as-prepared samples
| Sample |
BET surface area (SBET, m2 g−1) |
Total pore volume (Vp, cm3 g−1) |
Average pore diameter (rp, nm) |
| MoS2 |
3.5 |
0.024 |
28.40 |
| MIL-101(Fe) |
167.0 |
0.198 |
4.75 |
| MoS2/NiFe2O4/MIL101(Fe) |
29.2 |
0.141 |
19.38 |
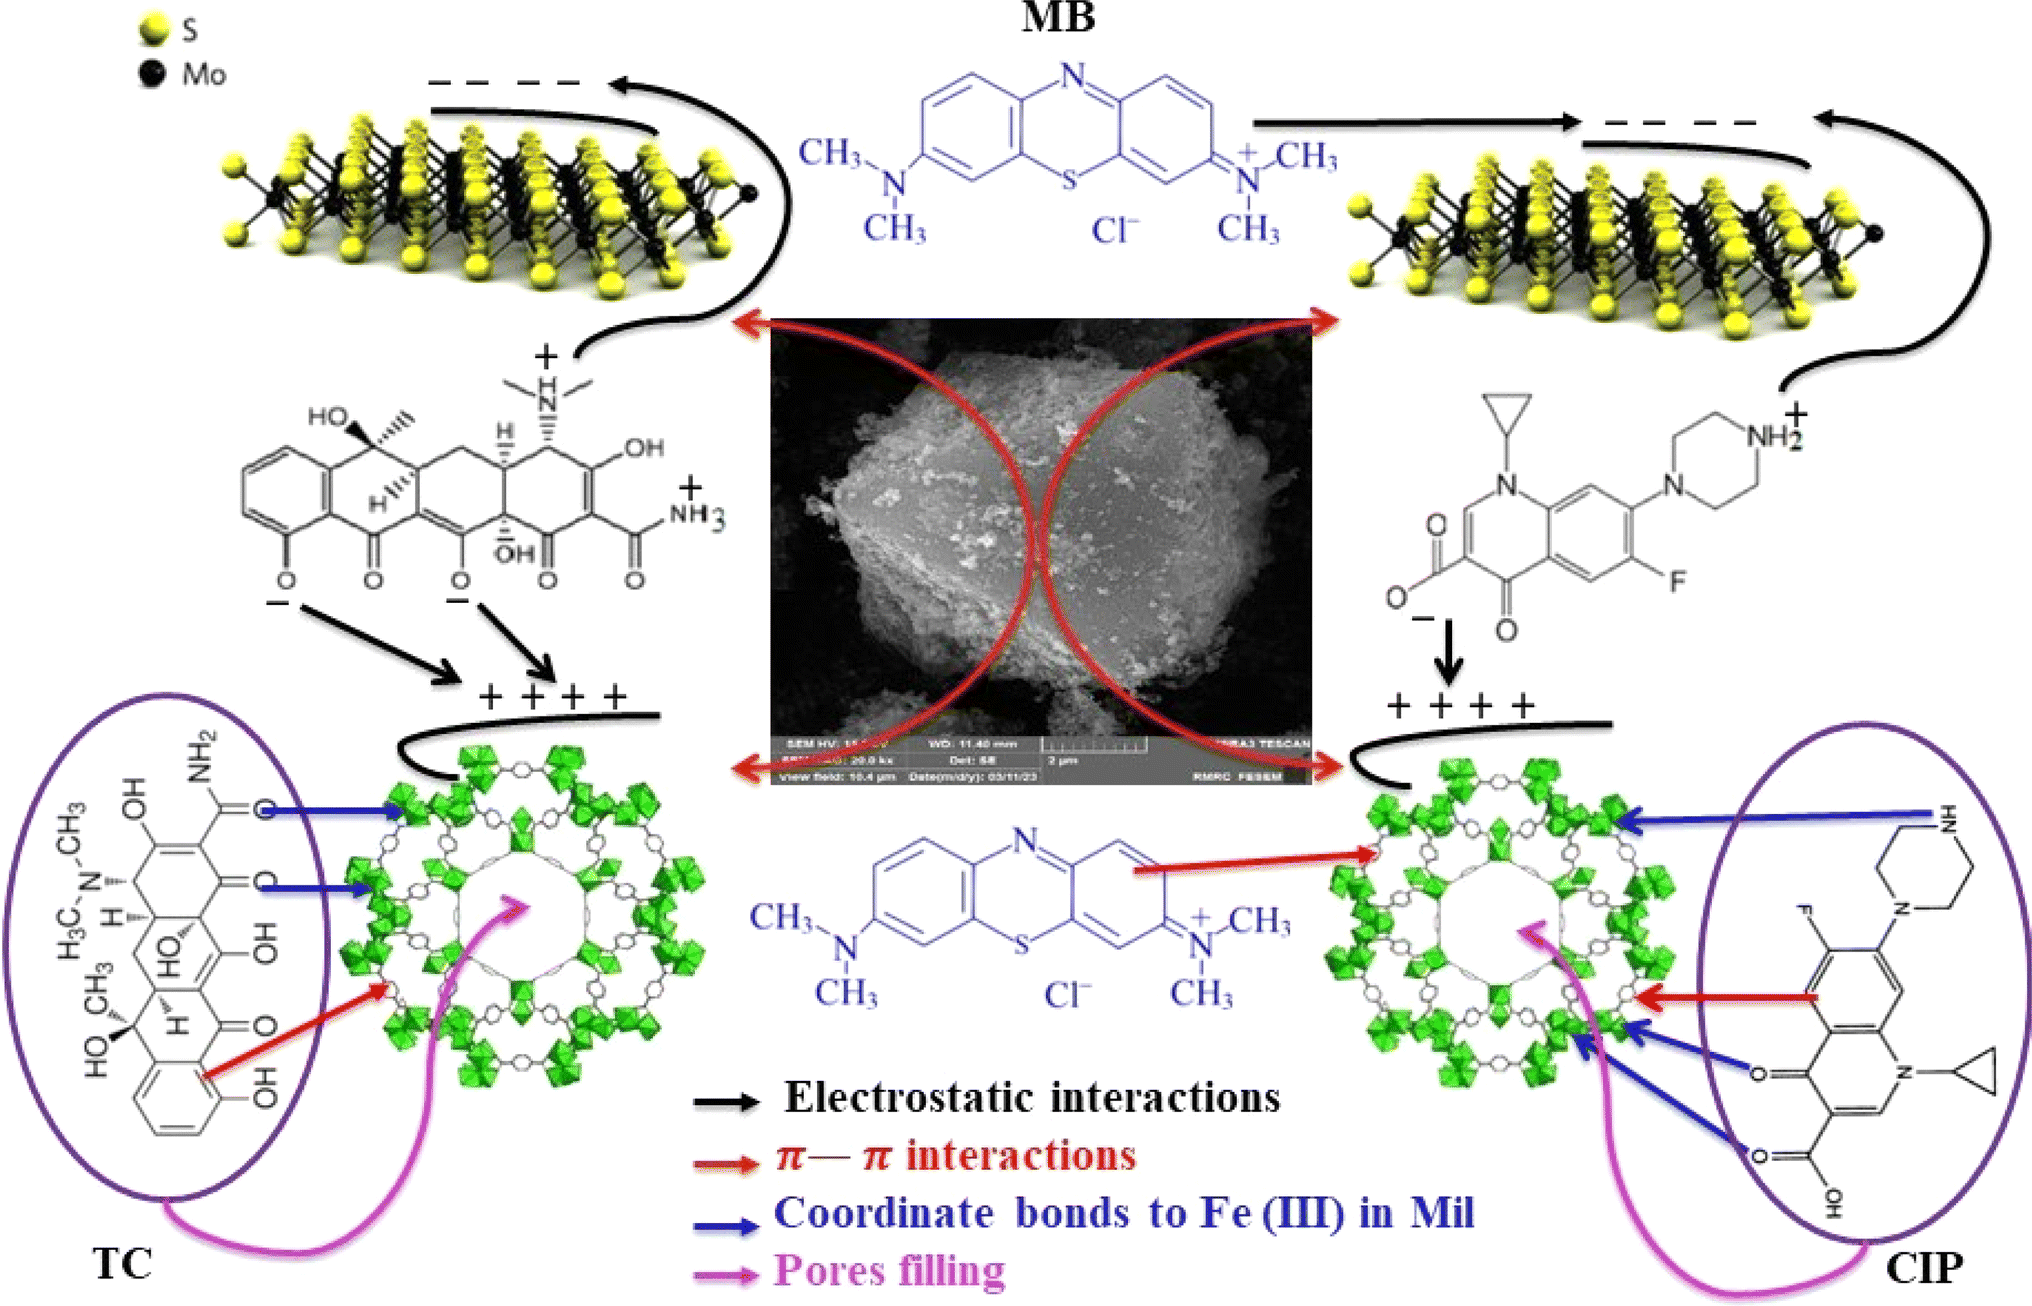
3.1.7 Zeta potential measurements. To analyse the surface potential properties of the acquired samples, the zeta potential was measured for each sample. The results can be seen in Fig. 8. The zeta potential values were measured as −47.0 mV for MoS2 and +32.4 mV for MIL-101(Fe). In contrast, the charge distribution on the surface of the MoS2/NiFe2O4/MIL-101(Fe) composite was measured to be −19.8 mV. The notable shift of zeta potential for MIL-101(Fe) from +32.4 to −19.8 mV is primarily caused by the introduction of the highly negatively charged MoS2 component into the framework of MIL-101(Fe). The increased negative charge of nanocomposite is related to the presence of MoS2 component inside the porous framework of MIL-101(Fe), making it more suitable for the selective adsorption of cationic species via electrostatic interaction in water at natural pH.
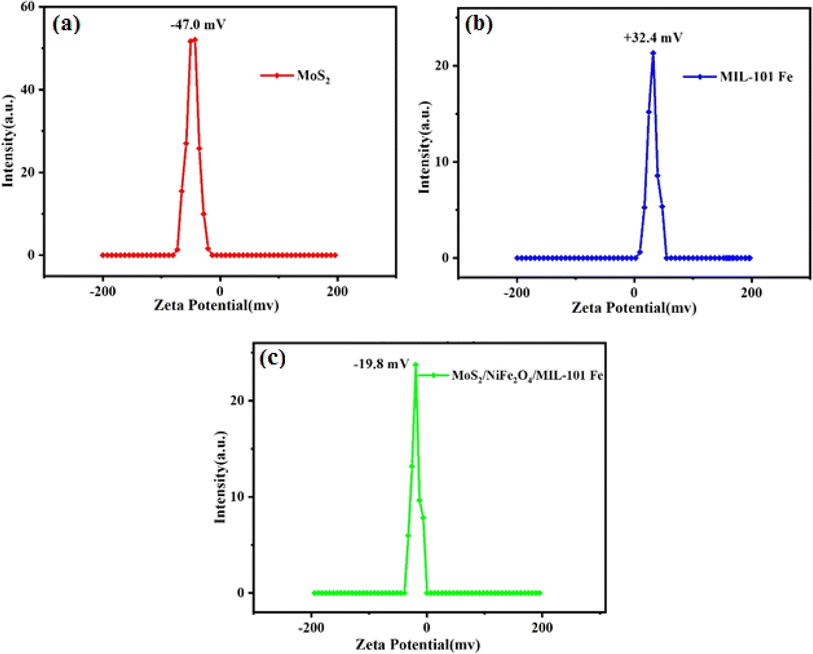 |
| | Fig. 8 Zeta potential curves of (a) MoS2, (b) MIL-101(Fe) and (c) MoS2/NiFe2O4/MIL-101(Fe). | |
3.2. Dye adsorption investigations
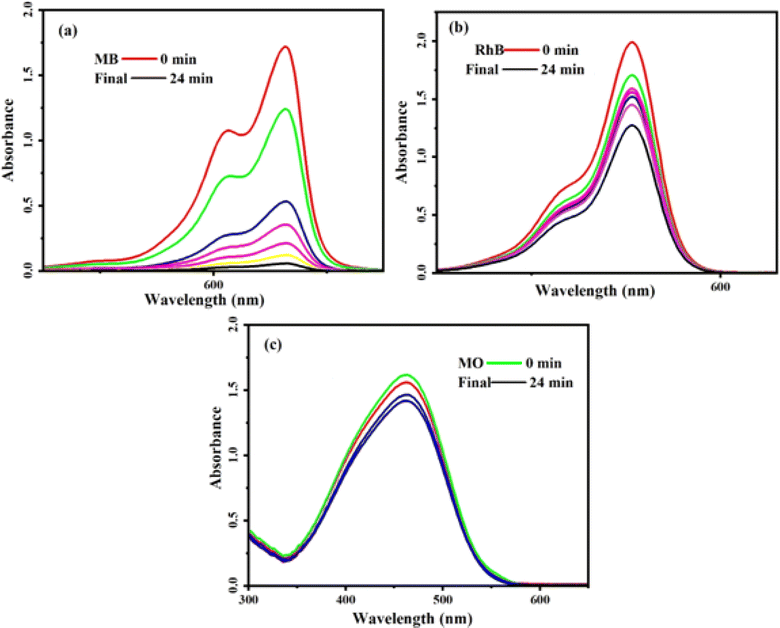
In an experimental study, we employed a novel method to assess the effectiveness of the MoS2/NiFe2O4/MIL-101(Fe) nanocomposite. Our focus was on testing this composite material's ability to remove various contaminants from water, specifically targeting compounds such as methylene blue (MB), rhodamine B (RhB), and methyl orange (MO). These compounds were chosen due to their diverse sizes and charges, providing a comprehensive evaluation of the nanocomposite's performance. UV-vis absorption spectra of MB, RhB, and MO dyes were recorded at λmax of 664, 553, and 463 nm, respectively. Fig. 9 depicts a gradual reduction in the intensity of these absorption bands, indicating a decrease in the concentration of dyes in the solution over time. The nanocomposite exhibited a high adsorption efficiency of 98% for MB within 24 minutes (Fig. 9(a)), while the removal efficiency for RhB was approximately 36% within the same timeframe (Fig. 9(b)). However, the adsorption of MO was almost negligible (Fig. 9(c)). These results suggest that the MoS2/NiFe2O4/MIL-101(Fe) magnetic nanocomposite possesses varying adsorption capacities for different organic dyes. Different dye molecules exhibit adsorption behavior that correlates with the negative charge found on the surface of the MoS2/NiFe2O4/MIL-101(Fe) magnetic adsorbent. Consequently, the magnetic nanocomposite demonstrates favorable adsorption capabilities towards cationic dyes like MB and RhB. However, the removal percentage of RhB dye is lower than that of MB, probably due to the large volume of RhB molecules causing steric hindrance with adsorption sites on the composite surface and weaker π–π interaction with MoS2/NiFe2O4/MIL-101(Fe) nanocomposite. The results show that the nanocomposite is a poor adsorbent for the removal of MO anionic dye from aqueous solutions. It can be attributed to the negative charge of this dye molecule, which repels each other between MO and the MoS2 caged in MIL-101. The slightly decreasing absorbance of MO is more likely to be adsorbed on the surface of adsorbents. The results further confirm that the electrostatic attraction is the key factor for the occurrence of adsorption.
 |
| | Fig. 9 The UV-vis spectra during adsorption of dyes over MoS2/NiFe2O4/MIL-101(Fe): (a) MB, (b) MO and (c) RhB. C0 (dye) = 25 mg L−1, V (dye) = 30 mL, adsorbent dosage = 25 mg and temp. = 25 °C. | |
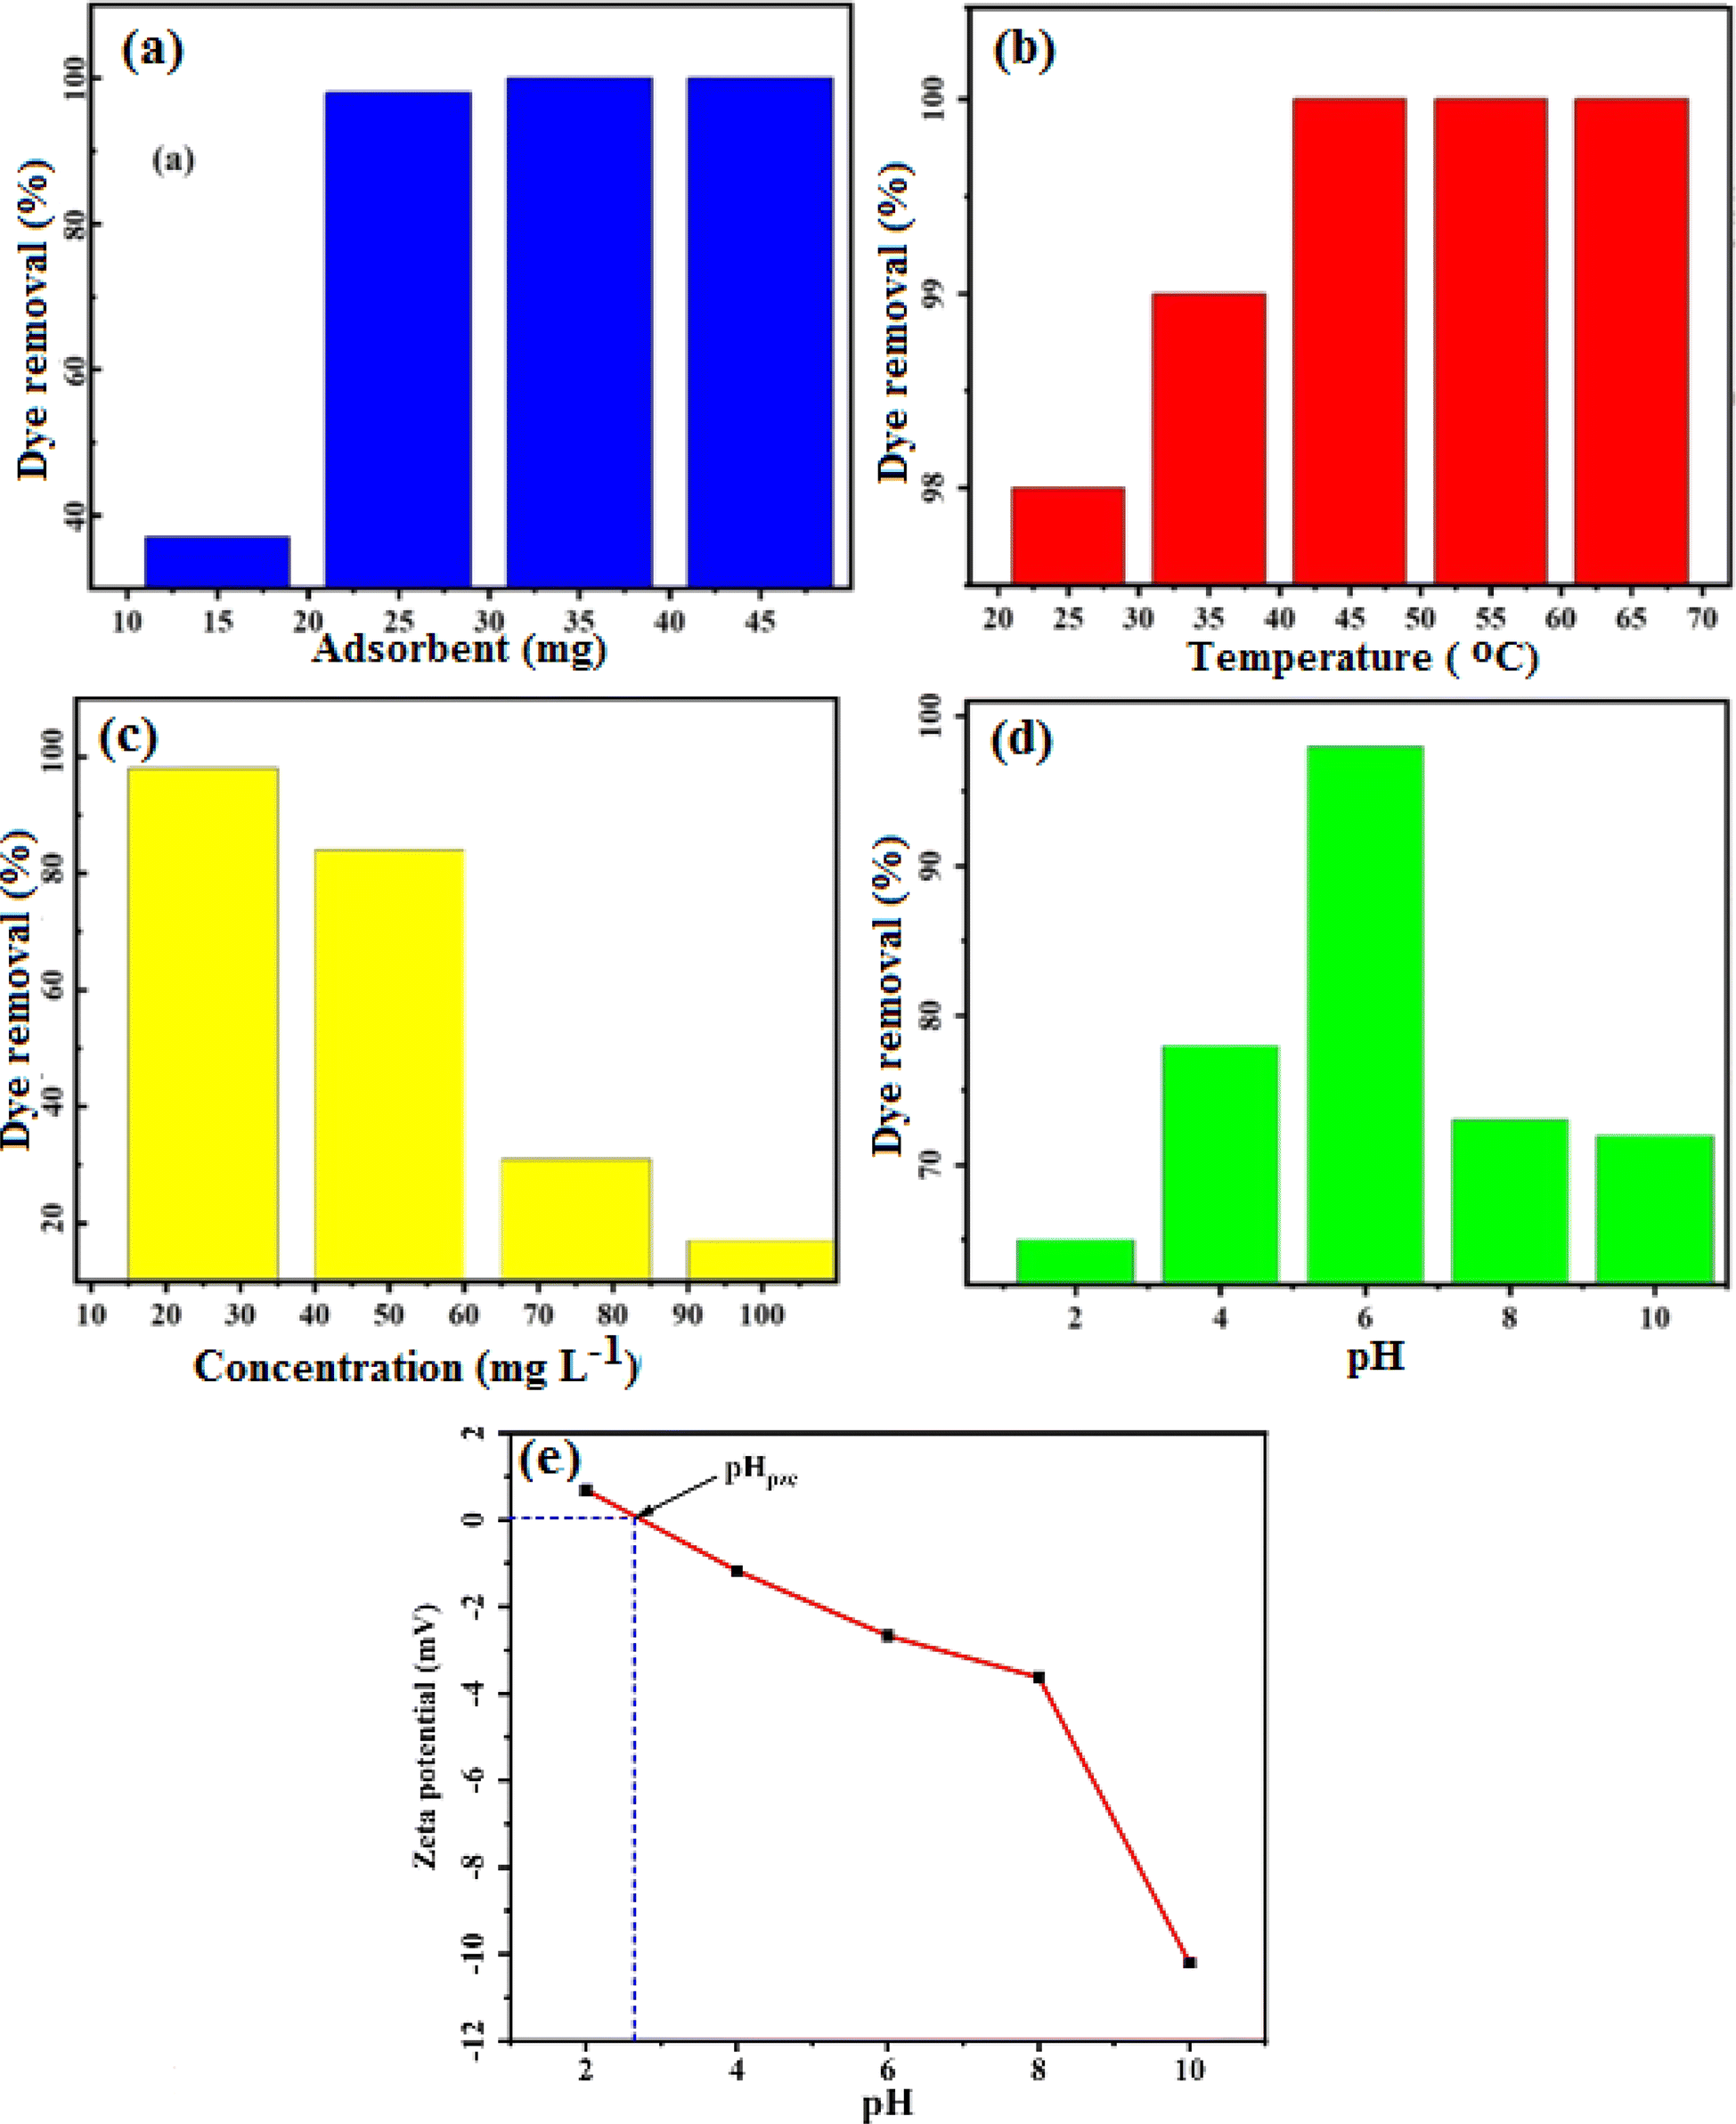
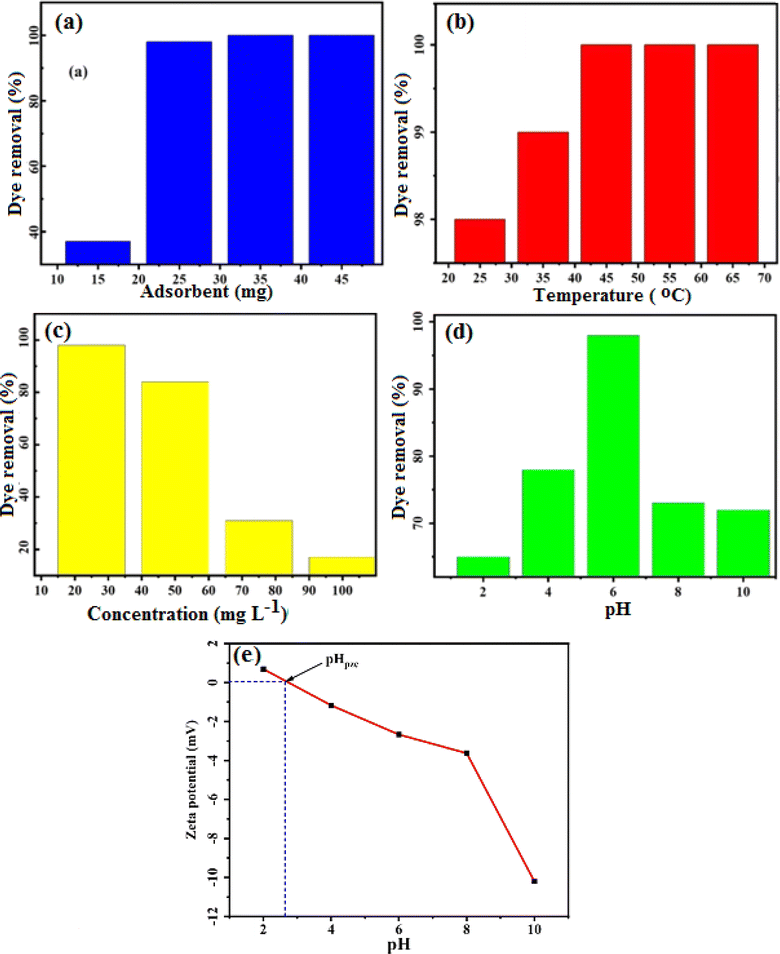
3.2.1 Effect of adsorbent dose on the dye adsorption. The amount of adsorbent used plays a crucial role in determining both the level of dye adsorption and the effectiveness of dye elimination. In Fig. 10(a), the impact of different doses of MoS2/NiFe2O4/MIL-101(Fe) on the removal of MB was investigated. Solutions with a volume of 30 mL and a dye concentration of 25 mg L−1 at natural pH (6.5–7) were used for this analysis. The adsorbent quantities tested were 15, 25 mg, 35 mg, and 45 mg. In the beginning, the efficiency of MB adsorption rises because of the larger specific surface area and abundant active adsorption sites. However, as time progresses, the vacated sites become occupied due to repulsions between the already adsorbed particles and the adsorbent particles.45 Despite this, the adsorption capacity remains relatively constant when increasing the adsorbent dose while maintaining a constant initial concentration of pollutants. The removal percentages of MB for the respective adsorbent doses of 15, 25, 35, and 45 mg were calculated to be 37, 98, 100, and 100%, respectively, within 24 minutes. In order to achieve the highest removal efficiency using the minimum amount of adsorbent, subsequent studies focused on utilizing 25 mg of MoS2/NiFe2O4/MIL-101(Fe).
 |
| | Fig. 10 Influence of (a) adsorbent amount, (b) temperature, (c) dye concentration, (d) pH on the removal of MB dye by MoS2/NiFe2O4/MIL-101(Fe), and (e) zeta potential of the MoS2/NiFe2O4/MIL-101(Fe) nanocomposite in aqueous solutions at different pHs. | |
3.2.2 Effect of temperature on the dye adsorption. In this research, we examined how temperature affects the adsorption of MB using the magnetic adsorbent MoS2/NiFe2O4/MIL-101(Fe) across a temperature range of 25 to 75 °C. The experimental conditions remained constant with 25 mg of the absorbent and a dye solution volume of 30 mL at natural pH of 6.5–7. The results are displayed in Fig. 10(b). It can be inferred from the results that the adsorption capacity increases as the temperature rises, which suggests the process is endothermic in nature. Probably due to the increase in temperature, the viscosity has decreased, which causes high mobility and faster diffusion of dye molecules on the surface and internal pores.
3.2.3 Effect of initial dye concentration on the adsorption. Fig. 10(c) shows the effect of initial dye concentration on adsorption by MoS2/NiFe2O4/MIL-101(Fe) composite. In these experiments, a range of dye concentrations were employed, including 25, 50, 75, 100, and 125 mg L−1. The specific conditions included an MB concentration of 25 mg L−1, pH 6.5–7, and a dye solution volume of 30 mL. With an increase in the initial dye concentration, there was a corresponding decrease in the efficiency of dye elimination. This can be attributed to the fact that the active sites on the adsorbent saturated quickly in higher dye concentration. Consequently, an optimum concentration of 25 mg L−1 was selected for MB in order to achieve maximum dye removal.
3.2.4 Effect of pH on the dye adsorption. The impact of varying pH levels ranging from 2 to 10 on the adsorption process of MB was investigated. Throughout the experiment, we maintained a consistent initial dye concentration of 25 mg L−1 and a temperature of 25 °C. The solution pH was adjusted with HCl or NaOH. As depicted in Fig. 10(d), the nanocomposite exhibited varying adsorption rates for MB at different pH values. The highest dye absorption, reaching 98%, occurred at about natural pH (6.5–7). Conversely, the absorption percentages at pH 2, 4, 8, and 10 were found to be approximately 67, 81, 78, and 75%, respectively. As a result, at a natural pH (6.5–7), the electrostatic attraction between the nanocomposite and the MB dye is much stronger than at acidic and basic pHs. A cationic dye produces positively charged ions when dissolved in water. Hence, at lower pH levels, the hydrogen ion competes with the cationic MB species for adsorption onto the nanocomposite. With a higher concentration of H+ ions on the absorbent surface, the adsorption of the MB cationic dye is prevented. Also, according to Fig. 10(e), the results obtained from the zeta potential of the composite show that the zeta potential of the composite is positive blow pH = 2.75, which can create electrostatic repulsion and prevent dye adsorption in acidic media. At pH higher than 2.75, the zeta potential of the nanocomposite is negative and the electrostatic attraction between the nanocomposite and the MB dye is much stronger than at stronger acidic/basic pHs. Alternatively, in higher pH conditions, the high concentration of OH− ions in the dye solution compete with the nanocomposite for the reaction with cationic MB, inhibiting the adsorption of MB dye.
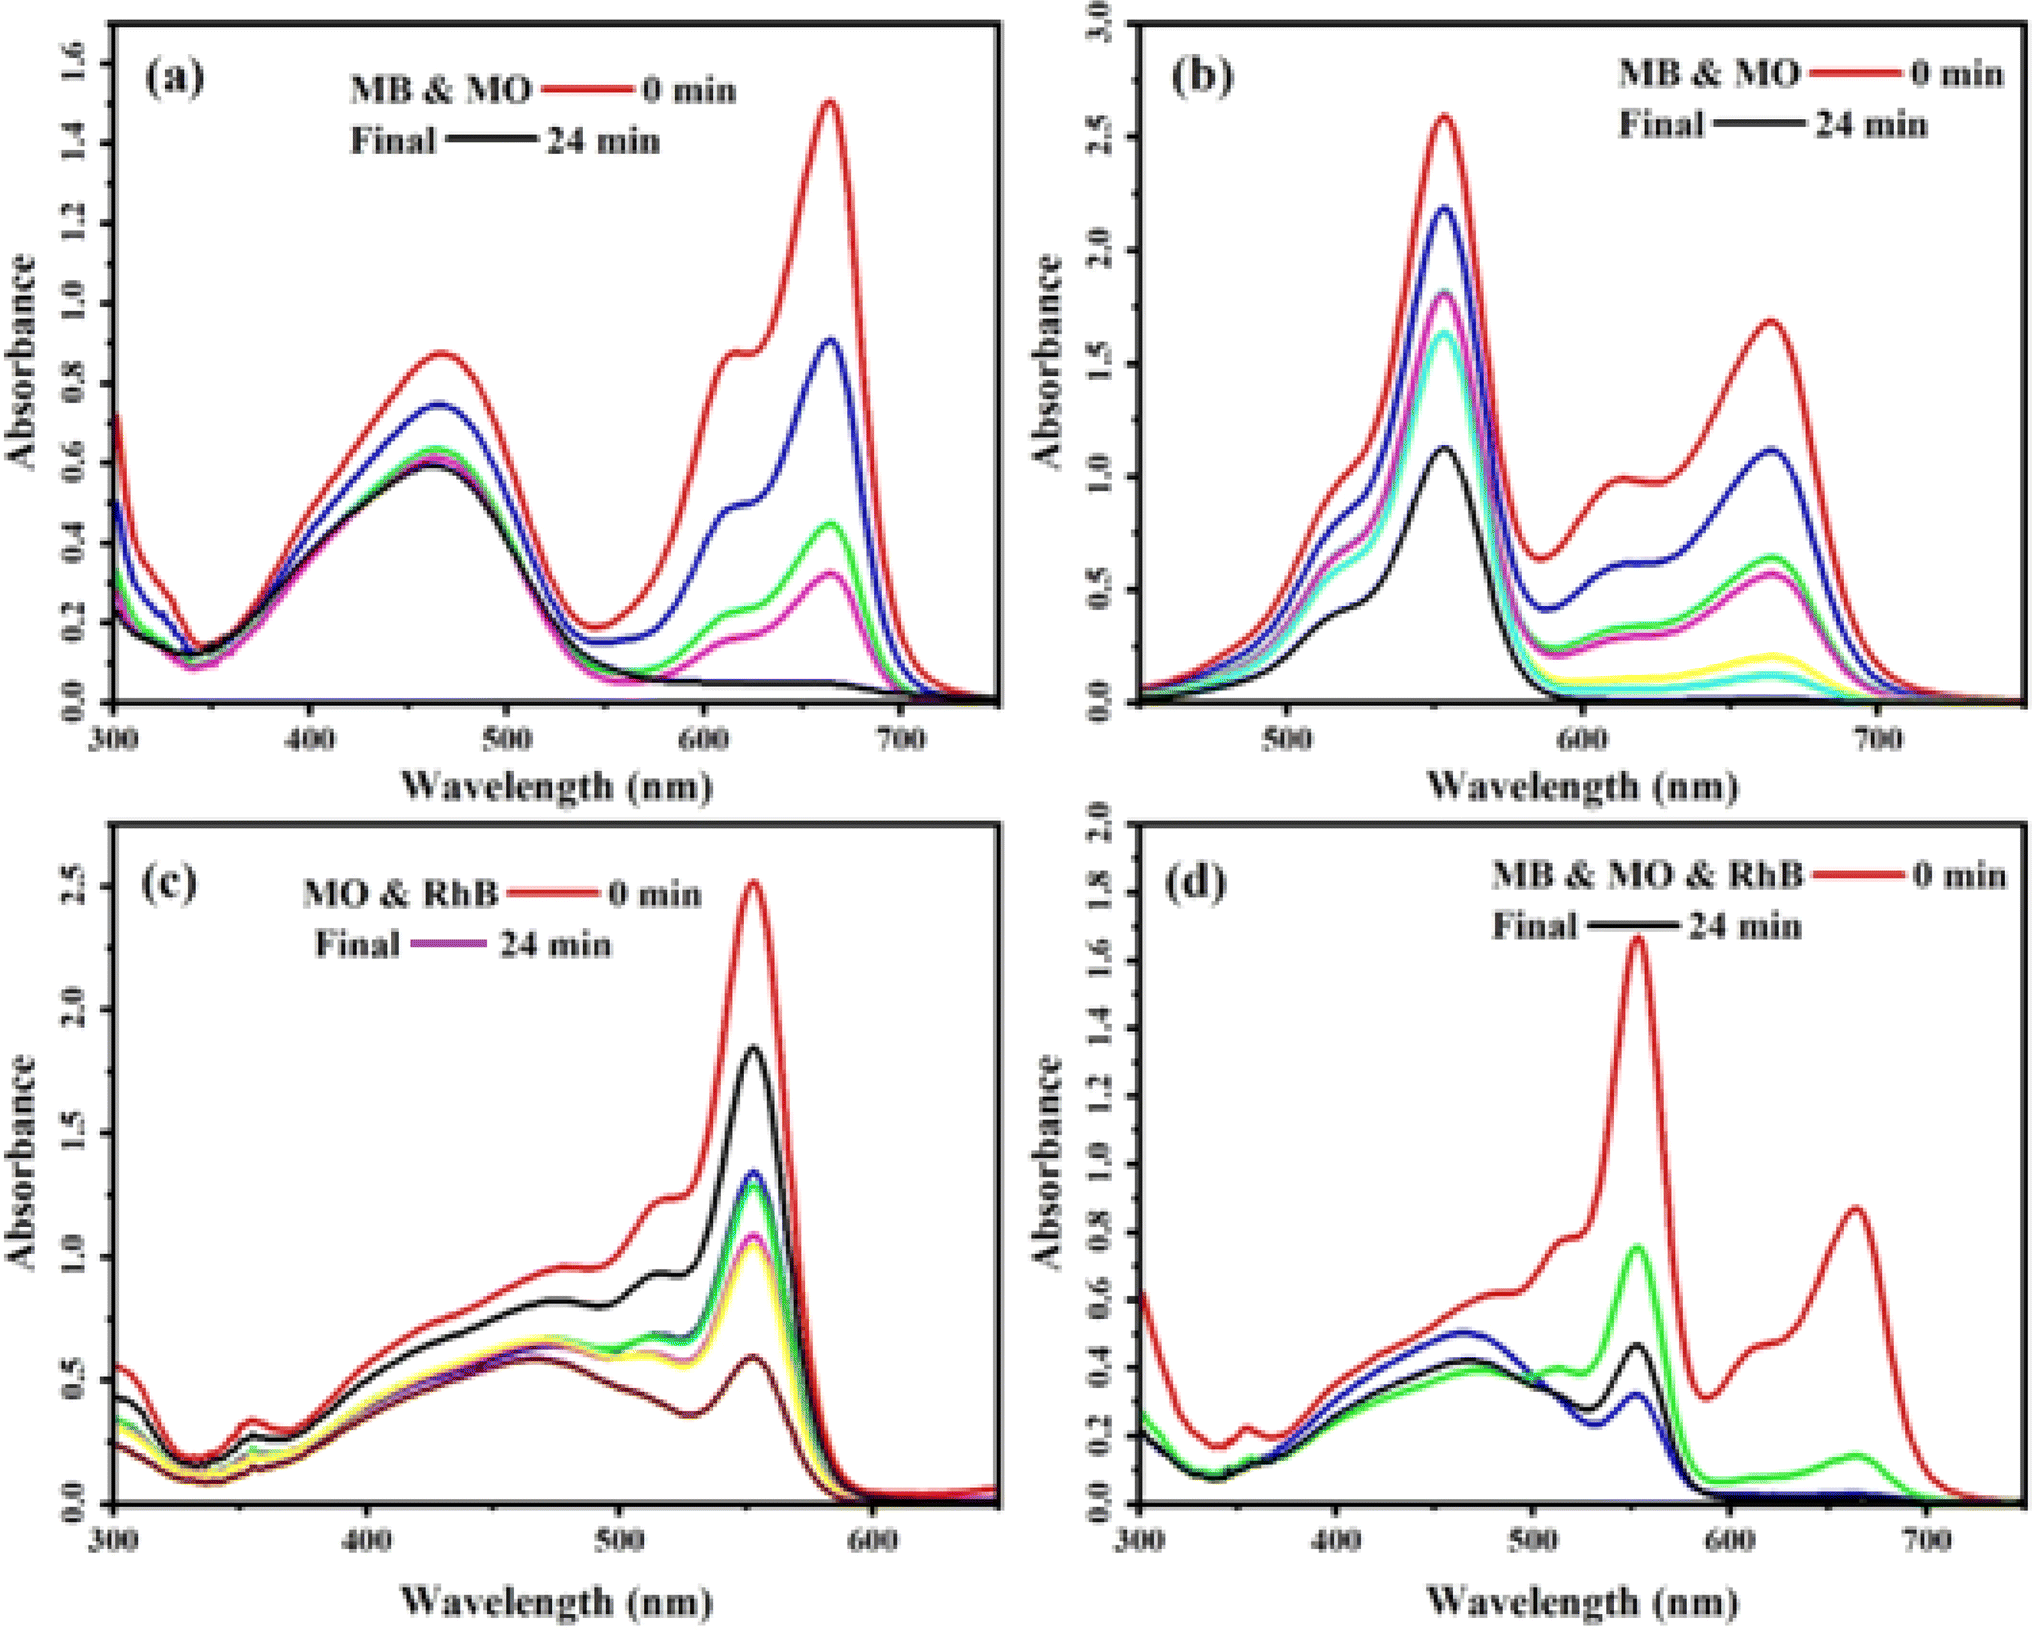
3.2.5 Selective dye adsorption. The selective absorption and separation of specific dyes in the dye and wastewater treatment process is highly desirable. In this study, we investigated the selective adsorption capabilities of a nanocomposite material comprising MoS2/NiFe2O4/MIL-101(Fe). To assess its performance, combinations of MB, RhB, and MO dye solutions were selected. The results in Fig. 11(a)–(d) show that both RhB and MB dyes are adsorbed within 24 minutes, but complete adsorption of RhB needs a longer time. It is worth mentioning that the larger molecular structure of the RhB dye leads to a prolonged removal process compared to the MB dye. Interestingly, the characteristic peak of MO decreased slightly throughout the process. The results provide evidence of the nanocomposite's ability to selectively adsorb cationic dyes present in wastewater. Various factors can influence the adsorption mechanism of dye molecules onto the adsorbent employed in an aqueous environment. These factors include the properties of the adsorbent, the nature of the dye, intermolecular hydrogen interaction, electrostatic interaction, π–π bonds, and ion exchange.46 Initially, MIL-101 (Fe) exhibited limited effectiveness in removing cationic MB and RhB from the solution. However, the presence of MoS2 in the nanocomposite significantly enhanced the removal efficiency. The increase in efficiency can be attributed to the electrostatic attraction between the negative charge of MoS2 and the cationic MB and RhB molecules, leading to their effective removal. Fig. 8 showcased the zeta potential data, which corroborated that MoS2 was the main influencing factor. The incorporation of MoS2 nanosheets into the MoS2/NiFe2O4MIL-101(Fe) nanocomposite further enhanced its adsorption ability for cationic MB and RhB. The reduced adsorption of RhB dye in comparison to MB could be due to the larger volume of RhB molecules, leading to steric hindrance at the adsorption sites and weak π–π interactions. To remove this dye completely, a higher amount of nanocomposite would be required. On the other hand, the nanocomposite strongly rejects anionic MO dye.
 |
| | Fig. 11 The selective adsorption capacity of the MoS2/NiFe2O4/MIL-101(Fe) toward the mixed dyes of (a) MB + MO, (b) MB + RhB, (c) MO + RhB, and (d) MB + MO + RhB. C0(MB) = C0(RhB) = C0(MO) = 25 mg L−1, and adsorbent dose = 25 mg in 30 mL, at 25 °C. | |
3.3. Drug adsorption investigations
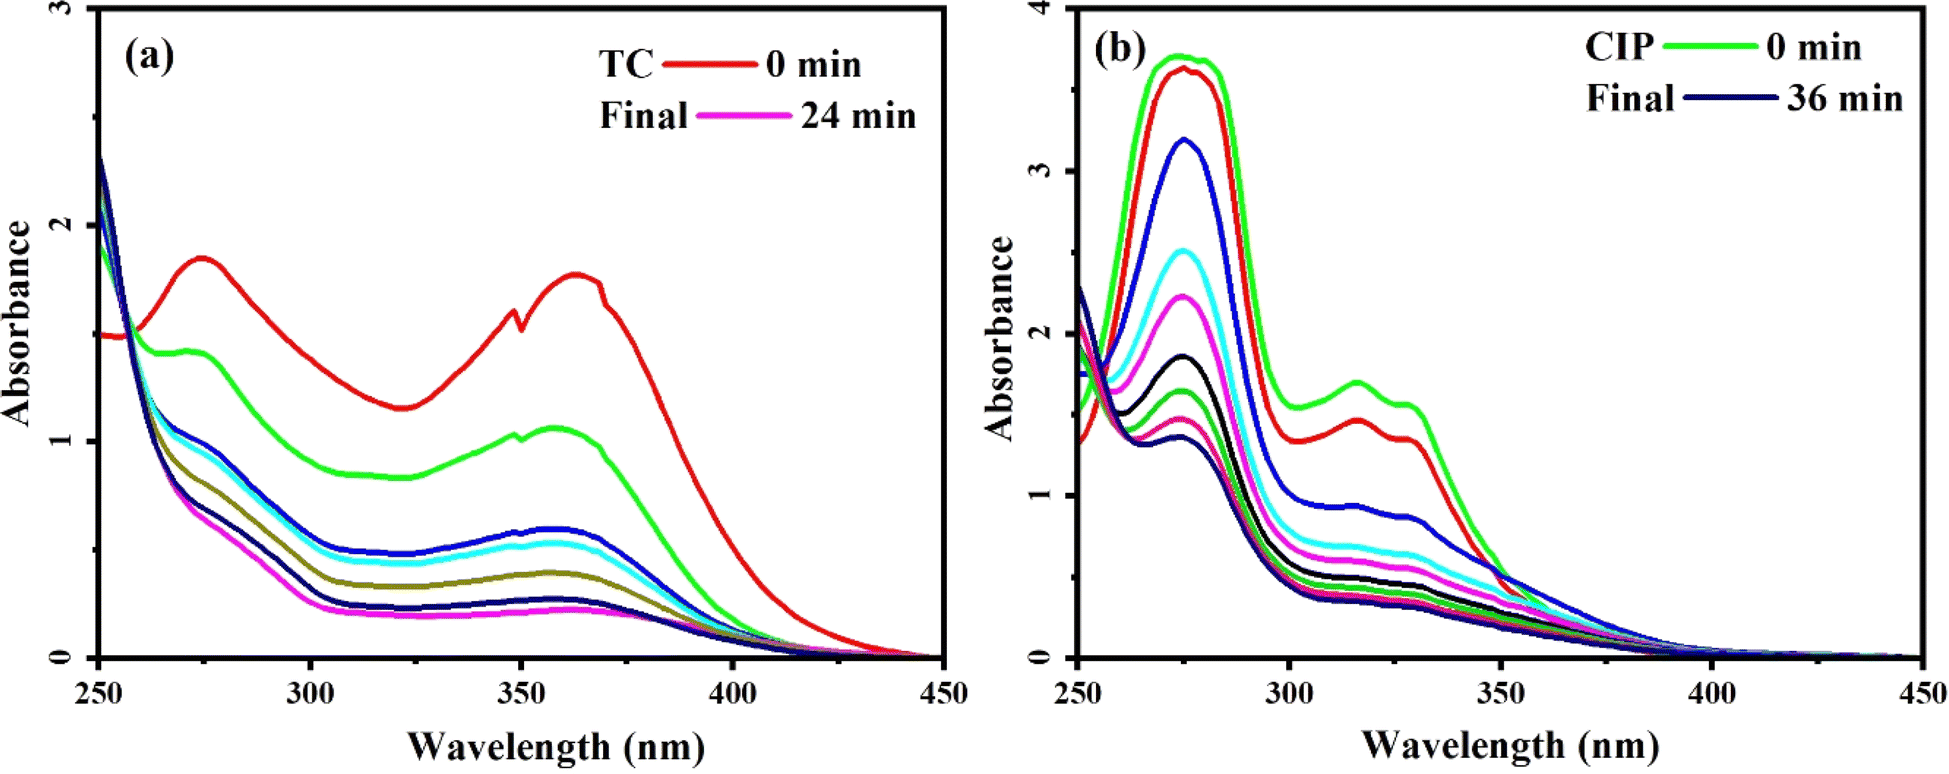
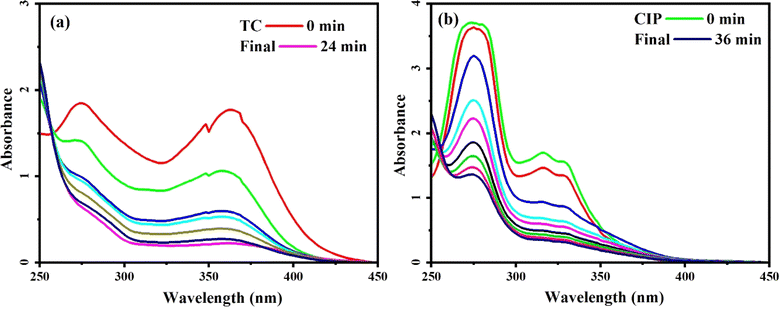
For the experimental analysis, TC and CIP were chosen as the specific antibiotics to assess the effectiveness of the MoS2/NiFe2O4/MIL-101(Fe) nanocomposite in removing antibiotics from water contaminated with pollutants. The UV-vis absorption studies were conducted to determine the concentrations of TC and CIP. TC showed a maximum wavelength (λmax) of 373 nm, while CIP exhibited a λmax of 337 nm. As depicted in Fig. 12, the absorption bands gradually declined over time, signifying a decrease in the drug concentration in the solution. After 24 minutes, the adsorption efficiency for TC reached approximately 95%, while CIP achieved an adsorption efficiency of around 90% after 36 minutes.
 |
| | Fig. 12 UV-vis spectral changes of drugs aqueous solutions with MoS2/NiFe2O4/MIL-101(Fe) at different time intervals: (a) TC and (b) CIP. Conditions: C0(drug) = 75 mg L−1 for TC and 50 mg L−1 for CIP, V(drug) = 50 mL, adsorbent dose = 25 mg at 25 °C. | |
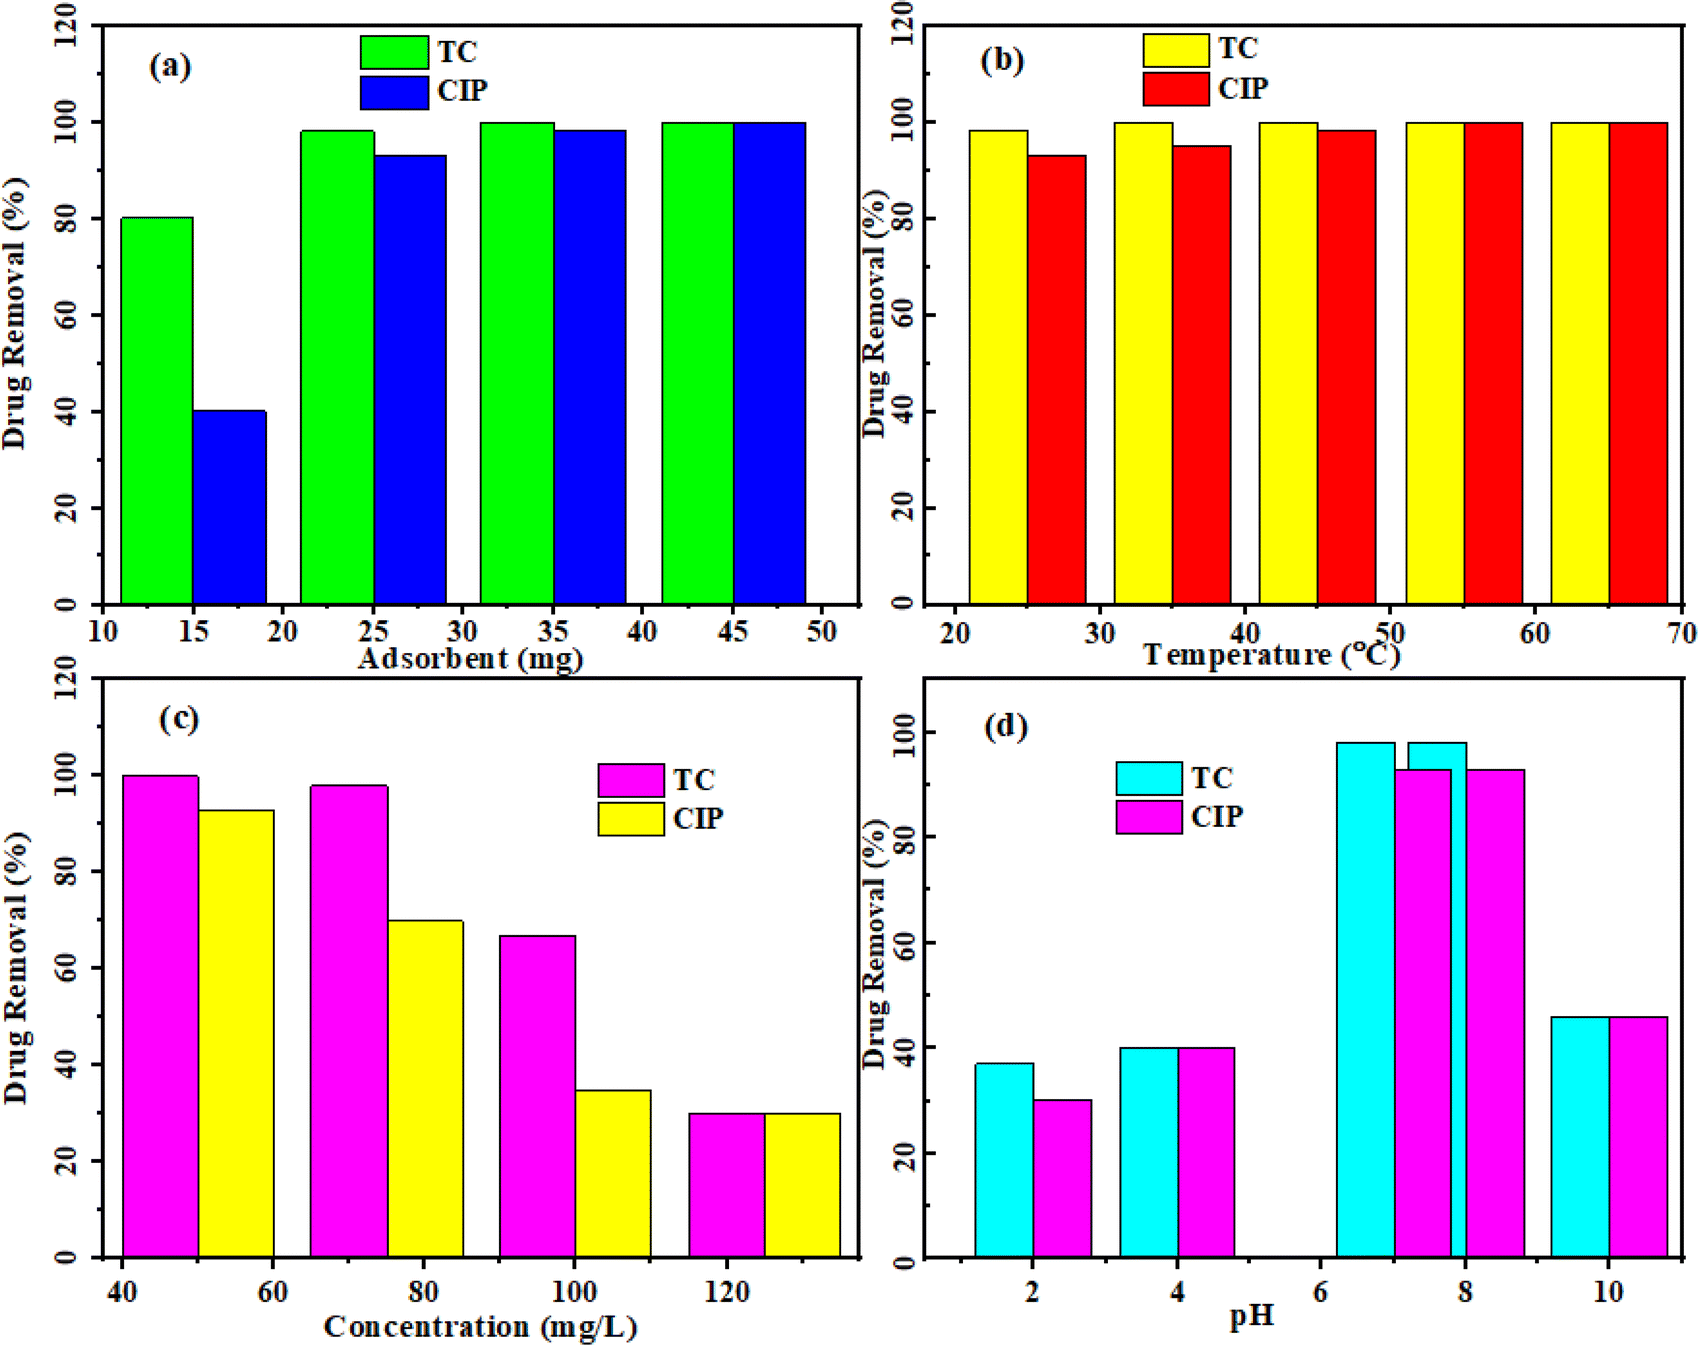
3.3.1 Effect of adsorbent dose on the antibiotic adsorption. The study investigated the influence of different amounts (15, 25, 35, and 45 mg) of MoS2/NiFe2O4/MIL-101(Fe) adsorbent on the removal of TC and CIP from a 50 mL drug solution. The initial concentration of TC was 50 mg L−1, while CIP had an initial concentration of 75 mg L−1, both at pH 6.5–7. According to Fig. 13(a), it can be observed that as the dosage of the adsorbent increases, there is a corresponding increase in the removal of the drugs. More adsorption sites being available could be the reason for this.47
 |
| | Fig. 13 Influence of (a) adsorbent amount, (b) temperature, (c) concentration, and (d) pH on the removal of TC and CIP drugs by the MoS2/NiFe2O4/MIL-101(Fe) nanocomposite. | |
3.3.2 Effect of temperature on the antibiotic adsorption. The influence of different temperatures (25, 35, 45, 55, and 65 °C) on the removal efficiency of TC and CIP drugs from aqueous solutions was studied using MoS2/NiFe2O4/MIL-101(Fe). The experimental conditions were maintained constant by utilizing 25 mg of adsorbent, a drug solution volume of 50 mL, a temperature of 25 °C, and a pH 6.5–7. The findings, depicted in Fig. 13(b), demonstrate that elevated temperatures increase the absorption rate, implying an endothermic adsorption process. The increase in temperature may lead to an increase in the diffusion rate of antibiotic molecules on the absorbent surface and occupy all the active sites of the absorbent surface.
3.3.3 Effect of initial antibiotic concentration on the adsorption. The effect of the various concentrations (25, 50, 75, 100, and 125 mg L−1) of TC and CIP drugs on the adsorption efficiency of MoS2/NiFe2O4/MIL-101(Fe) adsorbent under the constant conditions of 50 mg L−1 absorbent, natural pH of 6.5–7, and 25 °C is shown in Fig. 13(c). As the initial drug concentration rises, there is a decline in drug removal. The decline observed can be attributed to a decrease in the number of active sites accessible for the adsorption, concomitant with the elevation in drug concentration. As the initial drug concentration rises, there is a decline in drug removal. The decline observed can be ascribed to a decrease in the number of active sites accessible for adsorption, concomitant with the elevation in drug concentration.
3.3.4 Effect of pH on the antibiotic adsorption. Changes in pH levels can affect the adsorbent composition, charge distribution, and differentiation of drug functional groups.48 Within the pH range of 2 to 10, Fig. 13(d) presents the effect of pH on the removal of TC and CIP with initial concentrations of 75 mg L−1 for TC and 50 mg L−1 for CIP. The study involved investigating acidic conditions at pH levels of 2 and 4, as well as exploring alkaline conditions at pH levels of 8 and 10. At pH levels of 7 and 8, the greatest adsorption capacity for TC and CIP drugs was observed. The TC molecule displays the pKa values of 3.3, 7.7 and 9.7, indicating its ionization behavior at different pH levels. When the pH is below 3.3, TC adopts a cationic form known as TC+. Between pH 3.3 and 7.7, it is zwitterionic (TC±), while at pH levels of obove 7.7 and 9.7, it transforms to anionic TC−/TC−2 species. Likewise, the CIP molecule demonstrates two pKa values, namely 6.1 and 8.7. At pH levels below 6.1, CIP has cationic form. Between pH 6.1 and 8.7, it is zwitterionic (CIP±), and above pH 8.7, it becomes anionic CIP−/CIP−2. The solubility of TC and CIP is higher in acidic conditions, indicating lower drug absorption at pH 2. Conversely, when the pH exceeds 8, electrostatic repulsion occurs between the antibiotics and adsorbent, owing to their similar charges. This repulsive force acts as a barrier to the adsorption of drugs by the adsorbent. Consequently, the MoS2/NiFe2O4/MIL-101(Fe) shows the maximum adsorption for TC and CIP drugs in their zwitterionic forms (TC± and CIP±).
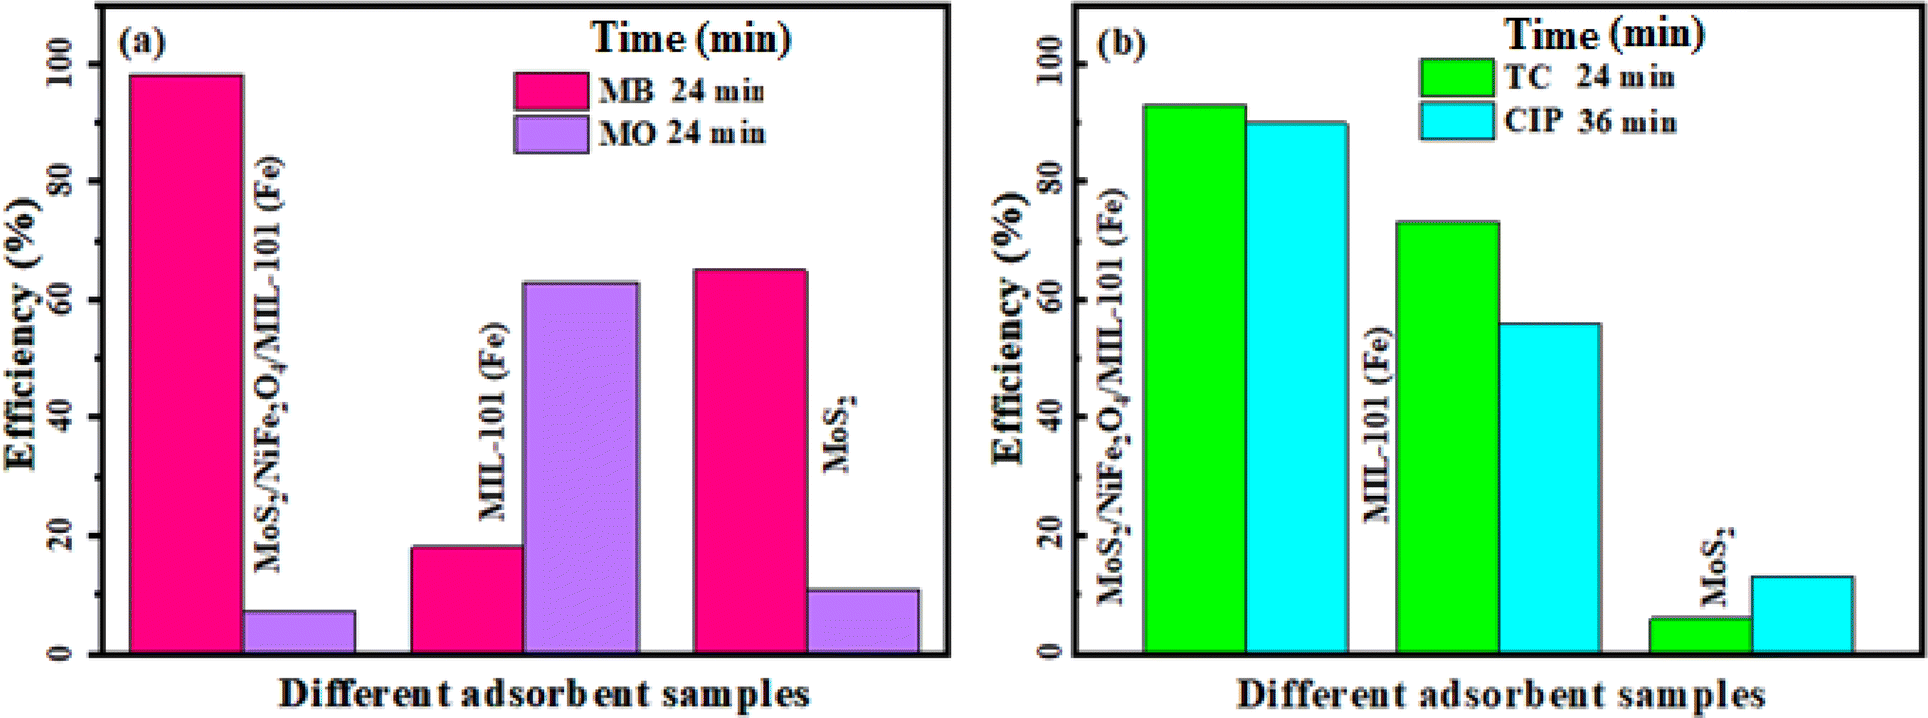
3.4. Adsorption efficiency of the nanocomposite components
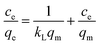
To further demonstrate the role of MoS2 in the composite material, the adsorption efficiency of MIL-101(Fe) and MoS2 components for removing the different types of organic pollutants involving MB, MO, TC, and CIP from aqueous solutions at natural pH of 6.5–7 were investigated under the optimum reaction conditions. The UV-vis spectra of aqueous solutions of these pollutants in the presence of MIL-101(Fe) and MoS2 as adsorbents are shown in Fig. 1S and 2S.† The results summarized in Fig. 14(a) and (b) indicate that the MIL-101(Fe) and MoS2 components have lower removal efficiencies for the removal of different pollutants compared to the nanocomposite. As shown in Fig. 14(a), the removal rate of the individual MIL-101 was separately up to 18% for cationic dyes MB, and 63% for anionic dye MO within 24 min. The reason for this phenomenon is that the framework of the MIL-101 is cationic with highly positive charge, as confirmed by zeta potential measurement (see Fig. 8). Nevertheless, the adsorption efficiency of MoS2 with high negative zeta potential (see Fig. 8) was respectively able to reach 68% for cationic dyes MB, and 10% for anionic dye MO in the initial 24 min. Thus, as shown in Fig. 14(b) individual MIL-101 represented high adsorption capacity of 74% and 56% for TC and CIP drugs, respectively, whereas pure MoS2 exhibited poor adsorption capacity for these drugs (less than 10%) probably due to highly aggregation of pure MoS2 nanosheets that limited number of active sites. Especially, MIL-101 displayed higher adsorption capacity for TC, which is because of its smaller volume and more functional groups than CIP. Amazingly, after the introduction of MoS2 into the cavity of MIL-101, the adsorption capacity of nanocomposite has changed a lot comparing with those of the isolated MIL-101MOF and pure MoS2 nanosheets (Fig. 14(a) and (b)). This is probably because that MoS2 nanosheets can be readily dispersed onto the surface of MIL-101 framework, leading to more active sites for the adsorption process. So, the MoS2 functionalized MIL-101 frameworks could be selected and used as the active adsorbent for removing different pollutants. Then, the MoS2/NiFe2O4/MIL-101(Fe) nanocomposite material is an environmental friendly adsorbent for removing cationic organic pollutants after the introduction of MoS2.
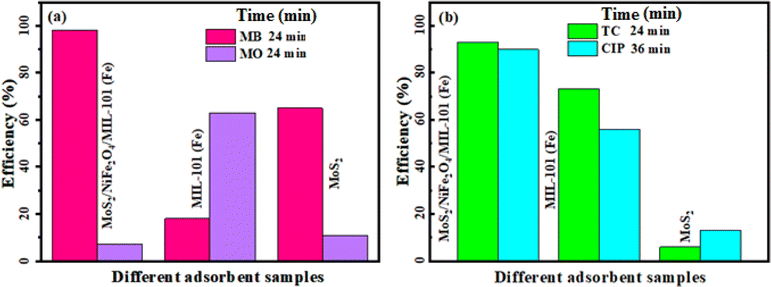 |
| | Fig. 14 Comparison of removal efficiency of the nanocomposite with its components for (a) MB and MO dyes, and (b) TC and CIP drugs. Conditions: C0(MB,MO) = 50 mg L−1, V(MB,MO) = 30 mL and C0(TC) = 75 mg L−1 and V(TC) = 50 mL and C0(CIP) = 50 mg L−1, V(CIP) = 50 mL, adsorbent dose = 25 mg at 25 °C. | |
3.5. Adsorption kinetics and adsorption isotherm
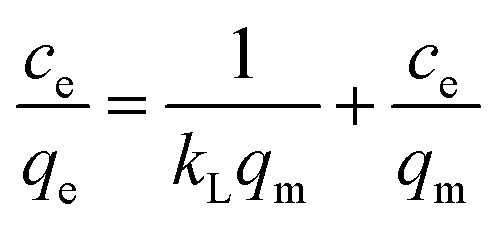
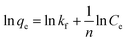
By studying the adsorption isotherm, scientists can understand the equilibrium behavior of the adsorption process under different conditions. Two commonly used models to study adsorption isotherms are the Langmuir and Freundlich models. For adsorption on a uniform surface, the Langmuir isotherm is a suitable model for monolayer adsorption, assuming that the interactions between the adsorbed species are minimal. On the other hand, the Freundlich isotherm is established by the adsorption of non-uniform layers on a heterogeneous surface. The adsorption isotherm equation allows us to mathematically model and predict the adsorption behavior under different operating conditions. The following equation represents the linear expression of the Langmuir isotherm (eqn (3)):49| |
 | (3) |
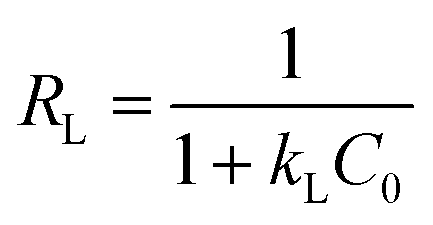
The value of Ce (mg L−1) corresponds to the concentration of dye or drug at equilibrium. In equations and models, the Langmuir adsorption constant is often denoted as kL. The equilibrium concentration corresponds to qe, which signifies the amount of dye or drug adsorbed per gram of adsorbent (mg g−1). qm (mg g−1) represents the maximum adsorption capacity achievable. An important characteristic of the Langmuir isotherm is the separation coefficient RL, which indicates the level of desirability for adsorption onto an adsorbent. It is possible to determine it by employing the following equation (eqn (4)):50| |
 | (4) |
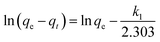
C0 represents the starting level of pollutant concentration. The RL factor provides information on the linearity (RL = 1), irreversibility (RL = 0), favorability (0 < RL< 1), or unfavourability (RL> 1 or RL< 0) of the isotherm.51 The following expression represents the Freundlich adsorption isotherm model (eqn (5)):52
| |
 | (5) |
The
n and
Kf constants refer to the Freundlich characteristic constants that represent the intensity and capacity (mg g
−1) of adsorption, respectively.
The Langmuir and Freundlich models were used to investigate experimental data. Fig. 3S(a)–(f)† show the Langmuir and Freundlich isotherms plots and the equilibrium data for MB, TC and CIP pollutants on the MoS2/NiFe2O4/MIL-101(Fe). The results are summarized in Table 2. According to the data in Table 2, the Freundlich isotherm model exhibits a higher correlation coefficient (R2) compared to the Langmuir isotherm model. The experimental data exhibited a better fit with the Freundlich model. Therefore, the Freundlich isotherm model offers a more accurate depiction of adsorption behavior. The adsorption of three pollutants onto the MoS2/NiFe2O4/MIL-101 (Fe) nanocomposite is favorable, as shown by the RL value of calculated for the initial dye and drag concentrations. In particular, for all pollutants, the constant value of n was found to be close to 1, indicating a favorable adsorption process.
Table 2 The Langmuir and Freundlich models for MB, TC and CIP adsorption onto the MoS2/NiFe2O4/MIL-101(Fe) nanocomposite
| Dye and drug |
Langmuir |
Freundlich |
| qm (mg g−1) |
KL (L mg−1) |
R2 |
RL |
Kf (mg g−1) |
n |
R2 |
| MB |
999.1 |
0.02502 |
0.930 |
0.615 |
1.011 |
1.019 |
0.999 |
| TC |
2991.3 |
0.02507 |
0.888 |
0.347 |
1.031 |
1.044 |
0.999 |
| CIP |
1994.2 |
0.02507 |
0.703 |
0.443 |
1.030 |
1.038 |
0.999 |
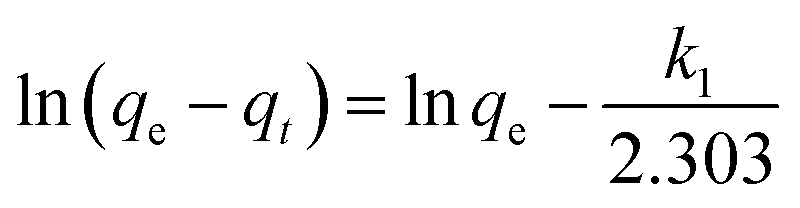
In order to investigate the mechanism of adsorption, the pseudo-first-order kinetics model and the pseudo-second-order kinetics model were used to test dynamical experimental data. The first-order reaction model is expressed as follows (eqn (6)):
| |
 | (6) |
where
k1 is the pseudo-first-order adsorption rate constant (min
−1). The values of
k1 and
qe were determined from the slope and intercept of the plots of ln(
qe −
qt)
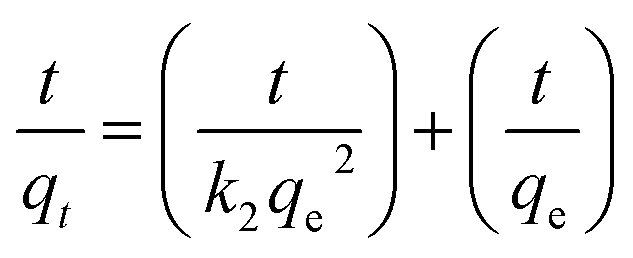
versus t. Another kinetic model introduced in the literature is the pseudo-second-order model, which is expressed as the following equation (
eqn (7)):
| |
 | (7) |
where
k2 (g mg
−1 min
−1) is a pseudo-second-order rate constant.
k2 is calculated from the intercept of the plot of
t/
qt versus t, and used to estimate the values of
qe (cal.) and
k2.
qe (mg g
−1) and
qt (mg g
−1) are the adsorption amounts of dye and drug at equilibrium and at time
t, respectively.
The adsorption kinetics of MB, TC and CIP were investigated by using pseudo-first-order and pseudo-second-order models. Fig. 4S(a)–(f)† show the plots of the pseudo-first-order and pseudo-second-order kinetics. The corresponding kinetic parameters obtained from two models (k1, k2, qecal and R2) are listed in Table 3. It can be seen that the fitting of experimental data to the pseudo-first-order model was not so good, with rather low correlation coefficients (R2). Accordingly, the experimental data did not obey the pseudo-first-order kinetic model. Conversely, linear plots of t/qt versus t with correlation coefficients higher than 0.997 indicated that the data exhibited good compliance with the pseudo-second-order kinetic equation. According to the values of R2, it is obvious that the adsorption kinetics of MB, TC and CIP followed the pseudo-second-order kinetic model.
Table 3 Kinetics parameters for MB, TC, and CIP adsorption
| Pseudo first order kinetic model |
qe, exp (mg g−1) |
qe, cal (mg g−1) |
k1 (min−1) |
R2 |
| MB |
82.47 |
0.001 |
0.002 |
0.444 |
| TC |
93.15 |
0.004 |
0.069 |
0.975 |
| CIP |
67.62 |
0.007 |
0.056 |
0.897 |
| Pseudo second order kinetic model |
Initial con. (mg L−1) |
k2 (g mg−1 min−1) |
qe, cal (mg g−1) |
R2 |
| MB |
75 |
0.0001 |
51.62 |
0.999 |
| TC |
100 |
0.0001 |
52.05 |
0.998 |
| CIP |
100 |
0.0001 |
65.18 |
0.998 |
3.6. Adsorption thermodynamics
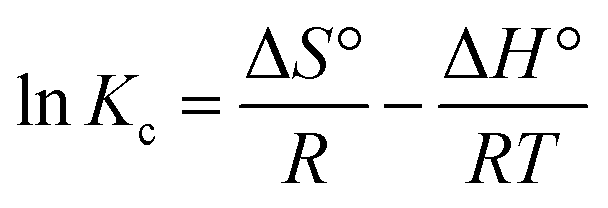
Thermodynamic studies are one of the important parameters in studying the absorption process. During the thermodynamic experiments, adsorption experiments were performed under different temperature conditions to analyze their effects. The investigated parameters include enthalpy (ΔH°), entropy (ΔS°), and Gibbs free energy (ΔG°). The thermodynamic adsorption equations are shown below.| |
 | (8) |
| | |
ΔG° = −RTlnKc
| (9) |
| |
 | (10) |
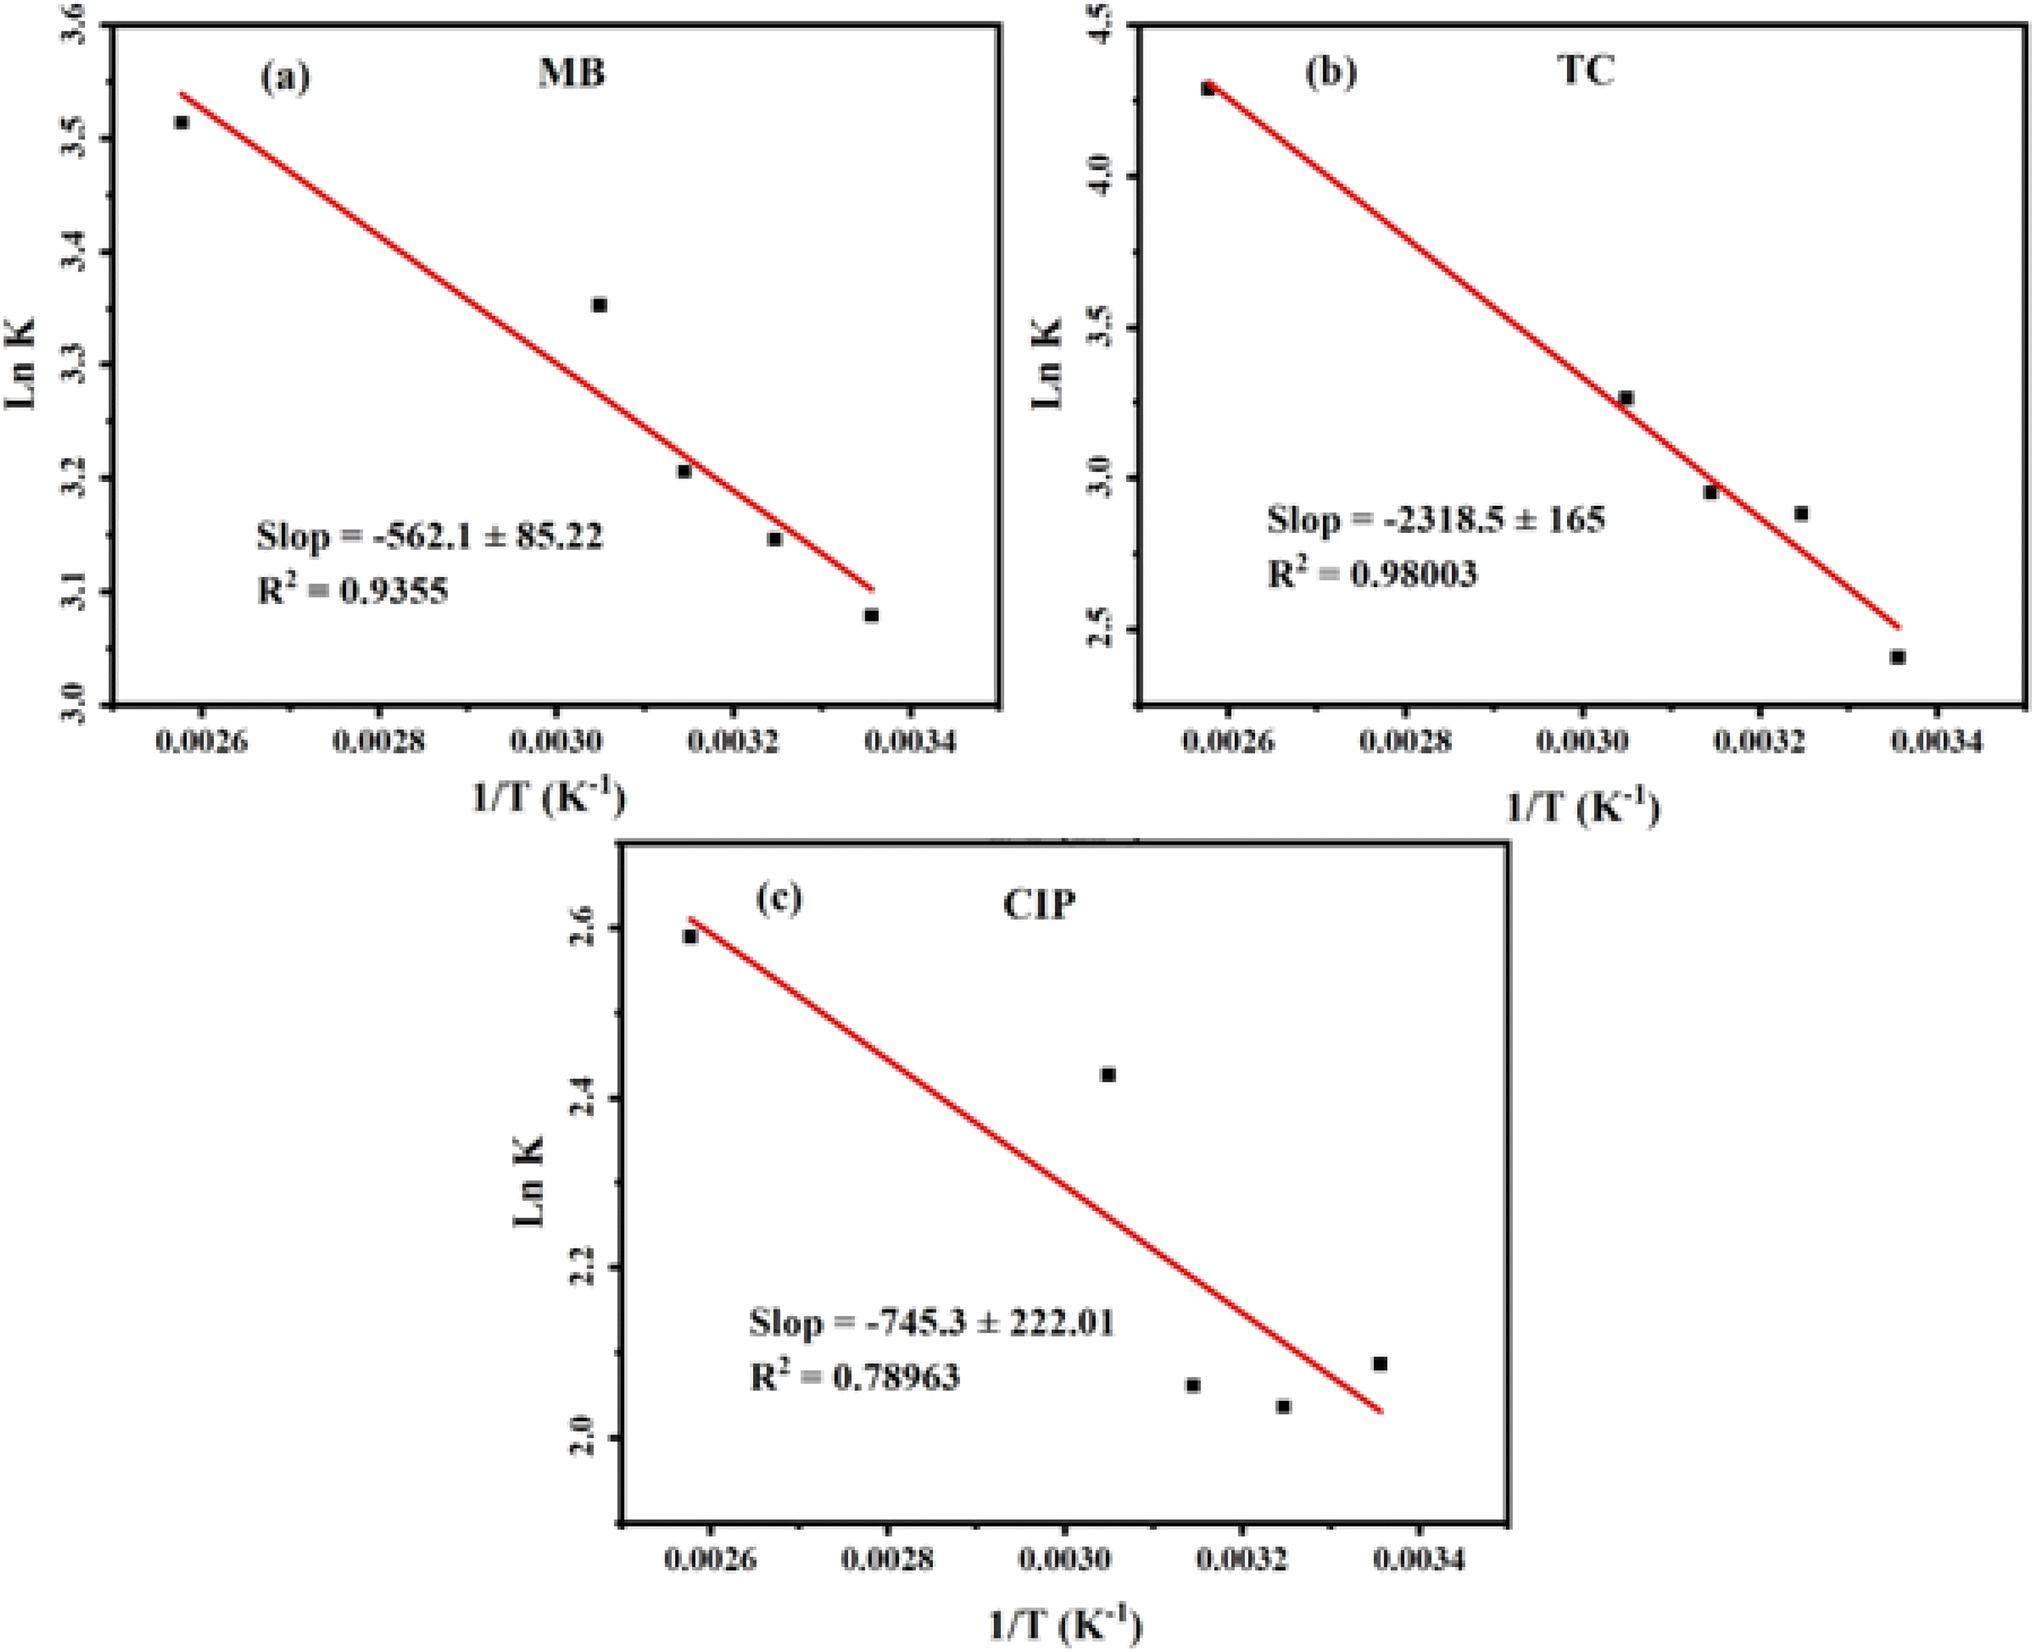
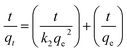
where ΔH° (kJ mol−1), ΔG° (kJ mol−1), and ΔS° (kJ mol−1 K−1) are the standard enthalpy change, standard Gibbs free energy change, and standard entropy change, respectively. T (K) represents the absolute temperature, R (8.314 J mol−1 K−1) is the gas constant, Kc is the distribution coefficient, qe is the adsorption capacity, and Ce is the solution concentration at the equilibrium state. From Fig. 15, the ΔH° and ΔS° values for MB dye and two TC and CIP drugs can be obtained from the slope and intercept of van't Hoff plots, respectively. Based on the data presented in Table 4, the positive ΔH° values suggest that the adsorption process of dye and drugs onto the MoS2/NiFe2O4/MIL-101(Fe) nanocomposite is endothermic in nature.
 |
| | Fig. 15 Van't Hoff plots for the adsorption process of (a) MB dye, (b) TC and (c) CIP drugs onto the MoS2/NiFe2O4/MIL-101(Fe) nanocomposite. | |
Table 4 Thermodynamic Parameters of MB, TC and CIP adsorption onto the MoS2/NiFe2O4/MIL-101(Fe) nanocomposite
| Dye/drug |
T (K) |
ΔG° (kJ mol−1) |
ΔH° (kJ mol−1) |
ΔS° (kJ mol−1 K−1) |
| MB |
298 |
−11.01 |
4.67 |
708.5 |
| 308 |
−11.38 |
| 318 |
−11.75 |
| 328 |
−12.12 |
| 338 |
−12.49 |
| TC |
298 |
−12.65 |
19.27 |
1371.8 |
| 308 |
−13.07 |
| 318 |
−13.49 |
| 328 |
−13.92 |
| 338 |
−14.34 |
| CIP |
298 |
−13.38 |
6.19 |
1845.7 |
| 308 |
−13.83 |
| 318 |
−14.25 |
| 328 |
−14.73 |
| 338 |
−15.18 |
3.7. Adsorption mechanism
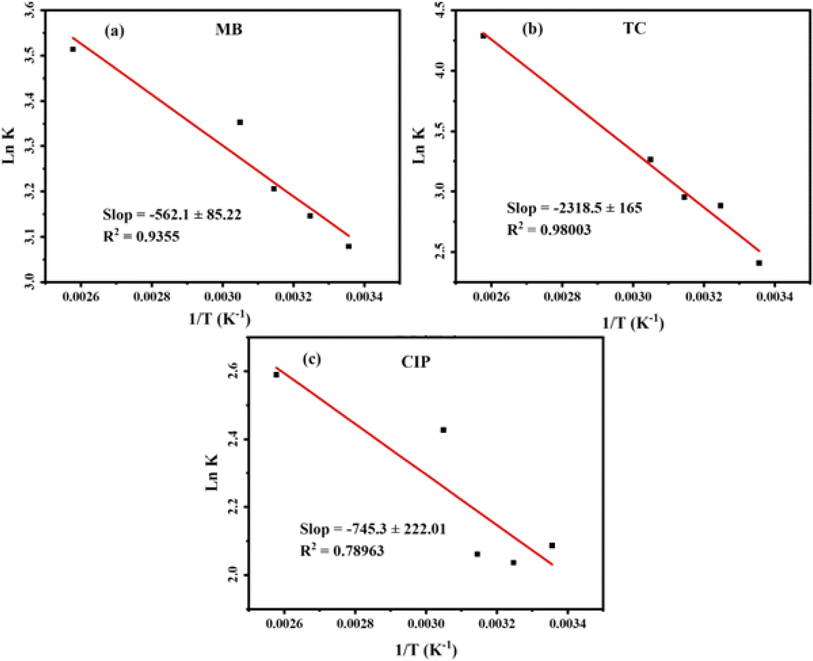
The adsorption efficiency of the MoS2/NiFe2O4/MIL-101(Fe) nanocomposite has been found to be more effective in drug and dye absorption compared to individual components such as MoS2, NiFe2O4, and MIL-101(Fe). This increased effectiveness can be attributed to the larger adsorbent surface area, which provides more active sites for adsorption activities. The results of the investigations showed that the drug and dye adsorption reaction is an endothermic process and is performed with better efficiency at higher temperatures. Drug molecules have a conjugated benzene ring structure. Therefore, the π–π stacking interaction increases the adsorption capacity of the materials during the adsorption process. The presence of functional groups in drugs, such as OH, NH2, carbonyl groups, and the MIL-101(Fe) carboxylate group, allows for hydrogen bonding with the nanocomposite. Adsorption of TC and CIP on the adsorbent mainly takes place through electrostatic interaction and π–π stacking. In addition, MB is a cationic dye that is positively charged in an aqueous solution. This confirms that other factors, besides the specific surface area of the adsorbent, affect the adsorption efficiency. This is due to the rapid and effective adsorption of MB cationic dye by MoS2 nanosheets. However, the adsorption of the anionic dye MO is unfavorable for MoS2/NiFe2O4/MIL-101(Fe). Zeta potentials of MIL-101(Fe), MoS2, and MoS2/NiFe2O4/MIL-101(Fe) samples were measured as +32.4, −47.0, and −19.8 mV in water in a natural pH (6.5–7), respectively. After modification with MoS2, the MoS2/NiFe2O4/MIL-101(Fe) nanocomposite showed a more negative zeta potential than the pristine MIL-101(Fe); therefore, it can absorb more cationic dyes such as MB, while the adsorption of anionic dyes such as MO is unfavorable. To better understand adsorption process, the surface charge of MoS2/NiFe2O4/MIL-101(Fe) composite at different pHs was measured (see Fig. 10(e)). For comparison, the zeta potential of nascent MoS2 and MIL-101(Fe) were also presented in Fig. 8. The results of zeta potential of the MoS2/NiFe2O4/MIL-101(Fe) composite in Fig. 10(e) indicate that at pH values below 2.75, the MoS2/NiFe2O4/MIL-101(Fe) surface was positively resulting in weaker interaction between the surface groups and cationic dyes and drugs and above pH 2.7, the presence of negative charge on the surface of MoS2/NiFe2O4/MIL-101(Fe) hybrid material, leading to the efficient adsorption of cationic MB dyes and for TC and CIP drugs in their zwitterionic forms (TC± and CIP±). In conclusion, the electrostatic interactions are the primary adsorption mechanism for dyes and drugs. The simplified mechanism of drug and dye adsorption is depicted in Scheme 1.
 |
| | Scheme 1 Possible mechanism for the adsorption of drugs and dyes onto the MoS2/NiFe2O4/MIL-101(Fe) nanocomposite. | |
3.8. Comparison with other reported adsorbents
To showcase the superiority of the current adsorbent, we conducted a comparative analysis of its effectiveness in removing MB, TC, and CIP from aqueous solutions. This evaluation was done in relation to similar adsorbents, as documented in Table 5.53–67 Based on the data, the MoS2/NiFe2O4/MIL-101(Fe) adsorbent demonstrates a higher adsorption capacity for the removal of dyes and drugs compared to the majority of other adsorbents reported in the scientific literature.
Table 5 Comparison of the adsorption capacityof various adsorbents for MB, TC and CIP pollutants
| Adsorbents |
Adsorbate |
qm (mg g−1) |
Ref. |
| CuS@PANI/PW12 |
MB |
83.3 |
53 |
| Fe3O4@AMCA-MIL53 (Al) |
MB |
325 |
54 |
| Activated lignin–chitosan |
MB |
34.7 |
55 |
| MOF-235 |
MB |
187 |
56 |
| H3PW12O40/MIL-101(Fe) |
MB |
473.7 |
57 |
| CDF/MF |
TC |
168.24 |
58 |
| MnFe2O4/rGO |
TC |
41 |
59 |
| MWCNT-MIL-53 (Fe) |
TC |
180.68 |
60 |
| CNT/b-CD/MnFe2O4 |
TC |
89.53 |
61 |
| CoO@C |
TC |
769.43 |
62 |
| Fe3O4/cellulose |
CIP |
6.9 |
63 |
| CS-g-PA/TSM |
CIP |
238.3 |
64 |
| MIL101 (Cr)–HSO3 |
CIP |
564.9 |
65 |
| c-FD |
CIP |
328 |
66 |
| Ga-cl-PAM/C3N4 |
CIP |
169.49 |
67 |
| MoS2/NiFe2O4/MIL-101(Fe) |
MB |
999.1 |
This work |
| MoS2/NiFe2O4/MIL-101(Fe) |
TC |
2991.3 |
This work |
| MoS2/NiFe2O4/MIL-101(Fe) |
CIP |
1994.2 |
This work |
3.9. Stability and recyclability
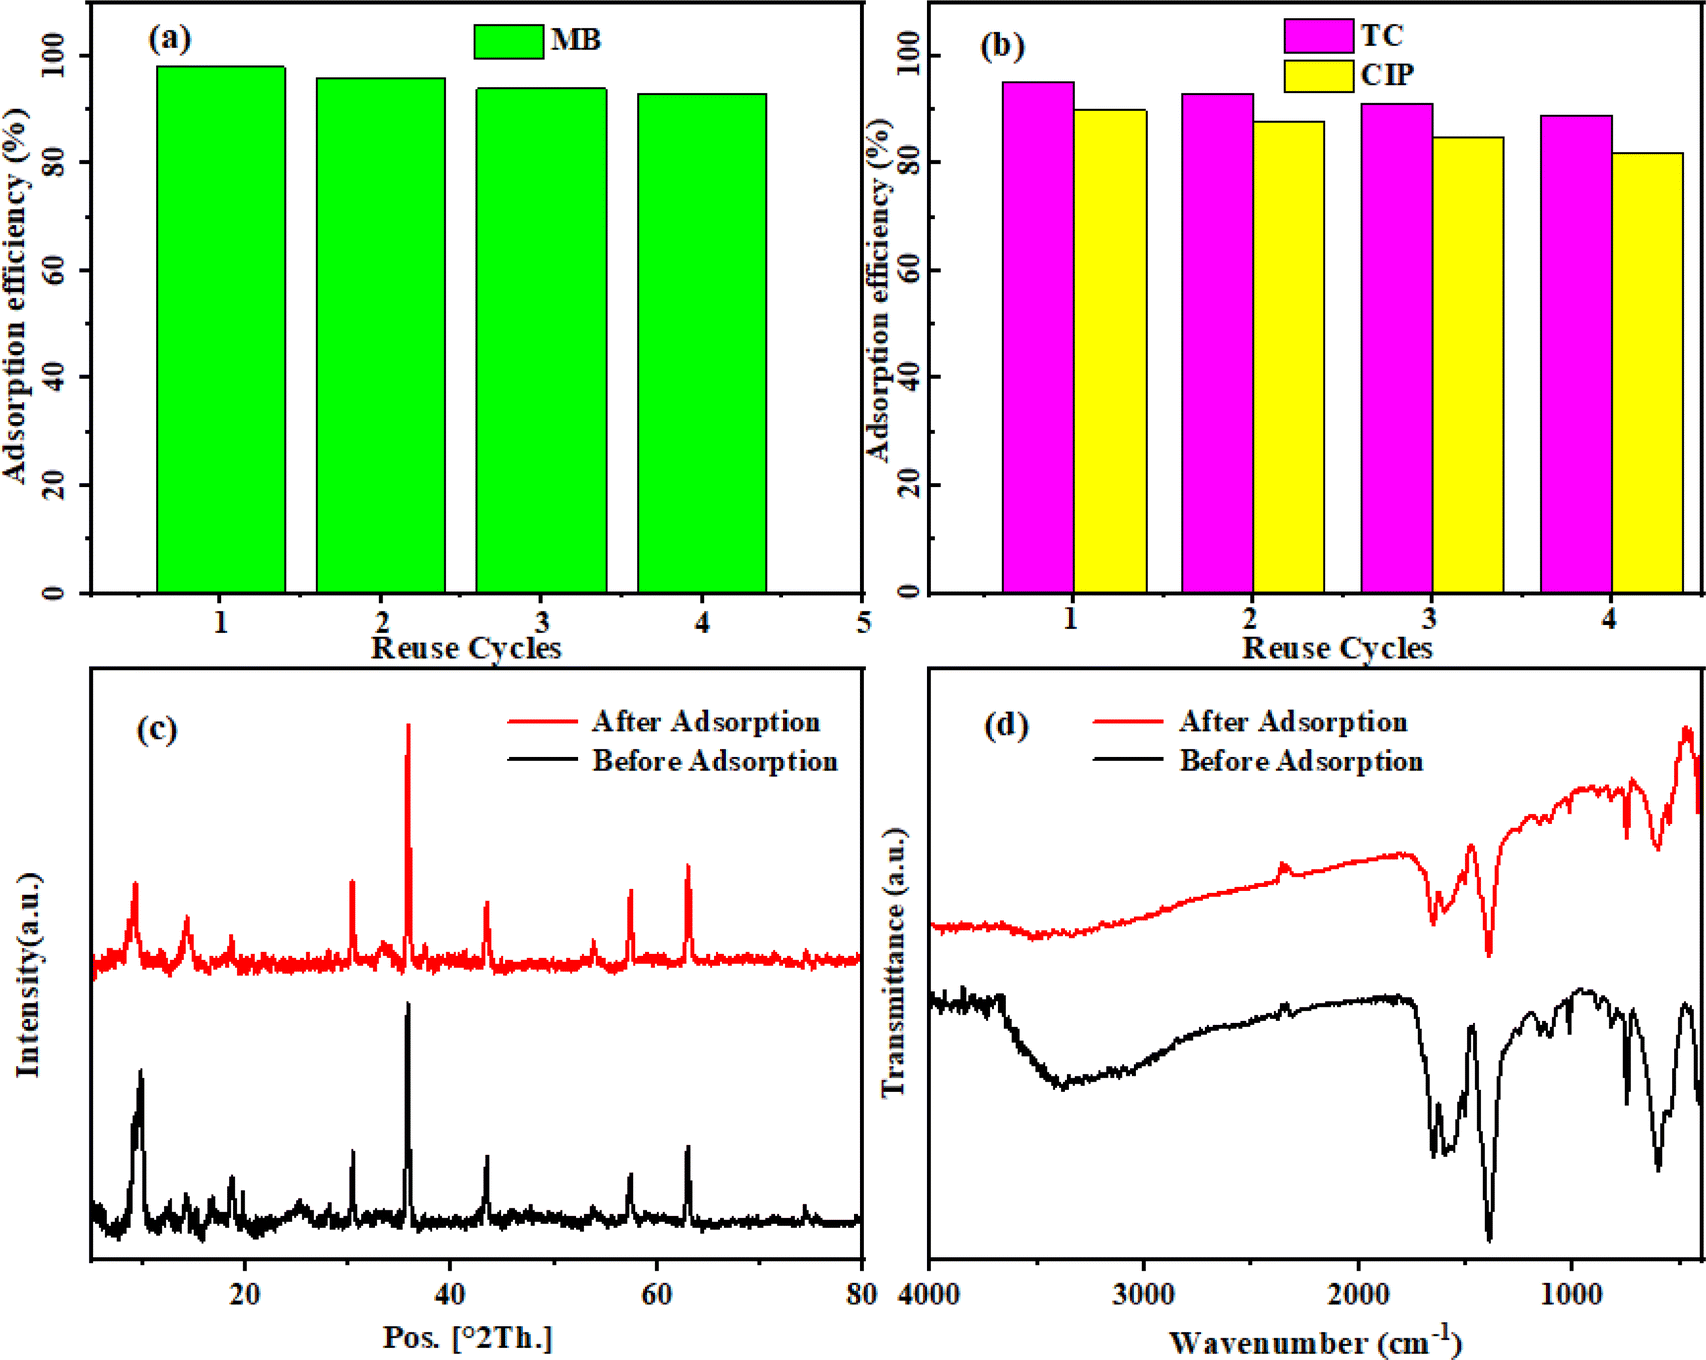
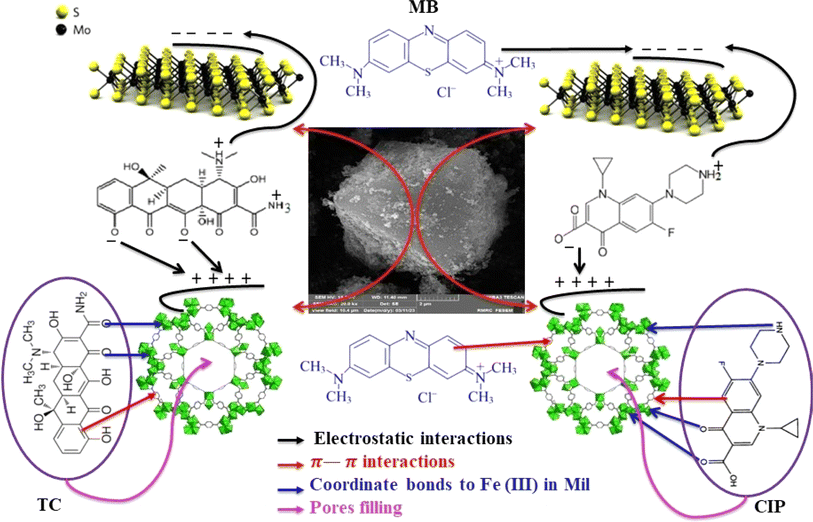
The practical application of an adsorbent depends on its reusability and stability. The reutilization potential of the MoS2/NiFe2O4/MIL-101(Fe) nanocomposite was examined in this research through four successive cycle tests conducted under identical conditions. The results demonstrated a diminishing trend in removal efficacy during the first three cycles (Fig. 16(a) and (b)), which can be attributed to the chemisorption phenomenon. However, after the third cycle, the elimination efficiency remained relatively constant, indicating that the absorbent had reached saturation and further absorption was not possible. Nevertheless, the removal efficiency of MoS2/NiFe2O4/MIL-101(Fe) for MB, TC, and CIP remained above 80% even after four cycles, demonstrating its good regenerability and reusability as well as its potential in practical applications. Furthermore, XRD and FT-IR analysis (Fig. 16(c) and (d)) were performed on the nanocomposite before and after adsorption. The conducted analyses demonstrated the magnetic nanocomposite's structural stability throughout the adsorption process, indicating its resistance to solvents, drugs, and dyes.
 |
| | Fig. 16 Reusability of the MoS2/NiFe2O4/MIL-101(Fe) in the removal of (a) MB dye, (b) TC and CIP drugs, (c) X-ray diffraction patterns and (d) FTIR spectra before and after adsorption. | |
4. Conclusion
The hydrothermal method was used to synthesize a magnetic nanocomposite consisting of MoS2/NiFe2O4/MIL-101(Fe). The objective of this research was to investigate the adsorption potential of the nanocomposite for effectively removing both dyes and drugs from aqueous solutions. The adsorption capacities of MoS2/NiFe2O4/MIL-101(Fe) for MB, TC, and CIP were determined to be 999.1, 2991.3, and 1994.2 mg g−1, respectively. The pseudo-second-order model and Freundlich model are considered to be suitable for describing the adsorption behavior of MoS2/NiFe2O4/MIL-101(Fe). Notably, even after four recycling cycles, the MoS2/NiFe2O4/MIL-101(Fe) nanocomposite demonstrated a removal efficiency of over 80% for MB, TC, and CIP, indicating its potential for practical applications due to its good recyclability and reusability. Remarkably, this material exhibited a high adsorption capacity for pollutants. Hence, it is a promising and environmental friendly adsorbent for removing and separating organic pollutants from wastewater.
Conflicts of interest
There are no conflicts to declare.
Acknowledgements
The authors give their sincere thanks to the Lorestan University and Iran Nanotechnology Initiative Council (INIC) for all provided supports.
References
- A. Ajmal, I. Majeed, R. N. Malik, H. Idriss and M. A. Nadeem, RSC Adv., 2014, 4, 37003–37026 RSC
 .
. - G. Sharma, D. D. Dionysiou, S. Sharma, A. Kumar, H. Ala'a, M. Naushad and F. J. Stadler, Catal. Today, 2019, 335, 437–451 CrossRef CAS .
- S. Samsami, M. Mohamadizaniani, M. H. Sarrafzadeh, E. R. Rene and M. Firoozbahr, Process Saf. Environ. Prot., 2020, 143, 138–163 CrossRef CAS .
- J. Yang, M. Zhu and D. D. Dionysiou, Water Res., 2021, 189, 116627 CrossRef CAS PubMed .
- E. Routoula and S. V. Patwardhan, Environ. Sci. Technol., 2020, 54, 647–664 CrossRef CAS PubMed .
- H. Fattahimoghaddam, T. Mahvelati-Shamsabadi and B. K. Lee, J. Hazard. Mater., 2021, 403, 123703 CrossRef CAS PubMed .
- J. Abdi, M. Vossoughi, N. M. Mahmoodi and I. Alemzadeh, Chem. Eng. J., 2017, 326, 1145–1158 CrossRef CAS .
- G. Crini, Bioresour. Technol., 2006, 97, 1061–1085 CrossRef CAS PubMed .
- A. Javid, A. Mesdaghinia, S. Nasseri, A. H. Mahvi, M. Alimohammadi and H. Gharibi, J. Environ. Health Sci. Eng., 2016, 14, 1–5 CrossRef PubMed .
- R. Trujillano, V. Rives and I. García, Molecules, 2022, 9, 2904 CrossRef PubMed .
- Z. Song, Y.-L. Ma and C.-E. Li, Sci. Total Environ., 2019, 651, 580–590 CrossRef CAS PubMed .
- M. Ågerstrand, C. Berg, B. Björlenius, M. Breitholtz, B. Brunström, J. Fick, L. Gunnarsson, D. G. Joakim Larsson, J. P. Sumpter, M. Tysklind and C. Rudén, Environ. Sci. Technol., 2015, 49, 5336–5345 CrossRef PubMed .
- A. A. Isari, M. Mehregan, S. Mehregan, F. Hayati, R. Rezaei Kalantary and B. Kakavandi, J. Hazard. Mater., 2020, 390, 122050 CrossRef CAS PubMed .
- W. Song, T. Yang, X. Wang, Y. Sun, Y. Ai, G. Sheng and X. Wang, Environ. Sci.: Nano, 2016, 3, 1318–1326 RSC .
- H. Chen, B. Gao and H. Li, J. Hazard. Mater., 2015, 282, 201–207 CrossRef CAS PubMed .
- B. Fan, Y. Tan, J. Wang, B. Zhang, Y. Peng, C. Yuan and S. Cui, Processes, 2021, 9, 1644 CrossRef CAS .
- C. Zhang, X. Han, F. Wang, L. Wang and J. Liang, Front. Chem., 2021, 9, 736369 CrossRef CAS PubMed .
- M. Cao, P. Wang, Y. Ao, C. Wang, J. Hou and J. Qian, J. Colloid Interface Sci., 2016, 467, 129–139 CrossRef CAS PubMed .
- Y. Li, L. Chen, Y. Wang and L. Zhu, Mater. Sci. Eng. B, 2016, 210, 29–36 CrossRef CAS .
- H. T. Chandran, S. Thangavel, C. V. Jipsa and andG. Venugopal, Mater. Sci. Semicond. Process., 2014, 27, 212–219 CrossRef CAS .
- N. Javid, Z. Honarmandrad and M. Malakootian, Desalin. Water Treat., 2020, 174, 178–185 CrossRef CAS .
- J. Chen, Y. S. Liu, J. N. Zhang, Y. Q. Yang, L. X. Hu, Y. Y. Yang and G. G. Ying, Bioresour. Technol., 2017, 238, 70–77 CrossRef CAS PubMed .
- Y. Gao, Y. Li, L. Zhang, H. Huang, J. Hu, S. M. Shah and X. Su, J. Colloid Interface Sci., 2012, 368, 540–546 CrossRef CAS PubMed .
- H. Li, D. Zhang, X. Han and B. Xing, Chemosphere, 2014, 95, 150–155 CrossRef CAS PubMed .
- X. R. Jing, Y. Y. Wang, W. J. Liu, Y. K. Wang and H. Jiang, Chem. Eng. J., 2014, 248, 168–174 CrossRef CAS .
- P. Zhao, M. Jian, Q. Zhang, R. Xu, R. Liu, X. Zhang and H. Liu, J. Mater. Chem. A, 2019, 7, 16598–16621 RSC .
- Y. J. Yuan, Z. Shen, S. Wu, Y. Su, L. Pei, Z. Ji and Z. Zou, Appl. Catal., B, 2019, 246, 120–128 CrossRef CAS .
- A. A. Isari, A. Payan, M. Fattahi, S. Jorfi and B. Kakavandi, Appl. Surf. Sci., 2018, 462, 549–564 CrossRef CAS .
- S. Silvestri, J. F. de Oliveira and E. L. Foletto, Mater. Res. Bull., 2019, 117, 56–62 CrossRef CAS .
- D. Chiappe, E. Scalise, E. Cinquanta, C. Grazianetti, B. van den Broek, M. Fanciulli and A. Molle, Adv. Mater., 2014, 26, 2096–2101 CrossRef CAS PubMed .
- U. Krishnan, M. Kaur, K. Singh, M. Kumar and A. Kumar, Superlattices Microstruct., 2019, 128, 274–297 CrossRef CAS .
- Q. Zhang, Y. Cui and G. Qian, Coord. Chem., 2019, 378, 310–332 CrossRef CAS .
- X. Han, H. G. Godfrey, L. Briggs, A. J. Davies, Y. Cheng, L. L. Daemen and M. Schröder, Nat. Mater., 2018, 17, 691–696 CrossRef CAS PubMed .
- J. Lee, C. Y. Chuah, J. Kim, Y. Kim, N. Ko, Y. Seo and E. Lee, Angew. Chem., Int. Ed., 2018, 130, 7995–7999 CrossRef .
- X. Zhao, Y. Wang, D. S. Li, X. Bu and P. Feng, Adv. Mater., 2018, 30, 1705189 CrossRef PubMed .
- L. Yue, X. Wang, T. Sun, T. Liu, Q. Li, N. Wu and W. Yang, Chem. Eng. J., 2019, 375, 121959 CrossRef CAS .
- D. Zhu, J. Liu, Y. Zhao, Y. Zheng and S. Z. Qiao, Small, 2019, 15, 1805511 CrossRef PubMed .
- N. M. Mahmoodi, J. Abdi, M. Oveisi, M. A. Asli and M. Vossoughi, Mater. Res., 2018, 100, 357–366 CAS .
- C. F. Zhang, L. G. Qiu, F. Ke, Y. J. Zhu, Y. P. Yuan, G. S. Xu and X. Jiang, J. Mater. Chem. A, 2013, 1, 14329–14334 RSC .
- P. L. Hariani, M. Said, A. Rachmat, F. Riyanti, H. C. Pratiwi and W. T. Rizk, Bull. Chem. React. Eng. Catal., 2021, 16, 481–490 CrossRef CAS .
- A. Hamedi, F. Trotta, M. Borhani
Zarandi, M. Zanetti, F. Caldera, A. Anceschi and M. R. Nateghi, Int. J. Mol. Sci., 2019, 20, 5612 CrossRef CAS PubMed .
- Z. Liu, W. He, Q. Zhang, H. Shapour and M. F. Bakhtari, ACS Omega, 2021, 6, 4597–4608 CrossRef CAS PubMed .
- H. K. Sadhanala, S. Senapati, K. V. Harika, K. K. Nanda and A. Gedanken, New J. Chem., 2018, 42, 14318–14324 RSC .
- K. Zhou, S. Jiang, C. Bao, L. Song, B. Wang, G. Tang and Z. Gui, RSC Adv., 2012, 2, 11695–11703 RSC .
- G. S. Dos Reis, B. G. Cazacliu, C. R. Correa, E. Ovsyannikova, A. Kruse, C. H. Sampaio and G. L. Dotto, J. Environ. Chem. Eng., 2020, 8, 103605 CrossRef CAS .
- G. P. Hao, W. C. Li, S. Wang, S. Zhang and A. H. Lu, Carbon, 2010, 48, 3330–3339 CrossRef CAS .
- M. Beiranvand, S. Farhadi and A. Mohammadi-Gholami, RSC Adv., 2022, 12, 34438–34453 RSC .
- S. Bazgir, S. Farhadi and Y. Mansourpanah, J. Solid State Chem., 2022, 315, 123513 CrossRef CAS .
- A. A. Hoseini, S. Farhadi, A. Zabardasti and F. Siadatnasab, RSC Adv., 2020, 10, 40005–40018 RSC .
- C. Jiao, Y. Wang, M. Li, Q. Wu, C. Wang and Z. Wang, J. Magn. Magn. Mater., 2016, 407, 24–30 CrossRef CAS .
- A. Jarrah and S. Farhadi, J. Solid State Chem., 2020, 285, 121264 CrossRef CAS .
- X. Liu, W. Gong, J. Luo, C. Zou, Y. Yang and S. Yang, Appl. Surf. Sci., 2016, 362, 517–524 CrossRef CAS .
- F. Siadatnasab, K. Karami and A. Khataee, J. Ind. Eng. Chem., 2019, 80, 205–216 CrossRef CAS .
- A. A. Alqadami, M. Naushad, Z. A. Alothman and T. Ahamad, J. Environ. Manage., 2018, 223, 29–36 CrossRef CAS PubMed .
- A. B. Albadarin, M. N. Collins, M. Naushad, S. Shirazian, G. Walker and C. Mangwandi, Chem. Eng. J., 2017, 307, 264–272 CrossRef CAS .
- E. Haque, J. W. Jun and S. H. Jhung, J. Hazard. Mater., 2011, 185, 507–511 CrossRef CAS PubMed .
- T. T. Zhu, Z. M. Zhang, W. L. Chen, Z. J. Liu and E. B. Wang, RSC Adv., 2016, 6, 81622–81630 RSC .
- T. Ahamad, R. Chaudhary, A. A. Naushad and M. Alshehri, Int. J. Biol. Macromol., 2019, 134, 180–188 CrossRef CAS PubMed .
- J. Bao, Y. Zhu, S. Yuan, F. Wang, H. Tang, Z. Bao and Y. Chen, Nanoscale Res. Lett., 2018, 13, 1–8 CrossRef CAS PubMed .
- W. Xiong, G. Zeng, Z. Yang, Y. Zhou, C. Zhang, M. Cheng and X. Li, Sci. Total Environ., 2018, 627, 235–244 CrossRef CAS PubMed .
- R. Foroutan, S. J. Peighambardoust, P. Latifi, A. Ahmadi, M. Alizadeh and B. Ramavandi, J. Environ. Chem. Eng., 2021, 9, 106344 CrossRef CAS .
- G. Yang, Q. Gao, S. Yang, S. Yin, X. Cai, X. Yu and Y. Fang, Chemosphere, 2020, 239, 124831 CrossRef CAS PubMed .
- A. Azizi, J. Iran. Chem. Soc., 2021, 18, 331–341 CrossRef CAS .
- Y. K. Manea, A. M. Khan, A. A. Wani, M. T. Qashqoosh, M. Shahadat and M. A. Salem, J. Mol. Liq., 2021, 335, 116144 CrossRef CAS .
- Z. Li, M. Ma, S. Zhang, Z. Zhang, L. Zhou, J. Yun and R. Liu, J. Porous Mater., 2020, 27, 189–204 CrossRef CAS .
- A. Jain, A. Sharma, A. Kapur, S. Wadhawan, M. Garg, S. K. Pandey and S. K. Mehta, J. Nanostruct. Chem., 2021, 11, 437–453 CrossRef CAS .
- G. Sharma, A. Kumar, M. Naushad, B. Thakur, D. V. N. Vo, B. Gao and F. J. Stadler, J. Hazard. Mater., 2021, 416, 125714 CrossRef CAS PubMed .
|
| This journal is © The Royal Society of Chemistry 2024 |
Click here to see how this site uses Cookies. View our privacy policy here. 
 Open Access Article
 This Open Access Article is licensed under a Creative Commons Attribution-Non Commercial 3.0 Unported Licence
 *a,
Abedin Zabardasti*a and
Farzaneh Mahmoudib
*a,
Abedin Zabardasti*a and
Farzaneh Mahmoudib