 Open Access Article
Up-converting β-NaY0.8[Yb0.18Er0.02]F4 nanoparticles coated by superparamagnetic γ-Fe2O3 nanosatellites: elaboration, characterization and in vitro cytotoxicity†
M. Parvizianab,
W. Mnasri ac,
M. Pleckaitis
 b,
V. Karabanovas
 b,
H. Khana,
S. Nowaka,
S. Gam-Derouicha,
L. Ben Tahar
 cd,
O. Sandre
 e,
R. Rotomskis
 b and
S. Ammar
 *a
*a
aUniversité Paris Cité, ITODYS, CNRS UMR-7086, Paris 75205, France, souad.ammar-. E-mail: merah@u-paris.fr
bNational Cancer Institute, Biomedical Physics Laboratory, Vilnius 08406, Lithuania
cUniversité de Carthage, Faculté des Sciences de Bizerte, Laboratoire Synthèse et Structure des Nanomatériaux, Zarzouna 7021, Tunisia
dNorthern Border University, College of Science, Department of Chemistry, 73213 Arar, Saudi Arabia
eUniv. Bordeaux, CNRS, Bordeaux INP, UMR-5629, LCPO, Pessac 33607, France
First published on 4th October 2024
Abstract
Current biomedical imaging techniques are vital for the diagnosis of various diseases. They are related to the development of multimodal probes encompassing all the functionalities required for comprehensive imaging. In this context, we applied a simple and reproducible wet synthesis route to produce such probes. This method allowed us to prepare about 100 nm sized lanthanide-doped yttrium fluoride nanoparticles β-NaY0.8[Yb0.18Er0.02]F4, coated with about 10 nm sized iron oxide γ-Fe2O3 nanocrystals. By this way, the built granular hetero-nanostructures combine desirable up-converting photoluminescence (the core) and superparamagnetic properties (the satellites), enabling dual optical and magnetic resonance imaging applications. Through citrate ligand grafting, the designed core–satellite particles formed stable aqueous colloids, which are valuable for biomedical applications. Optical spectroscopy and confocal microscopy revealed their capability for sustained visible light emission (predominantly green) upon near-infrared excitation (980 nm). Additionally, based on XTT assays, when incubated for 24 hours with mammalian healthy or cancer cells, even at doses as high as 0.1 mg mL−1 (milligrams of particles), they did not induce significant cytotoxicity. The measured body temperature magnetization of the engineered nanoconstructs was found to be about 10 emu g−1 (grams of particles) at 1.5 T, which is high enough to use them as positive or negative contrast magnetic resonance agents in the clinic, as confirmed by relaxometry measurements in Milli-Q water. This result underscores their promising biomedical utility as bimodal probes for optical and magnetic imaging.
Introduction
Lanthanide (Ln) co-doped hexagonal sodium yttrium fluoride (β-NaYF4:Ln) may exhibit up-conversion photoluminescence properties that are particularly useful for in vivo biomedical applications.1–4 To make such particles valuable for clinical (human) or preclinical (animal) in vivo imaging, it is important to reach their excitation in the near-infrared (NIR) region, avoiding living tissue scattering. Typically, adjusting the absorption wavelength towards higher values, in alignment with the body's transparent spectral window (600–1050 nm), facilitates the propagation of excitation light up to the targeted intravenously administered up-converting optical probes. The sequential interaction of the incident light with the atomic lanthanide energy levels, inside the hosting NaYF4 matrix, involving non-radiative energy transfers, leads to the emission of visible light, which can be typically detected by fluorescence imaging devices using endoscopic pathways.In practice, NaYF4 co-doping consists of partially substituting yttrium cations by two lanthanide cations, a sensitizer for a high content (typically 18 at%) and an activator for a low content (about 2 at%) to minimize cross-relaxation energy loss.5 The dopant selection criterion is based on characteristic spaced energy levels that render photon absorption by the sensitizer and subsequent energy transfer between the sensitizer and activator in the up-conversion process. With a high absorption coefficient and up-conversion efficiency, Yb3+ is usually selected as the sensitizer6 while Er3+, Tm3+ and Ho3+ are used as activators, the former transferring the excitation energy to the latter.7
When these lanthanide co-doped fluoride crystals are decorated with superparamagnetic iron oxide (mainly maghemite) nanocrystals at their outer regions, augmenting their inherent optical imaging capabilities with magnetic resonance imaging functionalities, the resulting nanocomposites can be employed as bimodal imaging agents. The resulting multi-stimuli-responsive hetero-nanostructures are promising tools for improved local tissue imaging. However, the control of the stability and the biocompatibility of the resulting nanoconstructs is very challenging. On the one hand, it is imperative that the two constituents of these nanoconstructs—the lanthanide co-doped hexagonal sodium yttrium fluoride core and the maghemite satellites—remain conjoined upon administration into the living body. This ensures that the combined dual magnetic and optical signals precisely describe the same body area. On the other hand, the overall engineered nanocomposites must retain their intended optical and magnetic attributes even subsequent to the assembly of their distinct elements. This signifies that the magnetic component should not compromise the optical qualities, and vice versa. They also must be sufficiently small in size and biocompatible, capable of crossing biological barriers and accessing the specific areas for imaging after administration. In other words, it is crucial that they are processed with a hydrophilic coating, based on silica,8 polymers (polyethylene glycol, polyethyleneimine, poly-vinylpyrrolidone…)9,10 or small molecules bearing hydrophilic groups like ammonium11,12 or carboxylates,13,14 while maintaining the total hydrodynamic diameter of the engineered probes as small as possible.
It is preferable to utilize an accessible, cost-effective, and scalable in wet solution synthesis route (chimie douce) to create the desired systems. Building on our prior research, where we demonstrated the feasibility of generating down-converting Eu doped β-NaYF4 calibrated particles,15 and their β-NaY0.8[Eu0.2]F4@γ-Fe2O3 superparamagnetic counterparts16 using the so-called polyol process, our current work outlines the synthesis of their up-converting equivalents. In this study, we substitute Eu dopant with Yb and Er co-dopants for the up-conversion phenomenon. The characterization of their optical and magnetic properties is thus addressed with a special emphasis on their low in cellulo toxicity, their up-converting fluorescence in biological media and superparamagnetic feature for magnetic resonance negative contrasting. Therefore, fluorescence spectroscopy, in vitro viability assays, in cellulo confocal microscopy, magnetometry and NMR relaxometry experiments were specifically performed. All the obtained results are discussed hereafter.
Results and discussion
Phase analysis of all the produced core–satellites particles
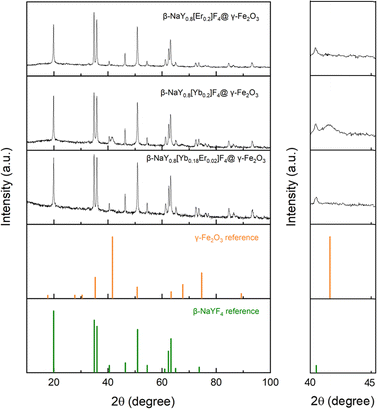
The X-ray diffraction (XRD) patterns obtained from the lanthanide-doped fluoride powders (see Fig. S1 in the ESI† section) closely correspond to the hexagonal β-NaYF4 structure (ICDD n° 98-005-1916), showcasing a chemical composition that aligns well with the intended stoichiometries (see Fig. S2†). This composition involves substituting 20 at% of yttrium with Er, Yb, or a combination of both in ratios of 2 and 18 at%, respectively. Rietveld refinements using MAUD software17 confirmed the doping. A net decrease of the unit cell parameter of the hexagonal phase, according to the well-known lanthanide contraction rule was measured (Table S1†). Scanning electron microscopy (SEM) images acquired from the powders confirm their nanoscale size, exhibiting diameters ranging from around 100 nm (see Fig. S3 and Table S1†). All these particles were then successfully coated by maghemite nanocrystals as confirmed by X-ray fluorescence spectroscopy (XRF) and XRD. Indeed, the recorded XRF spectra evidenced iron element presence within a final content of less than 5 at% (the sum of all the metal cation contents was fixed to 100 at%), except for the Yb-based composite. In this particular case, the iron content reached about 30 at%, making it much more valuable for MRI application (Fig. 1). XRD showed an additional diffraction peak at 2θ ≈ 41 °C attributed to the (311) reflection of the spinel iron oxide phase for the iron richest sample (Fig. 2). Unfortunately, this peak was not easy to detect in the iron-poorest samples, since it corresponded to a low maghemite weight content (close to the XRD detection limit i.e. 2–3 wt%19).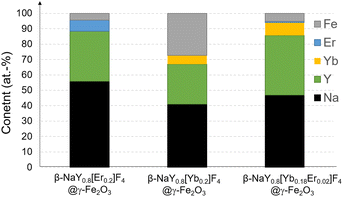 | ||
| Fig. 1 XRF chemical analysis of the as-produced β-NaY0.8[Er0.2]F4@γ-Fe2O3, β-NaY0.8[Yb0.2]F4@γ-Fe2O3 and β-NaY0.8[Yb0.18Er0.02]F4@γ-Fe2O3 powders. Data accuracy (relative precision) was estimated to be less than 0.02 at%.18 | ||
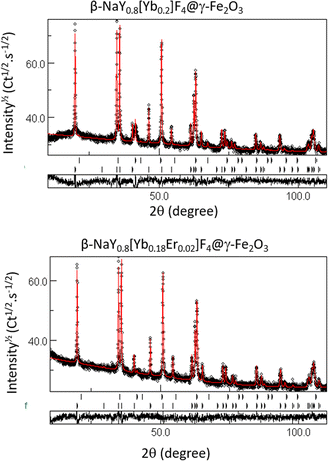
Rietveld refinements were also performed on the composite powders. The fitting allows a better characterization of the constituting up-converting and magnetic phases, confirming the production of maghemite, its low weight content and the non-alteration of the up-converting phases. Table 1 summarizes the unit cell parameters (a and c), the average crystal size 〈LXRD〉, the average lattice deformation due to micro-strains 〈〉 and the weight content of each phase for the related samples. The fit quality was confirmed through the perfect superposition of the experimental patterns and the calculated ones for all the analyzed samples as illustrated in Fig. 3.
| Phase | a (Å) ± 0.004 | c (Å) ± 0.004 | 〈LXRD〉 (nm) ± 1 | 〈〉 % | Wt% ± 2 |
|---|---|---|---|---|---|
| γ-Fe2O3 | 8.376 | — | 9 | <0.1 | 3 |
| β-NaY0.8[Yb0.18Er0.02]F4 | 5.973 | 3.508 | 99 | <0.1 | 97 |
| γ-Fe2O3 | 8.374 | — | 8 | <0.1 | 27 |
| β-NaY0.8[Yb0.2]F4 | 5.969 | 3.510 | 91 | 0.1 | 73 |
| γ-Fe2O3 | 8.374 | — | 9 | <0.1 | 3 |
| β-NaY0.8[Er0.2]F4 | 5.975 | 3.513 | 95 | <0.1 | 97 |
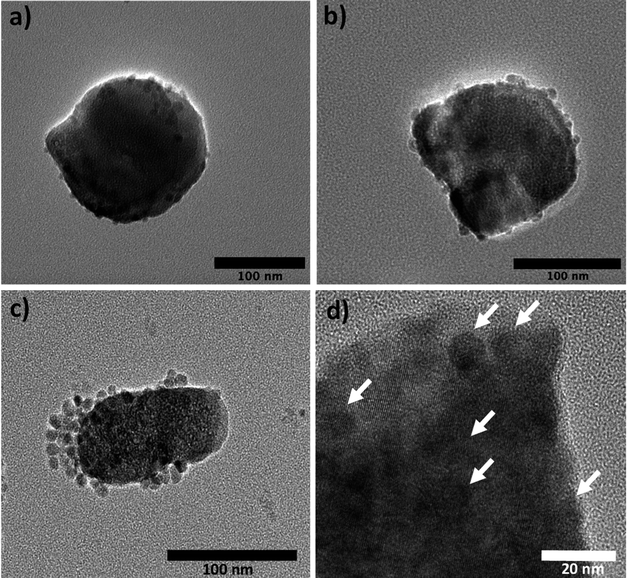
Transmission electron microscopy (TEM) observation confirmed the discrete coating of the preformed lanthanide doped β-NaYF4 particles by ultrafine iron oxide nanocrystals forming a kind of core@satellites object, the amount of these magnetic nanocrystals being significantly larger in the Yb-based nanocomposite particles (Fig. 4, 5), which explains their higher iron content (Fig. 1).
 | ||
| Fig. 4 TEM micrograph of an assembly of (a) β-NaY0.8[Er0.2]F4@γ-Fe2O3, (b) β-NaY0.8[Yb0.2]F4@γ-Fe2O3 and (c) β-NaY0.8[Yb0.18Er0.02]F4@γ-Fe2O3 particles. | ||
When dispersed in water, aided by their citrate-coating, all the manufactured composite powders create almost stable colloidal solutions in Milli-Q water. The measured hydrodynamic diameter on the three citrate-coated hetero-nanostructures ranged between 200 and 300 nm (see Fig. S6†), the largest in size being the thickly iron oxide nanoparticle coated ones, namely β-NaY0.8[Yb0.2]F4@γ-Fe2O3 composites. The zeta potential was also examined and found to be negative, primarily due to the negatively charged citrate molecules on the nanoparticle surfaces, and once again the most negative zeta potential value was obtained for the surface the β-NaY0.8[Yb0.2]F4@γ-Fe2O3 sample. It is of −25 and −27 mV for β-NaY0.8[Yb0.18Er0.02]F4@γ-Fe2O3 and β-NaY0.8[Er0.2]F4@γ-Fe2O3 particles, and reaches −40 mV for β-NaY0.8[Yb0.2]F4@γ-Fe2O3 particles, certainly due to their higher iron oxide content. Citrate anions are known as good Fe3+ ligands. They are often used to cap iron oxide nanoparticles to stabilize their suspension in water. The negatively charged carboxylate (and hydroxyl) groups of the citrates are thus strongly anchored on the surface of the particle by direct addition providing to the grafted particles a negative surface charge.20–22 Since the Yb-based nanocomposite is richer in iron oxide, its surface charge is negative. Citrate presence was indicated through Fourier transformed infrared spectroscopy (FTIR). The spectra obtained from all synthesized powders were found to be identical (Fig. S7†). They displayed characteristic peaks, including one at ∼3440 cm−1 associated with intermolecularly bonded alcohol O–H stretching, a doublet at ∼1620 and ∼1410 cm−1 assigned to asymmetric and symmetric stretching vibrations of COO− groups, and a peak at ∼430 cm−1 attributed to the Fe–O skeleton vibration. These observations are consistent with the existence of both iron oxide and carboxylate species on the surface of our particles, with at the end a total negative charge on the surface of the designed core@satellites particles. It is commonly assumed that such a negative surface charge would hamper the taking up by cells, since cell membranes also have a negative charge, thus inducing repulsive electrostatic interactions.23 However, there have been several evidence of uptake of negatively charged particles.24–26 The internalization of such particles is believed to occur through nonspecific binding and clustering of the particles on cationic sites on the plasma membrane and their subsequent endocytosis. So, in this way, despite the unfavorable electrostatic interactions between negatively charged particles and the negatively charged cell membrane, we remain quite confident about the ability of our designed particles to serve as in cellulo imaging probes.
The emission spectra of the three doped cores were measured when excited by a 980 nm laser beam, before their coating with maghemite nanocrystals (Fig. S8†). They clearly show that co-doping with both Er and Yb enhances visible emission. Specifically, at this wavelength, Yb cation undergoes excitation. The resulting excited electron is subsequently transferred to the 4F7/2 excited level of Er cation. From this level, energy loss through non-radiative processes occurs, leading to the occurrence of 4 primary visible emissions: 406, 522, 540 and 657 nm. In this particular system, ytterbium fulfills the role of the sensitizer, while erbium functions as the activator,27 leading to the highest visible photoluminescence intensity and making thus the co-doped system the best for the desired application.
Moreover, varying the incident laser power, evidenced an increase on the emission intensity (Fig. S9†) allowing us to fix till an optimum for a current alimentation of 1.00 mA. This value was chosen for the further investigations.
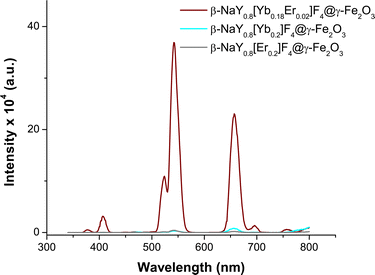
After coating with maghemite nanocrystals, the emission spectra of these three cores do not change significantly (Fig. 6). Selecting the Yb–Er co-doped system, consistent emission outcomes were observed in the case of the core@satellites particles, indicating that the iron oxide coating does not dampen or suppress the emission interestingly, the emission spectra of these particles measured in various biological media, including phosphate buffered saline (PBS) solution, Dulbecco's modified Eagle medium (DMEM), and a mixture of DMEM with fetal bovine serum (FBS), which are commonly utilized at different stages of cell culture, did not evidence significant changes. A notable efficiency in visible emission was consistently observed whatever the medium in which the citrated hetero-nanostructures were dispersed (Fig. 7).
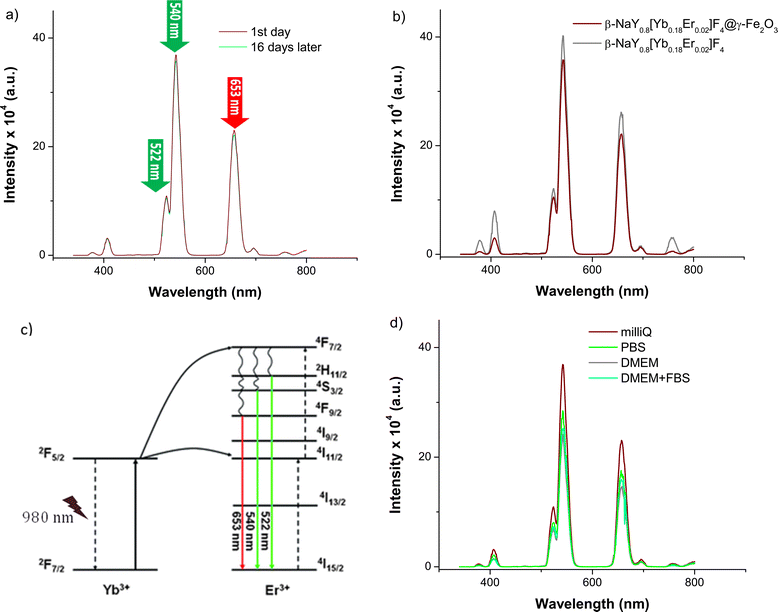 | ||
| Fig. 7 (a) Emission spectra of citrate coated β-NaY0.8[Yb0.18Er0.02]F4 recorded at r.t. on their aqueous colloidal dispersion in water Milli-Q (1 μg mL−1) under a laser irradiation of 980 nm at the day of preparation (wine line) and at 16 days later (cyan line). (b) The comparison of the citrate coated β-NaY0.8[Yb0.18Er0.02]F4 spectrum (grey line) with that of citrate coated β-NaY0.8[Yb0.18Er0.02]F4@γ-Fe2O3 (wine line). (c) The 4f lanthanide energy levels involved in the up-conversion phenomenon at the origin of the green and red emission (adapted from ref. 28). (d) Emission spectra of citrate coated β-NaY0.8[Yb0.18Er0.02]F4@γ-Fe2O3 recorded (the day of preparation) at r.t. on their colloidal dispersion (1 μg mL−1) in Milli-Q water, PBS, DMEM and DMEM + FBS, after a laser irradiation of 980 nm. | ||
To assess cellular uptake capability and visible light emission under near-infrared excitation of our engineered probes, mammalian cell lines were treated with particles followed by examination through confocal microscopy. This advanced technique provides enhanced resolution and contrast compared to conventional microscopy, achieved by capturing two-dimensional images. Specifically, human breast cancer cells (MDA-MB-231) were cultivated and exposed to citrate coated β-NaY0.8[Yb0.18Er0.02]F4@γ-Fe2O3 core@satellites particles at a concentration of 0.1 mg mL−1 for a duration of 24 h. After this incubation period, the culture medium was replaced, and multiple washes with PBS solution were performed to eliminate any particles that did not enter the cells.
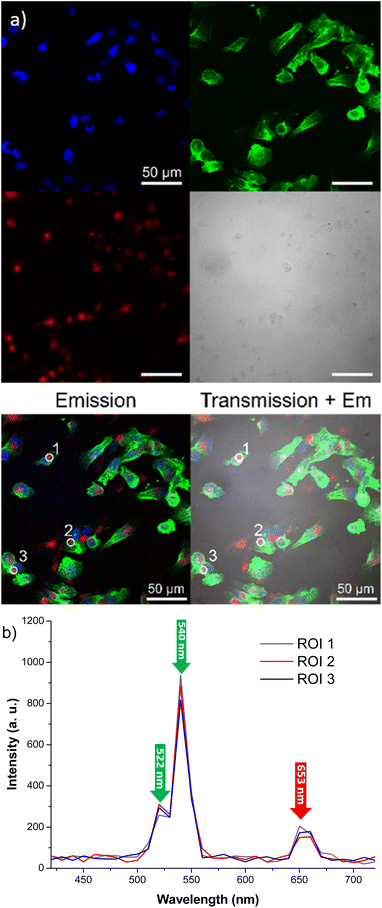
As outlined in the Experimental section, staining of cell nuclei and the cytoskeleton facilitated their visualization through confocal imaging and can be seen in Fig. 7 as blue and green colors, respectively.
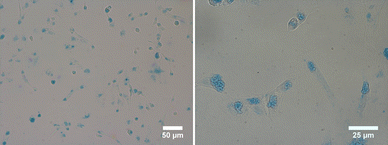
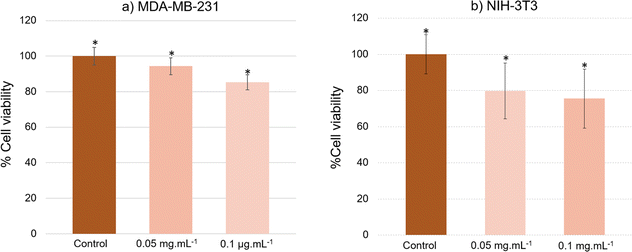
Staining also eased the observation of intracellular uptake of particles, which, after 24 h of incubation, accumulated in MDA-MB-231 cells, appearing as red dots within the cell margins after their excitation at 980 nm (Fig. 8). However, due to their size, the particles were unable to penetrate the cell nuclei and mostly concentrated within the cytoplasm of the cells. These conclusions were additionally supported by the observed green (presented as red color in Fig. 8) emission detected from the up-converting particles. Emission spectra were registered in the highlighted regions of interest (marked 1, 2, and 3) of the collected images and were measured under 980 nm laser excitation. The emission spectra displayed the distinctive bands at 522 nm, 540 nm, and 653 nm, characteristic of our nanoparticles' emission in solutions (graph in Fig. 8). These results were also supported by bright-field microscopy applied to the same cell line stained with Prussian blue pigment. This staining was used after a 24 h incubation period with our particles, at the same dosage of 0.1 mg mL−1 (milligrams of particles). This staining technique is capable of detecting only iron oxide due to its specific interaction with Fe3+ ions. Considering that the γ-Fe2O3 nanocrystals are attached to the surface of the β-NaY0.8[Yb0.18Er0.02]F4 cores, the blue color observed within the cells likely corresponds to the accumulation of our engineered citrated core@satellites particles (Fig. 9). Finally, the toxicity of our particles was assessed for doses ranging around those used for our previous experiments on two distinct mammal cell lines: healthy mouse fibroblast cells (NIH-3T3) and human breast cancer cells (MDA-MB-231). Specifically, their viability was checked for a particle contacting time of 24 h and a dose ranging between 0.05 and 0.1 mg mL−1. XTT test was applied for such a purpose (see Experiment section) and the obtained results were plotted hereafter (Fig. 10). Interestingly, a cell viability rate close to 80% was measured for a dose of 0.1 mg mL−1. It is higher for smaller doses. A viability cell rate of 80% is generally considered as satisfactory. So, this concentration is able to produce strong light emission, suitable for imaging, without resulting in significant cell damage. The fact that these β-NaY0.8[Yb0.18Er0.02]F4@γ-Fe2O3 particles exhibit low toxicity is a valuable advantage, rendering them suitable as biomedical imaging probes. This is indicative of their potential utility in imaging applications within biological systems.
It would be interesting to go further in these toxicity investigations particularly for longer cell contacting time. Recent research discusses that the dissolution of β-NaYF4 core might proceed, releasing fluoride and lanthanide ions, which might induce cytotoxicity.29 As, it would be important, to check what is the long-term becoming of the administrated particles, and how the body adapted its metabolism to eliminate them. This requires a survey of the degradation kinetics of the engineered particles at least in biomimetic media30 as well as their biodistribution in living small animals.31
These investigations go beyond the scope of the current research. Both are long time studies. They will be performed further. Here, only short time cell uptake and cell cytotoxicity studies were carried out as a first stage. To check the ability of the produced up-converting hetero-nanostructures to be employed as bimodal imaging probes, DC magnetic measurements were performed on the dried β-NaY0.8[Yb0.18Er0.02]F4@γ-Fe2O3 particles. In our experimental approach, we conducted two sets of measurements: one focusing on the magnetization variation with respect to the magnetic field, denoted as M(H), at the body temperature (b.t.), and another dealing with the thermal variation of the magnetization, represented as M(T), under a low magnetic field of 500 Oe, in both zero field cooling (ZFC) and field cooling (FC) conditions. The former is important to determine the total magnetization of the engineered particles at a field close to that used in clinic for magnetic resonance imaging (MRI), namely 1.5 T. This parameter plays an important role in the magnetic dipolar interaction between the water proton nuclear magnetic moment and the probe magnetic moment. As high is as short is the proton magnetic relaxation time. More precisely, the transverse relaxivity of an MRI contrast agent is expected to vary like the square of the magnetization at the field used.32 The latter is important to establish the predominance of a superparamagnetic behaviour in the whole magnetic response of the produced core–satellites particles. To be as exhaustive as possible, all these measurements were performed in parallel on the β-NaY0.8[Yb0.18Er0.02]F4 cores and the γ-Fe2O3 satellites prepared separately. The M(T) curves of γ-Fe2O3 particles exhibit superparamagnetic behavior, as indicated by the observed irreversibility between the ZFC- and FC-M(T) branches, with an average blocking temperature 〈TB〉 of 55 K (Fig. 11a and c). The same feature was observed for β-NaY0.8[Yb0.18Er0.02]F4@γ-Fe2O3 particles with a 〈TB〉 of 17 K, while for β-NaY0.8[Yb0.18Er0.02]F4 particles only a paramagnetic feature was detected. An alignment of the two FC and ZFC M(T) branches and their hyperbolic rise as temperature decreases are observed due to the Zeeman interaction of the three unpaired electrons of Er3+ cations in sodium yttrium fluoride matrix with the applied magnetic field. Clearly, the plotted M(T) curves for β-NaY0.8[Yb0.18Er0.02]F4@γ-Fe2O3 particles are the superposition of those of γ-Fe2O3 particles and β-NaY0.8[Yb0.18Er0.02]F4 particles, with an additional effect, that of the decrease of the mutual dipolar interaction between the γ-Fe2O3 satellites onto the β-NaY0.8[Yb0.18Er0.02]F4 cores. As suggested by TEM observations, maghemite nanocrystals are less in contact with each other in the powdered heterostructures than in their own powder (see Fig. 5 vs. S5†). Indeed, TB is influenced by dipolar interactions between magnetic moments, and it increases as the strength of these interactions increases.33 This is particularly evident when magnetic nanoparticles come into closer proximity with each other.
The magnetization M(H) curve obtained on the γ-Fe2O3 nanocrystals demonstrates the distinct characteristics of a superparamagnet with zero remanence and coercivity at b.t. Note that due to their ultrasmall size, the magnetization of these particles does not saturate at high field.34 The M(H) plot of the β-NaY0.8[Yb0.18Er0.02]F4 particles displays the typical attributes of a paramagnet, featuring an S-shaped curve of Langevin type. The M(H) behaviour of the β-NaY0.8[Yb0.18Er0.02]F4@γ-Fe2O3 particles falls in between these two previous patterns (Fig. 12). In terms of magnetization, the core@satellites particles naturally exhibit lower magnetization compared to pure iron oxide nanocrystals. Nevertheless, this magnetization remains sufficiently strong for a potential utilization as positive or negative magnetic resonance contrast agents. It is close to 10 emu g−1 (grams of particles) at 15 kOe, the field usually applied in clinical MRI scanner.
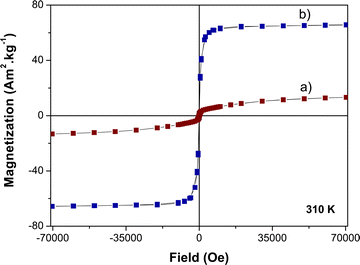 | ||
| Fig. 12 310 K-isothermal variation of the magnetization as a function of the magnetic field of citrate coated (a) β-NaY0.8[Yb0.18Er0.02]F4@γ-Fe2O3 and (b) γ-Fe2O3 particles. | ||
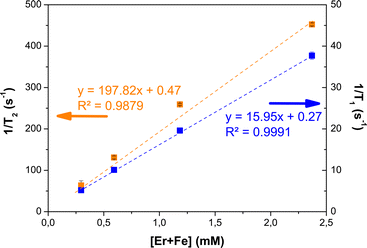
Relaxometry measurements were performed at 1.41 T and b.t. on aqueous suspensions of β-NaY0.8[Yb0.18Er0.02]F4@γ-Fe2O3. In Milli-Q water. Examples of the relaxation curves of respectively Mz and Mxy nuclear magnetization are provided in the ESI (Fig. S8†). The longitudinal and transversal relaxivity values were then deduced from the slope of the linear variation of the longitudinal (respectively transverse) decay rate of water proton spins with [Er + Fe], according to:
| 1/Ti=1 or 2 = ri=1 or 2.[Er + Fe] + (1/Ti=1 or 2)water | (1) |
The relaxation times of a pure water, T1 = 3740 ± 10 ms and T2 = 2126.8 ± 0.6 ms as-measured experimentally, were used to set the intercepts of the regression lines. The obtained curves were plotted in Fig. 13. These first tests showed a moderate T1 effect with a stronger T2 effect on β-NaY0.8[Yb0.18Er0.02]F4@γ-Fe2O3 colloids, related to the paramagnetism of Er3+ ions. These cations are not directly accessible to water molecules, since they are located inside the β-NaYF4 crystal matrix, which is itself surrounded by a surfactant double layer (oleic acid15). As a point of reference a longitudinal relaxivity of r1 = 0.69 mM−1 s−1 was measured on the β-NaY0.8[Yb0.18Er0.02]F4 cores alone. The introduction of maghemite nanocrystals around the up-converting cores provides real contrasting capabilities, due to their superparamagnetic properties. The measured longitudinal and transverse relaxivity values of about 16 and 198 mM−1 s−1 agree with a typical negative contrast agent feature. These values are close to those already measured on similarly-sized (about 10 nm) polyol made maghemite particles,11,16 meaning that the magnetic relaxometry properties of the designed core@satellites particles are mainly driven by their maghemite component, yet with addition of contribution to the magnetization brought by the paramagnetic Er3+ cations in the core.
Experimental
Synthesis of water-soluble β-NaY0.8[Yb0.18Er0.02]F4@γ-Fe2O3 nanoprobes
The synthesis of water-soluble β-NaY0.8[Yb0.18Er0.02]@γ-Fe2O3 particles involved a three-step process. The process began with the generation of β-NaY0.8[Yb0.18Er0.02]F4 seeds in a polyol solution. Subsequently, γ-Fe2O3 nanocrystals were grown around these seeds in a fresh polyol medium. Finally, the resulting nanocomposites were functionalized by hydrophilic citrate ligands, making them water-dispersible.In practice, 25.0 or 28.9 M of yttrium(III) acetate (99.9%, Sigma-Aldrich) and an appropriate amount of ytterbium(III) and erbium(III) acetate salts (99.9%, Sigma-Aldrich) were dissolved in a mixture of 125.0 mL of 20![[thin space (1/6-em)]](https://www.rsc.org/images/entities/char_2009.gif) :
:![[thin space (1/6-em)]](https://www.rsc.org/images/entities/char_2009.gif) 80 v/v ethylene glycol–diethylene glycol in volume mixture (≥99%, Sigma-Aldrich) and 62.5 mL of oleic acid (Fisher scientific, 70%). Ammonium fluoride (98%, Sigma-Aldrich) and sodium hydroxide (98%, Sigma-Aldrich) were added at the nominal Y
80 v/v ethylene glycol–diethylene glycol in volume mixture (≥99%, Sigma-Aldrich) and 62.5 mL of oleic acid (Fisher scientific, 70%). Ammonium fluoride (98%, Sigma-Aldrich) and sodium hydroxide (98%, Sigma-Aldrich) were added at the nominal Y![[thin space (1/6-em)]](https://www.rsc.org/images/entities/char_2009.gif) :
:![[thin space (1/6-em)]](https://www.rsc.org/images/entities/char_2009.gif) F
F![[thin space (1/6-em)]](https://www.rsc.org/images/entities/char_2009.gif) :
:![[thin space (1/6-em)]](https://www.rsc.org/images/entities/char_2009.gif) Na or (Y + Ln)
Na or (Y + Ln)![[thin space (1/6-em)]](https://www.rsc.org/images/entities/char_2009.gif) :
:![[thin space (1/6-em)]](https://www.rsc.org/images/entities/char_2009.gif) F
F![[thin space (1/6-em)]](https://www.rsc.org/images/entities/char_2009.gif) :
:![[thin space (1/6-em)]](https://www.rsc.org/images/entities/char_2009.gif) Na atomic ratios of 1
Na atomic ratios of 1![[thin space (1/6-em)]](https://www.rsc.org/images/entities/char_2009.gif) :
:![[thin space (1/6-em)]](https://www.rsc.org/images/entities/char_2009.gif) 32
32![[thin space (1/6-em)]](https://www.rsc.org/images/entities/char_2009.gif) :
:![[thin space (1/6-em)]](https://www.rsc.org/images/entities/char_2009.gif) 2.5. The mixture was then heated under reflux for 30 min (6 °C min−1). After cooling down to r.t., the formed precipitate was recovered, by adding an excess of ethanol, through several cycles of centrifugation and distilled water washing. The same protocol was carried out in order to prepare β-NaY0.8[Yb0.2]F4 and β-NaY0.8[Er0.2]F4 nanoparticles to serve as references.
2.5. The mixture was then heated under reflux for 30 min (6 °C min−1). After cooling down to r.t., the formed precipitate was recovered, by adding an excess of ethanol, through several cycles of centrifugation and distilled water washing. The same protocol was carried out in order to prepare β-NaY0.8[Yb0.2]F4 and β-NaY0.8[Er0.2]F4 nanoparticles to serve as references.
300 mg of the dried seeds were dispersed in 31 mL of diethylene glycol (99%, Across Organics), in which 3 mmol of iron acetate (95%, Sigma-Aldrich) and 0.125 mL of deionized H2O were added. The resulting mixture was then heated up to reflux for 3 h. The obtained precipitate was then separated from the supernatant, at r.t., by centrifugation and washing with ethanol and water, and finally dried in air.
Freely dispersed γ-Fe2O3 nanoparticles were also prepared within the same operating conditions, removing the β-NaY0.8[Yb0.18Er0.02]F4 seeds from the starting reaction solution.
At the end, citrate-grafting was achieved through a simple ligand exchange method, replacing the residual organic moieties at the surface of the fluoride and/or oxide particles by the freshly introduced multivalent citrate species, taking advantage from the complexing ability of their carboxylate and hydroxyl groups.13 Typically, 1 g of β-NaY0.8[Ln0.2]F4@γ-Fe2O3 (Ln = Yb, Er or Yb–Er), nanoparticles were dispersed in 200 mL of an aqueous trisodium citrate (50 mM) solution. The resulting suspension was mechanically stirred and heated up to 100 °C for 30 min. The resulting precipitate was collected using a strong magnet, then washed with an excess of ethanol, to remove the non-grafted organic species, and finally dried in air at 60 °C. The same protocol was applied to the seed and the deposit alone.
Structural and microstructural characterization
XRD was performed on all the produced powders using an X'pertPro diffractometer (PANALYTICAL, Almelo, Netherlands), equipped with a Co-Kα tube (40 kV, 40 mA) and configured for a θ–θ Bragg–Brentano reflection geometry. XRF was also carried out with a Minipal4 spectrometer (PANALYTICAL, Almelo, Netherlands), equipped with a Rh-Kα tube (30 kV, 87 μA). Quantification was achieved via pre-plotted calibration curves using Na+, Y3+, Yb3+ Er3+ and Fe3+ standard solutions. SEM was carried out on a Supra40 ZEISS FEG microscope, operating at 5.0 kV and equipped with a high-efficiency In-lens detector and an Everhart–Thornley secondary electron detector. TEM was also conducted, using a JEM 2010 UHR microscope (JEOL, Tokyo, Japan), operating at 200 kV and micrographs were collected thanks to a Gatan Orius SC1000 4008 × 2672 pixel charge-coupled device CCD camera (AMETEK, Berwyn, US). Image treatment was performed using ImageJ 1.46 software.Hydrophilic coating evaluation
Zeta potential of the citrated particles dispersed in water was measured thanks to a Zetasizer NanoZS instrument (MALVERN PANALYTICAL, Worcestershire, UK). FTIR analysis was also performed at r.t. using an Equinox FTIR spectrometer (Bruker, Baltimore, US) operating in a transmission scheme (KBr pellet) to confirm citrate-grafting.Routine magnetometry
The variation of the magnetization M as a function of temperature T and as a function of magnetic field H was measured on solid state, using a MPMS-5S SQUID magnetometer (Quantum Design, San Diego, US). In practice, 20 mg of the dried powder were slightly compacted in a plastic sampling tube to avoid their movement during measurements. DC magnetization was recorded versus temperature M(T), under a dc magnetic field of 500 Oe, operating within ZFC and FC conditions, between 5 and 330 K. Also, magnetization was recorded versus magnetic field M(H) at 310 K (37 °C) by cycling the magnetic field between 70 and −70 kOe.Magnetic relaxometry
Relaxometry was carried out on freshly prepared vortexed aqueous colloids (Milli-Q water) of different [Fe] and/or [Er] concentrations ranging between 25 μM and 2.5 mM, staring from a 2 mL stock solution of β-NaY0.8[Yb0.18Er0.02]@γ-Fe2O3 particles (5.6 mg mL−1) and of β-NaY0.8[Yb0.18Er0.02] particles (5.2 mg mL−1), both citrate-coated. In practice, 350 μL of each solution (the stock and the diluted ones) was introduced in a nuclear magnetic resonance (NMR) tube (7.5 mm outer diameter). The tubes were then inserted in a Minispec mq60 relaxometer (Bruker, Rheinstetten, Germany) equipped with a 60 MHz/1.41 T magnet. The T1 and T2 relaxation times were recorded as a function of total metal concentrations [Er] + [Fe], at 310 K, which was initially inferred from XRF without any acid mineralization. T2 was measured with a Carr-Purcell-Meiboom-Gill (CPMG) sequence using an inter-echo time (TE) between 0.04 and 0.5 ms (typically T2/50) and a mono-exponential decay fit of 1500 or 3000 data points. The recycling delay (RD) was adjusted around 5 times the initial T1 value, measured by an inversion recovery (IR) sequence, whose relaxation was fitted by a mono-exponential on 15 data points, the first delay (TE) being around T1/100 and the final duration at least around 3 times T1. These parameters (TE, RD and amplifier gain) were adjusted until the T2 and T1 values were measured with low uncertainty, typically 0.1%, for each iron concentration (four values in total). Typical relaxation curves are given in the supporting section.Photoluminescence
Photoluminescence of the produced particles dispersed in aqueous-based solutions were recorded at r.t. using the Edinburgh Instruments FLS980 (Edinburgh Instruments, UK) spectrometer, equipped with a double emission monochromator, a cooled (−20 °C) single-photon counting photomultiplier (Hamamatsu R928), and a 720 mW continuous wavelength 980 nm laser diode. The emission slit was set to 0.5 nm, the step size was 0.5 nm, and the integration time was 0.2 s with repeat of 10 times. The emission spectra were corrected by a correction file obtained from a tungsten incandescent lamp certified by National Physics Laboratory, UK.Cell culture and particle incubation
The embryonic mouse fibroblast cell line and the epithelial human breast cancer cell line, respectively abbreviated as NIH-3T3 and MDA-MB-231 (purchased from the European Collection of Cell Cultures and American Type Culture Collection, respectively), were chosen as models for in vitro experiments. Cells were cultured in DMEM media, supplemented with 10% (v/v) FBS, 100 U mL−1 penicillin and 0.1 mg mL−1 streptomycin (all from Gibco, Thermo Fisher Scientific, Waltham, MA, USA). Cells were maintained at 37 °C in a humidified atmosphere containing 5% of CO2. The cells were routinely subcultured 2–3 times a week in 25 cm2 cells culture flasks, following NIH-3T3 and MDA-MB-231 cell culturing protocols.35,36Confocal microscopy
For cellular imaging studies, MDA-MB-231 cells were seeded into an 8-chambered cover glass plate (Thermo Fisher, USA) with a density of 30![[thin space (1/6-em)]](https://www.rsc.org/images/entities/char_2009.gif) 000 cells per chamber. For the evaluation of particles uptake, cells were treated with 0.1 mg mL−1 (milligrams of particles) of nanocomposite particles and incubated for the next 24 h. Before imaging, cells were covered and fixed with sufficient amount of 4% paraformaldehyde (Sigma-Aldrich, Germany) for 15 min. Nuclei of the cells were stained with 10 μg mL−1 of Hoechst 33
000 cells per chamber. For the evaluation of particles uptake, cells were treated with 0.1 mg mL−1 (milligrams of particles) of nanocomposite particles and incubated for the next 24 h. Before imaging, cells were covered and fixed with sufficient amount of 4% paraformaldehyde (Sigma-Aldrich, Germany) for 15 min. Nuclei of the cells were stained with 10 μg mL−1 of Hoechst 33![[thin space (1/6-em)]](https://www.rsc.org/images/entities/char_2009.gif) 258 (Sigma-Aldrich, Germany) while their cytoskeleton was stained with 165 mM Alexa Fluor 488 Phalloidin (ThermoFisher Scientific, USA). The accumulation of particles was observed using a Nikon Eclipse TE-2000U C1 Plus laser scanning confocal microscope (Nikon, Tokyo, Japan) equipped with continuous wave lasers: 405 nm (Melles Griot, USA), 488 nm (Melles Griot, USA) and 980 nm (Changchun New Industries Optoelectronics Tech. Co., Ltd., China). Imaging was performed using 60×/1.4 NA oil immersion objective (Nikon, Japan). The three-channel RGB detector filters (band-pass filters 450/17 nm, 545/45 nm and 688/67 nm for blue, green, and red channels, respectively were used. Both cellular dyes Hoechst 33
258 (Sigma-Aldrich, Germany) while their cytoskeleton was stained with 165 mM Alexa Fluor 488 Phalloidin (ThermoFisher Scientific, USA). The accumulation of particles was observed using a Nikon Eclipse TE-2000U C1 Plus laser scanning confocal microscope (Nikon, Tokyo, Japan) equipped with continuous wave lasers: 405 nm (Melles Griot, USA), 488 nm (Melles Griot, USA) and 980 nm (Changchun New Industries Optoelectronics Tech. Co., Ltd., China). Imaging was performed using 60×/1.4 NA oil immersion objective (Nikon, Japan). The three-channel RGB detector filters (band-pass filters 450/17 nm, 545/45 nm and 688/67 nm for blue, green, and red channels, respectively were used. Both cellular dyes Hoechst 33![[thin space (1/6-em)]](https://www.rsc.org/images/entities/char_2009.gif) 258, Alexa Fluor 488 Phalloidin, and up-converting nanoparticles were excited with 405 nm, 488 nm, and 980 nm lasers, respectively. Emission of nuclear dye was registered in a blue channel (450/17 nm band pass filter) and actin filaments dye of the cytoskeleton in a green 545/45 nm) channel. Emission of particles was registered in the green (545/45 nm) channel as well, during a separate scan. For better visualization and to prevent overlapping with the fluorescence of Alexa Fluor 488 Phalloidin, a red pseudo color was used for representing emission of nanoparticles. Image processing was performed using the Nikon EZ-C1 Bronze version 3.80.
258, Alexa Fluor 488 Phalloidin, and up-converting nanoparticles were excited with 405 nm, 488 nm, and 980 nm lasers, respectively. Emission of nuclear dye was registered in a blue channel (450/17 nm band pass filter) and actin filaments dye of the cytoskeleton in a green 545/45 nm) channel. Emission of particles was registered in the green (545/45 nm) channel as well, during a separate scan. For better visualization and to prevent overlapping with the fluorescence of Alexa Fluor 488 Phalloidin, a red pseudo color was used for representing emission of nanoparticles. Image processing was performed using the Nikon EZ-C1 Bronze version 3.80.
In cellulo examination through the Prussian blue staining
For iron oxide visualization, a Prussian Blue Cell Staining Reagent Pack (Sigma-Aldrich)37 was performed on 4% glutaraldehyde-fixed cells. In practice, after 24 h of particle incubation, MDA-MB-231 cells were incubated for 30 minutes with 2% potassium ferrocyanide (Perl's reagent, Sigma) in 3.7% hydrochloric acid. During the reaction, any ferric ion present in the cells combines with the ferrocyanide and results in the formation of a bright blue pigment called Prussian blue, or ferric ferrocyanide. The working solution was aspirated and the fixed cells were washed with PBS. The accumulation of iron-based composite particles in cells was observed using Nikon Eclipse TE2000-U (Nikon, Tokyo, Japan) bright-field microscope equipped with a digital color camera Leica DFC290. To gain a better insight on cell structure, we also used differential interference contrast method (DIC).XTT viability in cellulo assay
For in cellulo viability assays, NIH-3T3 or MDA-MB-231 cells were seeded on a 96-wellplate at a density of 15![[thin space (1/6-em)]](https://www.rsc.org/images/entities/char_2009.gif) 000 cells per well. After 24 h, the old medium was replaced with fresh medium containing particles 0.1 mg mL−1 or 0.05 mg mL−1 (prepared from a stock solution of 1 mg mL−1 which was diluted 10 and 20 times, respectively) for 24 h. The old medium was then removed, and the cells were washed three times with PBS (pH = 7.0). To prepare a XTT reaction solution,38 1 μL activation solution (N-methyl dibenzopyrazine methyl sulfate) and 50 μL XTT reagent (tetrazolium derivative) were mixed. 100 μL of fresh media and 50 μL of the reaction solution were added to each well and the plate was incubated for another 4 h in an incubator at 37 °C. After incubation, optical density values at 490 nm were measured using the microplate reader. After obtaining values of absorbance, they were recalculated as percentage values of viability. A control was also performed in absence of particles. Absorbance value of control group was equated to 100% and the rest values were calculated proportionally to control. All the experiments were replicated thrice. Data are expressed as mean ± standard deviation (SD). The statistical significance of differences between studied groups was assessed using a two-tailed independent Student's t-test at the 95% confidence level. The level of statistical significance was expressed as p-values < 0.05.
000 cells per well. After 24 h, the old medium was replaced with fresh medium containing particles 0.1 mg mL−1 or 0.05 mg mL−1 (prepared from a stock solution of 1 mg mL−1 which was diluted 10 and 20 times, respectively) for 24 h. The old medium was then removed, and the cells were washed three times with PBS (pH = 7.0). To prepare a XTT reaction solution,38 1 μL activation solution (N-methyl dibenzopyrazine methyl sulfate) and 50 μL XTT reagent (tetrazolium derivative) were mixed. 100 μL of fresh media and 50 μL of the reaction solution were added to each well and the plate was incubated for another 4 h in an incubator at 37 °C. After incubation, optical density values at 490 nm were measured using the microplate reader. After obtaining values of absorbance, they were recalculated as percentage values of viability. A control was also performed in absence of particles. Absorbance value of control group was equated to 100% and the rest values were calculated proportionally to control. All the experiments were replicated thrice. Data are expressed as mean ± standard deviation (SD). The statistical significance of differences between studied groups was assessed using a two-tailed independent Student's t-test at the 95% confidence level. The level of statistical significance was expressed as p-values < 0.05.
Conclusions
In summary, we successfully synthesized pure hexagonal phase NaYF4 doped with various lanthanides, including erbium and ytterbium, as well as co-doped with ytterbium and erbium, utilizing the polyol process. By utilizing a mixture of ethylene glycol and diethylene glycol as solvents, we achieved particle size reduction. Furthermore, we effectively coated the luminescent core surfaces with about 10 nm sized Fe2O3 maghemite nanocrystals. Different arrangements of γ-Fe2O3 around the cores were observed within the various systems, ranging from a relatively dense layer (β-NaY0.8[Yb0.2]F4) to a notably discontinuous one (β-NaY0.8[Er0.2]F4) and (β-NaY0.8[Yb0.18Er0.02]F4). Despite this variation in γ-Fe2O3 coverage, the resulting heterostructures displayed relevant magnetization for their potential use as MRI contrast agents. Longitudinal and transversal reflexivity values of about 16 and 198 mM−1 s−1 were measured, respectively, on their aqueous colloids (Milli Q water) at 37 °C, for an applied static magnetic field of 1.41 T, close to the field of 1.5 T applied in clinics. The optical characteristics of these systems were extensively examined. The β-NaY0.8[Yb0.18Er0.02]F4 core-based systems exhibited exceptional visible emission intensity upon near-infrared excitation compared to β-NaY0.8[Yb0.2]F4 and β-NaY0.8[Er0.2]F4 core-based ones, making them particularly valuable for optical imaging. This robust emission allowed in vitro analysis through confocal imaging. The presence of a discontinuous shell around the β-NaY0.8[Yb0.18Er0.02]F4 core potentially contributed to its heightened emission, as a full thin layer could lead to emission quenching. Importantly, the co-doped β-NaY0.8[Yb0.18Er0.02]F4@γ-Fe2O3 system displayed low toxicity in both healthy and malignant mammalian cells. This makes it a promising candidate as bimodal probes for dual optical and magnetic resonance imaging. The rapid and straightforward nature of our process is a key advantage, particularly for industrial applications, setting the stage for the potential use of these nanoparticles in practical medical applications.Data availability
I submitted all my raw data and figures on the Recherche Data Gouv website. The link to the data is https://demo.recherche.data.gouv.fr/dataset.xhtml?persistentId=doi:10.82233/3RLEC2. The data must be checked by the CNRS Research data office first before the attribution of a DOI number.Author contributions
MP, WM and MP: methodology, investigation, data analysis, writing original draft and reviewing. VK, HK, SN and SGD: data curation and formal analysis. LBT: discussion, draft review. OS: NMR relaxometry, discussion draft review. RR and SAM: conceptualization, supervision, funding acquisition, writing, review and editing.Conflicts of interest
There are no conflicts to declare.Acknowledgements
This work was supported by grants from the ANR (Agence Nationale de la Recherche) program “Investissements d’Avenir” Labex SEAM (ANR 11 LABX 086, ANR 11 IDEX 05 02). The authors want also to thank Mrs Patricia Beaunier (Sorbonne University) for her technical assistance on TEM experiments.References
- F. Auzel, Chem. Rev., 2004, 104, 139–174 CrossRef CAS PubMed.
- Z. Chen, L. Zhang, Y. Sun, J. Hu and D. Wang, Adv. Funct. Mater., 2009, 19, 3815–3820 CrossRef CAS.
- A. Podhorodecki, M. Banski, A. Noculak, B. Sojka, G. Pawlik and J. Misiewicz, Nanoscale, 2013, 5, 429–436 RSC.
- Q. Xiao, Y. Ji, Z. Xiao, Y. Zhang, H. Lin and Q. Wang, Chem. Commun., 2013, 49, 1527–1529 RSC.
- M. Lin, Y. Zhao, S. Wang, M. Liu, Z. Duan, Y. Chen, F. Li, F. Xu and T. Lu, Biotechnol. Adv., 2012, 30, 1551–1561 CrossRef CAS PubMed.
- T. Soukka, T. Rantanen and K. Kuningas, Ann. N. Y. Acad. Sci., 2008, 1130, 188–200 CrossRef CAS PubMed.
- F. Wang and X. Liu, Chem. Soc. Rev., 2009, 38, 976–989 RSC.
- R. Abdul Jalil and Y. Zhang, Biomaterials, 2008, 29, 4122–4128 CrossRef CAS PubMed.
- D. K. Chatterjee, A. J. Rufaihah and Y. Zhang, Biomaterials, 2008, 29, 937–943 CrossRef CAS PubMed.
- Z. Chen, Q. Tian, Y. Song, J. Yang and J. Hu, J. Alloys Compd., 2010, 506, L17–L21 CrossRef CAS.
- H. Basti, L. Ben Tahar, L. Smiri, F. Herbst, M.-J. Vaulay, F. Chau, S. Ammar and S. Benderbous, J. Colloid Interface Sci., 2010, 341, 248–254 CrossRef CAS PubMed.
- R. A. Bini, R. F. C. Marques, F. J. Santos, J. A. Chaker and M. Jafelicci Jr., J. Magn. Magn. Mater., 2012, 324, 534–539 CrossRef CAS.
- S.-N. Sun, C. Wei, Z.-Z. Zhu, Y. Hou, S. S. Venkatraman, Z. J. Xu and S. S. Venkatraman, Chin. Phys. B, 2014, 23, 037503 CrossRef CAS.
- A. M. Alkilany, S. R. Abulateefeh, K. K. Mills, A. I. Bani Yaseen, M. A. Hamaly, H. S. Alkhatib, K. M. Aiedeh and J. W. Stone, Langmuir, 2014, 30, 13799–13808 CrossRef CAS PubMed.
- W. Mnasri, L. Ben Tahar, S. Nowak, D. AbiHaidar, M. Boissiere and S. Ammar, Mater. Sci. Eng. C, 2019, 94, 26–34 CrossRef CAS PubMed.
- W. Mnasri, L. Ben Tahar, P. Beaunier, D. Abi Haidar, M. Boissière, O. Sandre and S. Ammar, Nanomaterials, 2020, 10, 393 CrossRef CAS PubMed.
- L. Lutterotti, S. Matthies and H. R. Wenk, IUCr: Newsletter of the CPD, 1999, 21, 14–15 Search PubMed.
- M. W. Hull, NDT Technician Newsletter, 2017, 16, 1–6 Search PubMed.
- J. Xiao, Y. Song and Y. Li, Minerals, 2023, 13, 566 CrossRef CAS.
- E. Cheraghipour, S. Javadpour and A. R. Mehdizadeh, J. Biomed. Sci. Eng., 2012, 5, 25767 Search PubMed.
- A. H. Cahyana, D. Pratiwi and B. Ardiansah, IOP Conf. Ser.: Mater. Sci. Eng., 2017, 188, 012008 Search PubMed.
- H. Ezzaier, J. Alves Marins, C. Claudet, G. Hemery, O. Sandre and P. Kuzhir, Nanomaterials, 2018, 8, 623 CrossRef PubMed.
- A. Verma and F. Stellacci, Small, 2010, 6, 12–21 CrossRef CAS PubMed.
- F. Bertorelle, C. Wilhelm, J. Roger, F. Gazeau, C. Ménager and V. Cabuil, Langmuir, 2006, 22, 5385–5391 CrossRef CAS PubMed.
- E. C. Cho, J. W. Xie, P. A. Wurm and Y. N. Xia, Nano Lett., 2009, 9, 1080 CrossRef CAS PubMed.
- C. Wilhelm, C. Billotey, J. Roger, J. N. Pons, J. C. Bacri and F. Gazeau, Biomaterials, 2003, 24, 1001 CrossRef CAS PubMed.
- M. Lin, Y. Zhao, S. Wang, M. Liu, Z. Duan, Y. Chen, F. Li, F. Xu and T. Lu, Biotechnol. Adv., 2012, 30, 1551–1561 CrossRef CAS PubMed.
- J. Wild, A. Meijerink, J. K. Rath, W. G. J. H. M. van Sark and R. E. I. Schropp, Energy Environ. Sci., 2011, 4, 4835–4848 RSC.
- V. Bastos, P. Oskoei, E. Andresen, M. I. Saleh, B. Rühle, U. Resch-Genger and H. Oliveira, Sci. Rep., 2022, 12, 3770 CrossRef CAS PubMed.
- J. Kolosnjaj-Tabi, Y. Javed, L. Lartigue, J. Volatron, D. Elgrabli, I. Marangon, G. Pugliese, B. Caron, A. Figuerola, N. Luciani, T. Pellegrino, D. Alloyeau and F. Gazeau, ACS Nano, 2015, 9, 7925–7939 CrossRef CAS PubMed.
- V. Amendola, A. Guadagnini, S. Agnoli, D. Badocco, P. Pastore, G. Fracasso, M. Gerosa, F. Vurro, A. Busato and P. Marzola, J. Colloid Interface Sci., 2021, 96, 332–341 CrossRef PubMed.
- Q. L. Vuong, J.-F. Berret, J. Fresnais, Y. Gossuin and O. Sandre, Adv. Healthcare Mater., 2012, 1, 502–512 CrossRef CAS PubMed.
- M. Ehsan Sadat, S. L. Bud'ko, R. C. Ewing, H. Xu, G. M. Pauletti, D. B. Mast and D. Shi, Materials, 2023, 16, 496 CrossRef PubMed.
- M. Respaud, J. M. Broto, H. Rakoto, A. R. Fert, L. Thomas, B. Barbara, M. Verelst, E. Snoeck, P. Lecante, A. Mosset, J. Osuna, T. Ould Ely, C. Amiens and B. Chaudret, Phys. Rev. B: Condens. Matter Mater. Phys., 1998, 57, 2925–2935 CrossRef CAS.
- V. Sahinturk, S. Kacar, D. Vejselova and H. M. Kutlu, Toxicol. Ind. Health, 2018, 34, 481–489 CrossRef CAS PubMed.
- D. P. Saraiva, A. T. Matias, S. Braga, A. Jacinto and M. G. Cabral, Front. Oncol., 2020, 10, 1543 CrossRef PubMed.
- J. A. Frank, H. Kalish, E. K. Jordan, S. A. Anderson, E. Pawelczyk and A. S. Arbab, Mol. Imaging, 2007, 6, 212–221 CrossRef CAS PubMed.
- N. W. Roehm, G. H. Rodgers, S. M. Hatfield and A. L. Glasebrook, J. Immunol. Methods, 1991, 142, 257–265 CrossRef CAS PubMed.
Footnote |
| † Electronic supplementary information (ESI) available. See DOI: https://doi.org/10.1039/d4ra00909f |
| This journal is © The Royal Society of Chemistry 2024 |

