 Open Access Article
Eco-friendly spectrophotometric methods for concurrent analysis of phenol, 2-aminophenol, and 4-aminophenol in ternary mixtures and water samples: assessment of environmental sustainability
Muhammad S. Mustafa *a,
Nian N. Mohammadab,
Fuad H. Radhaa,
Kawan F. Kayani
 *acd,
Hewa O. Ghareeba and
Sewara J. Mohammed
 ef
ef
aDepartment of Chemistry, College of Science, University of Sulaimani, Qliasan St, Sulaymaniyah City, Kurdistan Region, 46002, Iraq. E-mail: muhammad.mustafa@univsul.edu.iq
bDepartment of Medical Laboratory Science, College of Science, Komar University of Science and Technology, Sulaimani City, Kurdistan Region, Iraq
cDepartment of Chemistry, College of Science, Charmo University, Peshawa Street, Chamchamal, Sulaymaniyah City, 46023, Iraq
dDepartment of Pharmacy, Kurdistan Technical Institute, Sulaymaniyah City, Iraq
eAnesthesia Department, College of Health Sciences, Cihan University Sulaimaniya, Sulaimaniya, Kurdistan Region 46001, Iraq
fResearch and Development Center, University of Sulaimani, Kurdistan Regional Government, Qlyasan Street, Sulaymaniyah, 46001, Iraq
First published on 17th May 2024
Abstract
Recently, there has been a high demand for green procedures in analytical chemistry, particularly those utilizing eco-friendly solvents. In this context, three feasible derivative UV spectrophotometric methods namely, derivative ratio-zero crossing spectra (DRZCS), double divisor ratio spectra (DDRS), and successive derivative subtraction coupled with constant multiplication (SDS-CM) were developed to quantify a ternary mixture of phenol (P), 2-aminophenol (2-AP), and 4-aminophenol (4-AP) in real water samples simultaneously, using ethanol as a solvent. The established methods demonstrated a good linear range, covering 2–60 μg mL−1 for P and 2–50 μg mL−1 for 2-AP and 4-AP, in all approaches with a high correlation coefficient (R2 ≥ 0.9995). In compliance with ICH guidelines, the methods exhibited acceptable precision and accuracy, as indicated by good spike recovery with low relative standard deviations. The eco-friendliness of the UV spectrophotometric approach was assessed using analytical eco-scale (AES), analytical greenness (AGREE), and analytical greenness metrics for sample preparation (AGREEprep). These evaluations confirmed the eco-friendliness of the proposed methods in terms of solvents, energy consumption, and waste generation. The proposed procedure proved to be efficient in quantifying each component in laboratory-synthesized mixtures and real water samples, thanks to its simplicity, accuracy, sensitivity, and cost-effectiveness.
1. Introduction
Phenolic compounds are recognized as environmental pollutants, exerting a significant impact on water quality and marine life.1–4 Phenol (P), the simplest aromatic alcohol, finds applications in pesticides, herbicides, explosives, dyes, polymers, and drugs.2,5 The substitution reaction of phenol with amines produces various derivatives, including amino derivatives like 2-aminophenol (2-AP) and 4-aminophenol (4-AP), which are utilized in rubber manufacturing, the photosensitive materials sector, and other industries.3,4,6 The presence of these phenolic compounds in ecosystems is associated with the production and degradation of pesticides, as well as urban and industrial sewage.7–13 4-AP, a critical chemical in various industries, serves as a photographer's developer and a medicinal and dye intermediate. Notably, it is employed in the synthesis of paracetamol and the production of sulfur and azo dyes, crucial in textile, leather, and alimentary industries.14 Nearly 90% of the current domestic 4-AP use contributes to synthetic paracetamol production, making it the world's most popular antipyretic analgesic drug, representing 45 percent of the total antipyretic analgesic pharmaceutical market. Exposure to phenolic compounds raises health concerns, including mutations, skin allergies, asthma-like reactions, and an increased risk of cancer.15,16 Additionally, even at lower toxicological concentrations, phenols can impart an unpleasant taste and odor to water, challenging conventional water treatment methods.17 Consequently, there is an urgent need to establish suitable analytical procedures for the quantification of phenolic compounds in environmental analysis and water sample quality control.Several analytical techniques have been developed for the determination and characterization of phenolic pollutants, such as HPLC/GC, HPLC/MS, capillary electrophoresis,18–24 and electrochemical approaches.25–28 UV-spectrophotometry stands out as one of the easiest and most convenient methods of analysis. However, a primary challenge in spectrophotometric multicomponent analysis is identifying the presence of multiple compounds in a mixture with overlapping spectra, without prior separation. Among the spectrophotometric techniques used for such scenarios, derivative spectrophotometry (DS) offers a broader range of applicability in terms of usability and sensitivity. Its applications extend across various fields, including pharmaceutical, clinical, environmental, and both inorganic and organic analysis.29–33
This work aims to develop a sensitive, straightforward, and time-saving spectrophotometric method for simultaneously quantifying three components: P, 2-AP, and 4-AP in a ternary mixture without interference and pre-separation. The first method, derivative ratio-zero crossing spectra (DRZCS), is based on computing the first derivative of ratio spectra and measuring peak amplitude, with one component used as a divisor while the zero crossing of another component is considered. The second method, double divisor ratio spectra (DDRS), involves the use of the first derivative ratio spectrum computed by dividing the absorption spectrum of the ternary mixture by the standard absorption spectrum of the binary mixture of the ternary combination. The third method, successive derivative subtraction coupled with constant multiplication (SDS-CM) for the first derivative spectrum, allows the components of a ternary mixture to be measured from their resolved first derivative spectra.
All spectrophotometric approaches were validated following ICH guidelines. The specificity of these methods was assessed by examining laboratory-made mixtures with varying proportions of P, 2-AP, and 4-AP, and the resulting data were satisfactory within the calibration range. Additionally, these approaches were applied to determine the quantities of these compounds in tap and mineral water samples. The developed methods utilize safe solvents, aligning with eco-friendly practices, as confirmed by the analytical greenness procedure.
2. Experimental
2.1 Instrumentation and software
All spectral measurements were performed using an Agilent Cary 60 UV-vis spectrophotometer equipped with a quartz cell (1 cm optical path length) and Cary Win software (version 2.0). Spectra were collected in the wavelength range of 200–400 nm with a 1 nm interval, utilizing a scan rate of 600 nm min−1. For the evaluation of greenness, AGREE software version 0.5 beta and AGREEprep served as the metric tool for assessing the eco-friendliness of the methods.2.2 Materials
Analytical-grade chemicals from Merck and Scharlau were exclusively employed throughout the experiments. Phenol (P, purity ≥ 98%), 2-aminophenol (2-AP, purity 99%), 4-aminophenol (4-AP, purity 99.5%), and ethanol (purity 99.9%) were supplied by these sources.2.3 Standard solutions
Separate standard stock solutions of 100 μg mL−1 for each of P, 2-AP, and 4-AP were prepared in ethanol.2.4 Procedures
![[thin space (1/6-em)]](https://www.rsc.org/images/entities/char_2009.gif) :
:![[thin space (1/6-em)]](https://www.rsc.org/images/entities/char_2009.gif) water (1
water (1![[thin space (1/6-em)]](https://www.rsc.org/images/entities/char_2009.gif) :
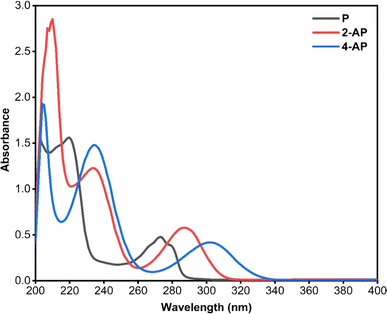
:![[thin space (1/6-em)]](https://www.rsc.org/images/entities/char_2009.gif) 1) as a blank. These spectra were overlaid to assess the extent of overlapping and determine appropriate analysis methods for the simultaneous presence of the three compounds. Fig. 1 illustrates the overlapping spectra.
1) as a blank. These spectra were overlaid to assess the extent of overlapping and determine appropriate analysis methods for the simultaneous presence of the three compounds. Fig. 1 illustrates the overlapping spectra.
![[thin space (1/6-em)]](https://www.rsc.org/images/entities/char_2009.gif) :
:![[thin space (1/6-em)]](https://www.rsc.org/images/entities/char_2009.gif) water (1
water (1![[thin space (1/6-em)]](https://www.rsc.org/images/entities/char_2009.gif) :
:![[thin space (1/6-em)]](https://www.rsc.org/images/entities/char_2009.gif) 1). The absorption spectra of these solutions were scanned in the (200–400 nm) range and saved on the computer.
1). The absorption spectra of these solutions were scanned in the (200–400 nm) range and saved on the computer.Following the aforementioned procedure, the saved absorption spectra of separate aliquots of 2-AP and 4-AP were divided by the standard absorption spectrum of the respective divisor. For 2-AP, the divisor was 4-AP, and vice versa, with a divisor concentration of 3 μg mL−1. This process yielded the ratio spectra, and subsequently, the first derivative of these ratio spectra was obtained using Δλ = 8 nm. The peak amplitude values of the derivative at 296 nm for 2-AP and at 320 nm for 4-AP (both representing zero-crossing points for P) were quantitatively measured. Based on these results, calibration graphs were plotted for the concentrations of P, 2-AP, and 4-AP, correlating with their respective analytical signals. Finally, linear regression equations were computed.
3. Results and discussion
In today's analytical landscape, the demand for straightforward, rapid, cost-effective, accurate, precise, and eco-friendly methods related to quality control, routine analysis, and environmental monitoring has led to the development of various spectrophotometric techniques, including derivative or ratio derivative spectrophotometry.34,35 Unlike hyphenated analytical instruments such as HPLC, GC, or capillary electrophoresis, spectrophotometric procedures eliminate the need for pre-analysis steps like derivatization, extraction, or other complex processes, thereby saving time and costs. However, a notable drawback of spectrophotometric methods is their lower selectivity compared to hyphenated techniques. This limitation has been addressed in modern spectrophotometric devices, which are supported by software enabling the storage of absorption spectra and performing mathematical processes, such as addition, subtraction, multiplication, and derivatization, as a means to enhance selectivity.36All the aforementioned considerations should be taken into account during the development of a spectrophotometric approach for multicomponent analysis with overlapped absorption spectra. The absorption spectra of P, 2-AP, and 4-AP were found to be closely overlapped in the entire region of 200–340 nm, as illustrated in Fig. 1. Direct quantification using ordinary zero-order spectrophotometry was thus impossible. The primary objective of this research was to establish a straightforward, sensitive, accurate, and resolving spectrophotometric approach for the simultaneous estimation of P, 2-AP, and 4-AP in their ternary mixtures and real water samples. While numerous methods for analyzing P, 2-AP, and 4-AP individually have been documented,37–39 no established spectrophotometric methods for their mixture analysis exist.
3.1 Derivative ratio – zero crossing spectra (DRZCS)
Derivative spectrophotometry is a well-established method for increasing the specificity and selectivity of UV-absorption spectra of analytes in a multicomponent chemical mixture. This is accomplished by improving the resolution of overlapping spectra. Despite this, it provides a reasonable solution for many defined analytical situations, including the elimination of sample turbidity interference, matrix interferences, baseline shift, and improvement of spectral details.40,41 Additionally, it can be implemented to quantify one analyte in the presence of another by a wavelength at which one of the compounds has nearly zero contribution, while the other compound has a measurable contribution.Fig. 2 depicts the first-order derivative ratio spectra of various concentrations of pure P and 40 μg mL−1 of 2-AP when 10 μg mL−1 of 4-AP is utilized as a divisor, with Δλ set at 8 nm. As seen, the spectra of P demonstrate a single maximum at 264 nm and two minima at 225 and 280 nm, while the 2-AP spectrum has zero-crossings at 256 and 280 nm, where P exhibits significant absorption. The peak amplitude spectra of P are low at 256 nm but higher at 280 nm. For the determination of P, 280 nm was selected as the working wavelength since it provides optimal results regarding linearity and sensitivity.
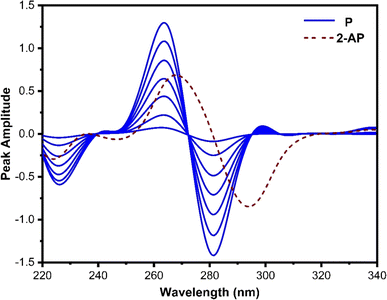 | ||
| Fig. 2 First derivative ratio spectra of P (2, 10, 20, 30, 40, 50, and 60 μg mL−1) and 40 μg mL−1 of 2-AP. 10 μg mL−1 of 4-AP was used as a divisor. | ||
Fig. 3 shows the first-order derivative ratio spectra of different concentrations of pure 2-AP and 40 μg mL−1 of P when 3 μg mL−1 of 4-AP is used as a divisor, with Δλ set at 8 nm. The spectra of 2-AP in this figure exhibit one maximum at 272 nm and one minimum at 296 nm. At both wavelengths, the P spectrum has zero-crossings, and 2-AP has some absorption. At 272 nm, the peak amplitude spectra of 2-AP are low with inaccurate recovery, while at 296 nm, the peak amplitude spectra show a wide range of linearity and good recovery. Thus, 296 nm was chosen as the working wavelength for the estimation of 2-AP.
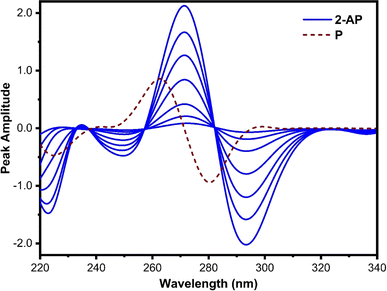 | ||
| Fig. 3 First derivative ratio spectra of 2-AP (2, 5, 10, 20, 30, 40, and 50 μg mL−1) and 40 μg mL−1 of P. 3 μg mL−1 of 4-AP was used as a divisor. | ||
In Fig. 4, the first-order derivative ratio spectra of varied concentrations of pure 4-AP and 40 μg mL−1 of P, with 3 μg mL−1 of 2-AP employed as a divisor and Δλ set at 8 nm, are represented. From the 4-AP spectra, a significant maximum at 304 and a minimum at 320 nm can be observed. Here, the 2-AP spectrum has zero-crossings where the 4-AP has some absorption. Since the peak amplitude spectra of 4-AP at 320 nm display better sensitivity, it was chosen as the working wavelength to determine 4-AP.
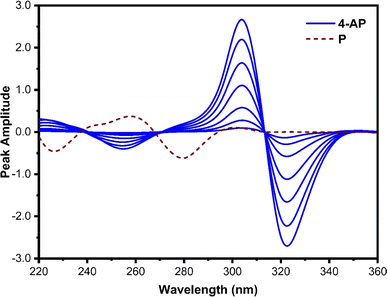 | ||
| Fig. 4 First derivative ratio spectra of 4-AP (2, 5, 10, 20, 30, 40, and 50 μg mL−1) and 30 μg mL−1 of P. 3 μg mL−1 of 2-AP was used as a divisor. | ||
To optimize the resulting first derivative ratio-spectra, the impact of Δλ and divisor concentration were examined. A satisfactory signal-to-noise ratio was achieved with Δλ set at 8 nm, and the spectra exhibited good resolution. Standard solutions of 10 μg mL−1 of 4-AP, 3 μg mL−1 of 4-AP, and 3 μg mL−1 of 2-AP were chosen as the most suitable divisor concentrations in terms of sensitivity and percent recovery for the estimation of P, 2-AP, and 4-AP, respectively.
3.2 Double divisor ratio spectra (DDRS)
This technique, proposed by Dinç and colleagues, is utilized for estimating analytes in ternary mixtures.42 The process involves computing the derivative of the ratio absorption spectrum, achieved by dividing the ternary mixture spectrum by the spectrum of a standard solution containing a binary mixture of two out of the three constituents of the analyzing mixture. The main advantage of this approach is that no zero-crossing point is required for analyte quantification, in contrast to zero-crossing spectrophotometric methods. However, it should be noted that the concurrent spectra were applied for the estimation of analytes at either the minimum or maximum peaks.In this method, various factors influence both the first derivative ratio spectra and the determination of individual constituents in the ternary mixture. Selecting the appropriate working wavelength is a crucial step. The first-order ratio derivative of P (refer to Fig. 5) revealed several minima and maxima peaks. However, 280 nm was chosen as the working wavelength because the spectra of pure P and its ternary mixture must coincide in the wavelength spectral region while also exhibiting good linearity, selectivity, and recovery. Consequently, 296 nm (as illustrated in Fig. 6) and 320 nm (as illustrated in Fig. 7) were chosen as suitable wavelengths for quantifying 2-AP and 4-AP, respectively.
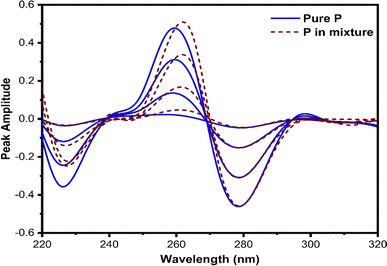 | ||
| Fig. 5 The coincident first-order derivative ratio spectra of pure P and ternary mixtures, using 5 μg mL−1 of 2-AP and 4-AP as a double divisor. | ||
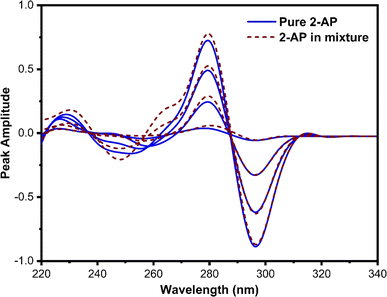 | ||
| Fig. 6 The coincident first-order derivative ratio spectra of pure 2-AP and ternary mixtures, using 4 μg mL−1 of P and 4-AP as a double divisor. | ||
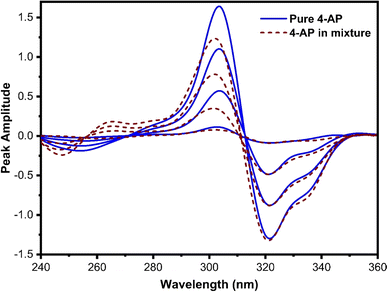 | ||
| Fig. 7 The coincident first-order derivative ratio spectra of pure 4-AP and ternary mixtures, using 3 μg mL−1 of P and 2-AP as a double divisor. | ||
The divisor concentration is another factor that enhances the sensitivity of this approach by reducing experimental errors and background noise. Therefore, various concentrations of standard solutions of binary mixtures, termed ‘double divisors,’ were examined. Equal concentrations of divisors, specifically 5 μg mL−1 of each (2-AP and 4-AP), 4 μg mL−1 of each (P and 4-AP), and 3 μg mL−1 of each (P and 2-AP), were chosen for the quantification of P, 2-AP, and 4-AP, respectively. Finally, the effects of Δλ on the first derivative of the ratio spectra were investigated in terms of signal-to-noise ratio and sensitivity. Various wavelengths (1–10 nm) were explored, with 8 nm demonstrating the highest analytical signal and sensitivity. Consequently, a derivatization wavelength of 8 nm was chosen for all analytes.
3.3 Successive derivative subtraction coupled with constant multiplication (SDS-CM)
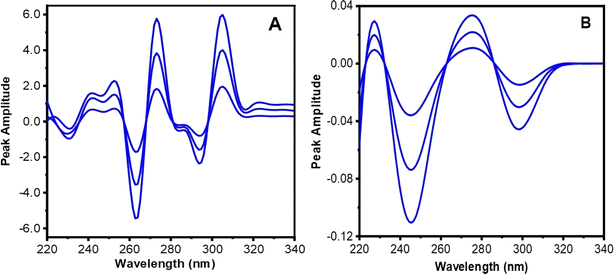
SDS-CM is a technique that leverages the first derivative spectra of a ternary mixture to separate and quantify its components. The underlying principle is based on the observation that the derivative spectra of the components exhibit different wavelength ranges. The component with the longest range can be subtracted from the mixture spectrum by multiplying it with a constant factor. This process is repeated for the other components until the entire mixture spectrum is resolved. The constant factors can be calculated using either the balance point or the graphical method.43–45 In the case of the ternary mixture of P, 2-AP, and 4-AP, the UV-spectrum of 4-AP had a longer extension than 2-AP, which, in turn, was more extended than P. Therefore, the SDS-CM approach was developed to progressively resolve the components of the ternary combination.In the current research, the obtained ratio spectra of the first derivative for ternary combinations (P, 2-AP, and 4-AP) in Fig. 8A were computed using the first derivative standard spectrum of 30 μg mL−1 of 4-AP as a divisor. As depicted in the figure, a constant for each synthetic combination formed a straight line parallel to the wavelength axis within the expanded region from 312 to 340 nm. After accurately measuring this constant and multiplying it by the first derivative divisor spectrum of 4-AP, the original first derivative of 4-AP was obtained, as illustrated in Fig. 8B. The value of the peak amplitude at P312–288 was then measured and substituted into its corresponding regression equation to determine the quantity of 4-AP in the ternary mixture.
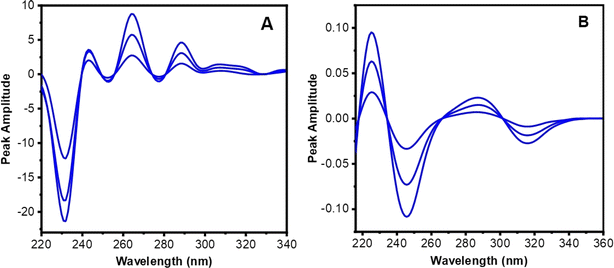
The first derivative spectra of binary combinations (P and 2-AP) were obtained by subtracting the constant and multiplying the result by the first derivative of the divisor spectrum. The resulting ratio spectra of the first derivative for the binary mixtures, as shown in Fig. 9A, were processed using the first derivative standard spectrum of 20 μg mL−1 of 2-AP as a divisor. As illustrated in the figure, the ratio spectra revealed a constant plateau extension from 304 to 312 nm aligned to the λ-axis. Multiplying this constant by the first derivative spectrum of the divisor 2-AP yielded the first derivative spectrum of 2-AP, as portrayed in Fig. 9B. The peak-to-peak amplitude value of the achieved spectrum was measured at P296–272 and substituted into its linear regression relation to estimate the quantity of 2-AP in the binary mixture.
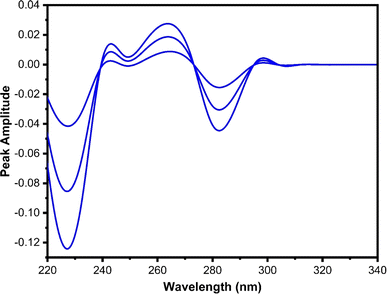
The constant obtained from Fig. 9A was subtracted and multiplied by the first derivative spectrum of the divisor 2-AP. This step aimed to eliminate 2-AP in the binary mixture and regain the initial first derivative spectrum of P, as illustrated in Fig. 10. The peak amplitude of the first derivative (peak to zero baseline) was measured at 280 nm and substituted into its regression relation to determine the quantity of P.
The selection of the divisor and its concentration are crucial steps for obtaining the ratio spectrum in successive derivative subtraction. Therefore, various concentrations of 4-AP (5, 10, 20, 30, and 40 μg mL−1) and 2-AP (5, 10, 20, and 30 μg mL−1) were studied as divisors. The concentrations of 30 μg mL−1 of 4-AP and 20 μg mL−1 of 2-AP yielded the best results, exhibiting constant alignment to the wavelength x-axis, minimal noise, maximum sensitivity, and percent recovery when used for the estimation of P, 2-AP, and 4-AP in their ternary combinations.
The impact of Δλ on the derivative spectrum was explored, with Δλ = 8 nm demonstrating a satisfactory signal-to-noise ratio and good spectral resolution. The principal advantage of SDS-CM lies in recovering the first derivative spectrum of an individual constituent in the mixture as a pure spectrum, free from other spectral contributions. Consequently, the derivative spectra of each component enable a peak-to-peak assessment, resulting in an enhanced peak amplitude value and sensitivity compared to the peak-to-baseline derivative approach. Accordingly, the peak-to-peak method was employed for quantifying 2-AP and 4-AP.
3.4 Method validation
The validation of the spectrophotometric procedures aimed to ensure that the selected methods yield analytical data suitable for their intended use, following the guidelines outlined by the International Council for Harmonisation of Technical Requirements for Pharmaceuticals for Human Use (ICH).46 The validity of the methods was assessed in terms of range and linearity, as well as the determination of the limit of detection (LOD) and quantification (LOQ). Additionally, the evaluation included examinations of accuracy, precision, selectivity, and the stability of analytes during the application of analytical procedures and under different storage conditions.3.5 Range and linearity
The assessment of linearity involved triplicate quantification of varied concentrations of P, 2-AP, and 4-AP within the respective limits of 2–60, 2–50, and 2–50 μg mL−1. The obtained calibration curves demonstrated high correlation coefficients (R2), indicating the robust linearity of the methods. The standard deviations for the slopes and intercepts were calculated, with their low values affirming the precision and reliability of the calibration curves. All analytical procedures were executed under optimum conditions, and the resulting regression parameters are summarized in Table 1.| Parameters | P | 2-AP | 4-AP | ||||||
|---|---|---|---|---|---|---|---|---|---|
| DRZCS | DDRS | SDS-CM | DRZCS | DDRS | SDS-CM | DRZCS | DDRS | SDS-CM | |
| a Mean of three various quantities (n = 3) repeated three times per day.b Mean of three various quantities (n = 3) repeated three times in three successive days. | |||||||||
| Wavelength (nm) | 280 | 280 | 280 | 296 | 296 | P296–272 | 320 | 320 | P312–288 |
| Range of linearity (μg mL−1) | 2–60 | 2–60 | 2–60 | 2–50 | 2–50 | 2–50 | 2–50 | 2–50 | 2–50 |
| Slope | −0.0243 | −0.0163 | −0.0014 | −0.0382 | −0.0284 | −0.00268 | −0.0521 | −0.0418 | −0.0017 |
| Intercept | −0.0104 | 0.0095 | −0.0003 | 0.0110 | 0.0047 | −0.0003 | −0.0174 | −0.0116 | 0.0002 |
| SD of slope | 0.0061 | 0.0004 | 0.0006 | 0.0006 | 0.0008 | 0.0002 | 0.0026 | 0.008 | 0.0004 |
| SD of intercept | 0.0042 | 0.0027 | 0.00021 | 0.0039 | 0.0024 | 0.0004 | 0.0061 | 0.0048 | 0.0003 |
| R2 | 0.9998 | 0.9996 | 0.9997 | 0.9996 | 0.9999 | 0.9998 | 0.9995 | 0.9995 | 0.9998 |
| LOD (μg mL−1) | 0.57 | 0.55 | 0.51 | 0.34 | 0.28 | 0.49 | 0.38 | 0.34 | 0.58 |
| LOQ (μg mL−1) | 1.73 | 1.65 | 1.54 | 1.03 | 0.85 | 1.48 | 1.17 | 1.13 | 1.76 |
| Intra-day accuracya (%R ± SD) | 100.05 ± 0.20 | 100.19 ± 0.36 | 100.30 ± 0.10 | 100.35 ± 0.13 | 100.75 ± 0.16 | 100.07 ± 0.15 | 99.85 ± 0.16 | 100.01 ± 0.26 | 100.45 ± 0.15 |
| Inter-day accuracyb (%R ± SD) | 99.14 ± 0.38 | 100.56 ± 0.41 | 100.30 ± 0.21 | 100.79 ± 0.15 | 100.48 ± 0.22 | 99.62 ± 0.32 | 99.57 ± 0.29 | 99.88 ± 0.32 | 98.45 ± 0.31 |
| Intra-day precisiona (%RSD) | 0.57 | 0.95 | 0.31 | 0.50 | 0.75 | 0.63 | 0.83 | 0.97 | 0.51 |
| Inter-day precisionb (%RSD) | 1.24 | 1.21 | 0.86 | 0.78 | 1.12 | 1.26 | 1.21 | 1.31 | 1.18 |
3.6 Limit of detection and quantification
The LOD of analytical approaches signifies the minimum amount of analyte in a test sample that can be detected, and it is not necessarily required to be estimated as an exact value. On the other hand, the LOQ represents the minimum quantity of an analyte that can be quantitatively analyzed under optimized experimental conditions.47 Consequently, both the LOD and LOQ serve as indicators of the selectivity of analytical methods, and they were calculated using the following formula:| LOD = 3.3σ/δ and LOQ = 10σ/δ | (1) |
Hence, σ represents the standard deviation of intercepts of calibration lines and δ signifies the slope of the standard graph. The high sensitivity of the procedures was established by a low value of the LOD and LOQ as tabulated in Table 1.
Table 2 illustrates a comparison between the recommended approaches for measuring P, 2-AP, and 4-AP and existing methods. The proposed techniques demonstrate a distinctive method for concurrently detecting all three compounds with acceptable limits of detection and dynamic range. Currently, there are no documented instances of simultaneous detection of these compounds.
| Method | Analyte | Dynamic range (μg mL−1) | LOD (μg mL−1) | Ref. |
|---|---|---|---|---|
| a DRZCS.b DDRS.c SDS-CM. | ||||
| HPLC | P | 0.0015–10.0000 | 0.0004–0.0133 | 48 |
| Gas chromatography | P | 0.1 × 10⁻³ to 1.0 × 10⁻² | 0.25 × 10⁻³ | 49 |
| Electrochemical | 2-AP | 9.41 × 10⁻⁴ to 9.41 × 10⁻² | 8.65 × 10⁻⁴ | 50 |
| Voltammetry | 2-AP | 4.70 × 10⁻³ to 1.88 | 1.50 × 10⁻³ | 51 |
| Electrochemical | 2-AP | 0.0109–7.6391 | 1.9643 × 10⁻³ | 52 |
| 4-AP | 0.0109–6.002 | 1.2004 × 10⁻³ | ||
| Spectrophotometric | P | 2–60 | 0.57,a 0.55,b 0.51c | This work |
| 2-AP | 2–50 | 0.34,a 0.28,b 0.49c | ||
| 4-AP | 2–50 | 0.38,a 0.34,b 0.58c | ||
3.7 Accuracy and precision
Intra-day and inter-day accuracy and precision were assessed by analyzing three various quantities in triplicate, spanning from the low to medium and high regions of the calibration range. Concentrations of P (5, 35, and 55 μg mL−1), 2-AP (5, 25, and 50 μg mL−1), and 4-AP (5, 25, and 50 μg mL−1) were analyzed within the same day for intra-day evaluations, and the same solutions were analyzed for three consecutive days for inter-day assessments. The concentrations were determined using all three approaches from corresponding regression formulations. Accuracy, expressed as percent recovery, ranged from 98.45% to 100.79%. Precision, evaluated as percent relative standard deviation (RSD), was approximately 2%.3.8 Selectivity
The term ‘selectivity’ refers to the capability of an analytical method to accurately quantify specific analytes in multicomponent chemical constituents or matrices, without interference from other constituents with similar properties. The selectivity of the proposed approaches was validated through the analysis of various laboratory-made mixtures containing different ratios of P, 2-AP, and 4-AP. In Table 3, the high percent recovery and low standard deviation confirm the acceptability of the results. Furthermore, the obtained data indicate that the developed methods are robust for estimating and resolving ternary combinations in different proportions.Ratio of P![[thin space (1/6-em)]](https://www.rsc.org/images/entities/char_2009.gif) : :![[thin space (1/6-em)]](https://www.rsc.org/images/entities/char_2009.gif) 2-AP 2-AP![[thin space (1/6-em)]](https://www.rsc.org/images/entities/char_2009.gif) : :![[thin space (1/6-em)]](https://www.rsc.org/images/entities/char_2009.gif) 4-AP (μg mL−1) 4-AP (μg mL−1) |
P | 2-AP | 4-AP | ||||||
|---|---|---|---|---|---|---|---|---|---|
| (%recovery ± SD)a | (%recovery ± SD)a | (%recovery ± SD)a | |||||||
| DRZCS | DDRS | SDS-CM | RDZCS | DDRS | SDS-CM | DRZCS | DDRS | SDS-CM | |
| a Mean of three determinations. | |||||||||
2![[thin space (1/6-em)]](https://www.rsc.org/images/entities/char_2009.gif) : :![[thin space (1/6-em)]](https://www.rsc.org/images/entities/char_2009.gif) 2 2![[thin space (1/6-em)]](https://www.rsc.org/images/entities/char_2009.gif) : :![[thin space (1/6-em)]](https://www.rsc.org/images/entities/char_2009.gif) 2 2 |
101.34 ± 0.43 | 100.70 ± 0.13 | 99.15 ± 0.16 | 98.59 ± 0.14 | 100.52 ± 0.11 | 98.59 ± 0.14 | 100.41 ± 0.05 | 99.23 ± 0.06 | 99.08 ± 0.17 |
10![[thin space (1/6-em)]](https://www.rsc.org/images/entities/char_2009.gif) : :![[thin space (1/6-em)]](https://www.rsc.org/images/entities/char_2009.gif) 10 10![[thin space (1/6-em)]](https://www.rsc.org/images/entities/char_2009.gif) : :![[thin space (1/6-em)]](https://www.rsc.org/images/entities/char_2009.gif) 3 3 |
98.99 ± 0.47 | 100.06 ± 0.15 | 99.41 ± 0.25 | 99.77 ± 0.18 | 99.84 ± 0.12 | 98.70 ± 0.14 | 98.87 ± 0.22 | 99.76 ± 0.22 | 100.48 ± 0.32 |
3![[thin space (1/6-em)]](https://www.rsc.org/images/entities/char_2009.gif) : :![[thin space (1/6-em)]](https://www.rsc.org/images/entities/char_2009.gif) 10 10![[thin space (1/6-em)]](https://www.rsc.org/images/entities/char_2009.gif) : :![[thin space (1/6-em)]](https://www.rsc.org/images/entities/char_2009.gif) 10 10 |
100.08 ± 0.38 | 101.42 ± 0.66 | 98.79 ± 0.27 | 99.17 ± 0.22 | 100.09 ± 0.08 | 100.01 ± 0.14 | 98.38 ± 0.24 | 99.90 ± 0.26 | 100.79 ± 0.28 |
3![[thin space (1/6-em)]](https://www.rsc.org/images/entities/char_2009.gif) : :![[thin space (1/6-em)]](https://www.rsc.org/images/entities/char_2009.gif) 3 3![[thin space (1/6-em)]](https://www.rsc.org/images/entities/char_2009.gif) : :![[thin space (1/6-em)]](https://www.rsc.org/images/entities/char_2009.gif) 30 30 |
98.51 ± 0.31 | 98.46 ± 0.56 | 100.14 ± 0.21 | 100.56 ± 0.07 | 101.76 ± 0.04 | 99.88 ± 0.14 | 98.56 ± 0.43 | 98.52 ± 0.18 | 98.09 ± 0.22 |
30![[thin space (1/6-em)]](https://www.rsc.org/images/entities/char_2009.gif) : :![[thin space (1/6-em)]](https://www.rsc.org/images/entities/char_2009.gif) 3 3![[thin space (1/6-em)]](https://www.rsc.org/images/entities/char_2009.gif) : :![[thin space (1/6-em)]](https://www.rsc.org/images/entities/char_2009.gif) 3 3 |
98.32 ± 0.35 | 99.13 ± 0.35 | 99.54 ± 0.41 | 100.58 ± 0.24 | 100.35 ± 0.28 | 97.87 ± 0.14 | 99.33 ± 0.26 | 100.88 ± 0.32 | 98.04 ± 0.37 |
3![[thin space (1/6-em)]](https://www.rsc.org/images/entities/char_2009.gif) : :![[thin space (1/6-em)]](https://www.rsc.org/images/entities/char_2009.gif) 30 30![[thin space (1/6-em)]](https://www.rsc.org/images/entities/char_2009.gif) : :![[thin space (1/6-em)]](https://www.rsc.org/images/entities/char_2009.gif) 3 3 |
99.27 ± 0.49 | 101.18 ± 0.25 | 101.10 ± 0.12 | 100.15 ± 0.30 | 99.32 ± 0.15 | 99.24 ± 0.14 | 99.26 ± 0.25 | 99.43 ± 0.21 | 99.22 ± 0.22 |
| Mean ± SD | 99.42 ± 0.40 | 100.31 ± 0.35 | 99.69 ± 0.24 | 99.80 ± 0.19 | 100.31 ± 0.13 | 99.05 ± 0.17 | 99.13 ± 0.24 | 99.62 ± 0.21 | 99.28 ± 0.26 |
3.9 Stability studies of solution
The stability of the stock standard solutions was investigated over different time periods. The prepared stock solutions in ethanol were found to be stable for one week when stored in the refrigerator at 4 °C. During this period, no significant dissimilarity was detected in the assay results obtained using the suggested methods. To prevent errors arising from ethanol evaporation and the instability of 2-AP and 4-AP solutions in the presence of light, it is recommended to store the solutions for one week in a refrigerator at 4 °C.3.10 Application of the proposed methods
To demonstrate the potential analytical applicability, the developed methods were applied to the analysis of real samples, specifically tap water and mineral water samples. The tap and natural mineral water underwent practical analysis with some modifications to the general procedure. In the preliminary test, no peaks appeared on the absorption spectrum of unspiked real samples in the working wavelength region. Furthermore, the effect of the sample matrix was minimized by diluting the water samples within the linear range of the calibration curve. For this purpose, 2 mL of real samples were taken, spiked with various ratios of P, 2-AP, and 4-AP, and then diluted in a 25 mL volumetric flask using ethanol![[thin space (1/6-em)]](https://www.rsc.org/images/entities/char_2009.gif) :
:![[thin space (1/6-em)]](https://www.rsc.org/images/entities/char_2009.gif) water (1
water (1![[thin space (1/6-em)]](https://www.rsc.org/images/entities/char_2009.gif) :
:![[thin space (1/6-em)]](https://www.rsc.org/images/entities/char_2009.gif) 1). The results, as listed in Table 4, indicate that the average spiked recovery and the RSD fell within the range of 98.22% to 101.49% and 1.12% to 2.10%, respectively. Based on these data, the proposed methods under the optimized conditions were found to be superior for the quantification of P, 2-AP, and 4-AP in real water samples.
1). The results, as listed in Table 4, indicate that the average spiked recovery and the RSD fell within the range of 98.22% to 101.49% and 1.12% to 2.10%, respectively. Based on these data, the proposed methods under the optimized conditions were found to be superior for the quantification of P, 2-AP, and 4-AP in real water samples.
| Sample | Spiked added (μg mL−1) P![[thin space (1/6-em)]](https://www.rsc.org/images/entities/char_2009.gif) : :![[thin space (1/6-em)]](https://www.rsc.org/images/entities/char_2009.gif) 2-AP 2-AP![[thin space (1/6-em)]](https://www.rsc.org/images/entities/char_2009.gif) : :![[thin space (1/6-em)]](https://www.rsc.org/images/entities/char_2009.gif) 4-AP 4-AP |
P | 4-AP | 4-AP | ||||||
|---|---|---|---|---|---|---|---|---|---|---|
| Spike recoverya (%) | ||||||||||
| DRZCS | DDRS | SDS-CM | DRZCS | DDRS | SDS-CM | DRZCS | DDRS | SDS-CM | ||
| a Mean of three determinations. | ||||||||||
| Tap water | 3![[thin space (1/6-em)]](https://www.rsc.org/images/entities/char_2009.gif) : :![[thin space (1/6-em)]](https://www.rsc.org/images/entities/char_2009.gif) 3 3![[thin space (1/6-em)]](https://www.rsc.org/images/entities/char_2009.gif) : :![[thin space (1/6-em)]](https://www.rsc.org/images/entities/char_2009.gif) 3 3 |
103.32 | 100.94 | 97.78 | 98.51 | 99.56 | 99.78 | 97.86 | 97.13 | 100.61 |
20![[thin space (1/6-em)]](https://www.rsc.org/images/entities/char_2009.gif) : :![[thin space (1/6-em)]](https://www.rsc.org/images/entities/char_2009.gif) 2 2![[thin space (1/6-em)]](https://www.rsc.org/images/entities/char_2009.gif) : :![[thin space (1/6-em)]](https://www.rsc.org/images/entities/char_2009.gif) 2 2 |
101.22 | 101.48 | 99.52 | 98.56 | 101.48 | 102.22 | 98.43 | 97.15 | 98.32 | |
2![[thin space (1/6-em)]](https://www.rsc.org/images/entities/char_2009.gif) : :![[thin space (1/6-em)]](https://www.rsc.org/images/entities/char_2009.gif) 20 20![[thin space (1/6-em)]](https://www.rsc.org/images/entities/char_2009.gif) : :![[thin space (1/6-em)]](https://www.rsc.org/images/entities/char_2009.gif) 2 2 |
101.67 | 95.54 | 101.01 | 99.93 | 103.32 | 102.74 | 97.04 | 99.91 | 102.06 | |
2![[thin space (1/6-em)]](https://www.rsc.org/images/entities/char_2009.gif) : :![[thin space (1/6-em)]](https://www.rsc.org/images/entities/char_2009.gif) 2 2![[thin space (1/6-em)]](https://www.rsc.org/images/entities/char_2009.gif) : :![[thin space (1/6-em)]](https://www.rsc.org/images/entities/char_2009.gif) 20 20 |
98.34 | 97.63 | 100.38 | 97.34 | 101.23 | 99.73 | 100.55 | 101.55 | 101.13 | |
35![[thin space (1/6-em)]](https://www.rsc.org/images/entities/char_2009.gif) : :![[thin space (1/6-em)]](https://www.rsc.org/images/entities/char_2009.gif) 10 10![[thin space (1/6-em)]](https://www.rsc.org/images/entities/char_2009.gif) : :![[thin space (1/6-em)]](https://www.rsc.org/images/entities/char_2009.gif) 5 5 |
100.64 | 99.45 | 99.95 | 102.04 | 98.44 | 101.67 | 100.22 | 101.4 | 102.11 | |
20![[thin space (1/6-em)]](https://www.rsc.org/images/entities/char_2009.gif) : :![[thin space (1/6-em)]](https://www.rsc.org/images/entities/char_2009.gif) 5 5![[thin space (1/6-em)]](https://www.rsc.org/images/entities/char_2009.gif) : :![[thin space (1/6-em)]](https://www.rsc.org/images/entities/char_2009.gif) 30 30 |
99.78 | 97.56 | 100.71 | 101.49 | 102.7 | 100.93 | 101.6 | 101.25 | 102.56 | |
3![[thin space (1/6-em)]](https://www.rsc.org/images/entities/char_2009.gif) : :![[thin space (1/6-em)]](https://www.rsc.org/images/entities/char_2009.gif) 30 30![[thin space (1/6-em)]](https://www.rsc.org/images/entities/char_2009.gif) : :![[thin space (1/6-em)]](https://www.rsc.org/images/entities/char_2009.gif) 20 20 |
103.32 | 100.94 | 97.78 | 98.51 | 99.56 | 99.78 | 97.86 | 97.13 | 100.61 | |
| Mean | 101.07 | 98.83 | 99.56 | 99.75 | 100.70 | 100.94 | 99.03 | 99.89 | 100.67 | |
| Mean (%RSD) | 1.66 | 2.10 | 1.39 | 1.71 | 2.01 | 1.29 | 1.77 | 1.96 | 1.87 | |
| Natural mineral water | 3![[thin space (1/6-em)]](https://www.rsc.org/images/entities/char_2009.gif) : :![[thin space (1/6-em)]](https://www.rsc.org/images/entities/char_2009.gif) 3 3![[thin space (1/6-em)]](https://www.rsc.org/images/entities/char_2009.gif) : :![[thin space (1/6-em)]](https://www.rsc.org/images/entities/char_2009.gif) 3 3 |
101.77 | 98.26 | 97.67 | 100.7 | 98.51 | 99.17 | 98.67 | 99.39 | 99.43 |
20![[thin space (1/6-em)]](https://www.rsc.org/images/entities/char_2009.gif) : :![[thin space (1/6-em)]](https://www.rsc.org/images/entities/char_2009.gif) 2 2![[thin space (1/6-em)]](https://www.rsc.org/images/entities/char_2009.gif) : :![[thin space (1/6-em)]](https://www.rsc.org/images/entities/char_2009.gif) 2 2 |
96.75 | 97.85 | 98.11 | 102.87 | 97.83 | 99.61 | 98.34 | 101.14 | 100.56 | |
2![[thin space (1/6-em)]](https://www.rsc.org/images/entities/char_2009.gif) : :![[thin space (1/6-em)]](https://www.rsc.org/images/entities/char_2009.gif) 20 20![[thin space (1/6-em)]](https://www.rsc.org/images/entities/char_2009.gif) : :![[thin space (1/6-em)]](https://www.rsc.org/images/entities/char_2009.gif) 2 2 |
98.77 | 102.41 | 100.17 | 100.03 | 99.42 | 97.85 | 98.87 | 100.12 | 102.66 | |
2![[thin space (1/6-em)]](https://www.rsc.org/images/entities/char_2009.gif) : :![[thin space (1/6-em)]](https://www.rsc.org/images/entities/char_2009.gif) 2 2![[thin space (1/6-em)]](https://www.rsc.org/images/entities/char_2009.gif) : :![[thin space (1/6-em)]](https://www.rsc.org/images/entities/char_2009.gif) 20 20 |
101.68 | 101.68 | 99.12 | 102.34 | 101.12 | 102.36 | 99.11 | 99.76 | 101.44 | |
35![[thin space (1/6-em)]](https://www.rsc.org/images/entities/char_2009.gif) : :![[thin space (1/6-em)]](https://www.rsc.org/images/entities/char_2009.gif) 10 10![[thin space (1/6-em)]](https://www.rsc.org/images/entities/char_2009.gif) : :![[thin space (1/6-em)]](https://www.rsc.org/images/entities/char_2009.gif) 5 5 |
98.44 | 97.68 | 98.83 | 98.53 | 101.63 | 101.85 | 101.03 | 102.29 | 102.71 | |
20![[thin space (1/6-em)]](https://www.rsc.org/images/entities/char_2009.gif) : :![[thin space (1/6-em)]](https://www.rsc.org/images/entities/char_2009.gif) 5 5![[thin space (1/6-em)]](https://www.rsc.org/images/entities/char_2009.gif) : :![[thin space (1/6-em)]](https://www.rsc.org/images/entities/char_2009.gif) 30 30 |
97.87 | 99.32 | 97.5 | 101.06 | 99.47 | 100.61 | 100.41 | 102.13 | 100.98 | |
3![[thin space (1/6-em)]](https://www.rsc.org/images/entities/char_2009.gif) : :![[thin space (1/6-em)]](https://www.rsc.org/images/entities/char_2009.gif) 30 30![[thin space (1/6-em)]](https://www.rsc.org/images/entities/char_2009.gif) : :![[thin space (1/6-em)]](https://www.rsc.org/images/entities/char_2009.gif) 20 20 |
99.22 | 100.42 | 96.16 | 98.82 | 100.31 | 100.24 | 102.96 | 101.11 | 102.64 | |
| Mean | 99.21 | 99.66 | 98.22 | 100.62 | 99.76 | 100.24 | 99.91 | 100.85 | 101.49 | |
| Mean (%RSD) | 1.90 | 1.90 | 1.32 | 1.63 | 1.37 | 1.55 | 1.66 | 1.12 | 1.24 | |
3.11 Greenness profile of the proposed methods
The environmental suitability of an analytical procedure is becoming increasingly important in its development. In this regard, three different analytical metrics were employed to assess the eco-friendly behavior of the sample preparation procedure and the entire analytical methodology. These metrics include the AES (shown in Fig. 11A), the AGREEprep (shown in Fig. 11B), and the AGREE (illustrated in Fig. 11C). The AES serves as a simple and semi-quantitative tool for estimating the environmental impact of analytical procedures by assigning penalty points (PP) to different experimental steps. PPs are allocated for each step based on analytical parameters such as the quantity of reagent, hazards, energy, and waste generated. These PP are then subtracted from a score of 100 to calculate the eco-scale of the methods.41,44–46,53,54,57–59 In this work, the use of 10 mL of reagent per analysis resulted in 1 PP, but the total PP for the amount was computed as the product of amount PP multiplied by hazard PP. The potential hazard posed by the reagent was assessed using the internationally recognized system for categorizing and labeling chemicals, known as the Globally Harmonized System (GHS). Ethanol was assigned 2 pictograms and labeled as ‘danger’ (indicating severe hazard), resulting in 4 PP. The energy consumption for UV ≤ 0.1 kW h per analysis resulted in 0 PP, and no identified occupational hazards led to 0 PP. Additionally, the waste generated by the method is minimal, resulting in 0 PP. Thus, the total PP lost for this method is 4, giving an analytical eco-score of 96 as illustrated in Fig. 11A, indicating the environmental friendliness of the approaches.The AGREE metrics is an innovative software based on 12 criteria, each corresponding to one of the 12 principles of green analytical chemistry. These principles are arranged around the edge of a classical clock shape and are scored from 0 to 1. The average score, located in the middle, provides an estimation of the greenness of the method. The color scale transitions from red to yellow to green based on the obtained score.55–58
In 2022, AGREEprep, an updated version of AGREE, was developed as a software tool to assess the environmental impact of various sample preparation techniques in analytical chemistry. It operates based on 10 principles of green sample preparation, which include minimizing waste, energy, and solvent use, as well as emphasizing miniaturization and automation. The software computes a final score and 10 sub-scores for each sample preparation method, utilizing user-defined weights for each criterion. These scores are presented in a circular diagram, where colors indicate the greenness level of each criterion: red for low, orange for medium-low, yellow for medium, and green for high.59
As illustrated in Fig. 11B and C, the proposed methods for quantifying P, 2-AP, and 4-AP enable at-line analysis, eliminating the need for sample preservation, storage, and extraction. The use of only 10 mL of solvent results in minimal waste production. Moreover, the spectrophotometer's low energy consumption (≤0.1 kW h per analysis) aligns with green chemistry principles, making it an eco-friendly choice for analytical measurements. The AGREE software (Fig. 11B) with a score of 0.81 and AGREEprep (Fig. 11C) with a score of 0.74 further emphasize the greenness of the methods. Consequently, the AES, AGREE, and AGREEprep tools affirm the eco-friendly nature of the methods and their suitability for analyzing P, 2-AP, and 4-AP in their ternary combinations.
4. Conclusion
Three proposed derivative UV spectrophotometric methods were developed, characterized by their simplicity, sensitivity, environmental friendliness, cost-effectiveness, and accuracy for the simultaneous quantification of P, 2-AP, and 4-AP without the need for prior separation or complicated mathematical operations. The overall determinations by these methods involved the recovery of either derivative or ratio derivative spectra of each component from their ternary mixtures. These suggested methods offer several advantages over hyphenated analytical techniques in terms of speed and specificity. Moreover, the use of ethanol as a solvent aligns with environmental sustainability, as verified by AES, AGREE, and AGREEprep metrics. The potential applicability of the methods was demonstrated by analyzing the three analytes in synthetic mixture solutions with different ratios and real water samples, including tap and mineral water, with good accuracy and precision. Hence, these approaches can be successfully applied for the quantification of P, 2-AP, and 4-AP in water quality control and environmental analysis.Data availability
Data will be available from the corresponding author upon request.Conflicts of interest
The authors declare that they have no known competing financial interests or personal relationships that could have appeared to influence the work reported in this paper.Acknowledgements
The authors gratefully acknowledge the University of Sulaimani, Charmo University, and Komar University of Science and Technology for supporting this research.References
- X. Yang, X. Jiang, W. Wang, Q. Yang, Y. Ma and K. Wang, RSC Adv., 2019, 9, 34529–34534 RSC.
- V. Elumalai and J. H. Hansen, RSC Adv., 2020, 10, 40582–40587 RSC.
- P. Yao, J. Cen, M. Fang, T. Wang and Q. Wang, RSC Adv., 2018, 8, 17558–17568 RSC.
- M. P. Zarandi and H. Beitollahi, J. Mater. Sci. Mater. Electron., 2022, 33, 19723–19733 CrossRef CAS.
- E. F. Durán-Lara, A. Valderrama and A. Marican, Agriculture, 2020, 10, 1–22 CrossRef.
- H. Karimi-Maleh, R. Darabi, F. Karimi, C. Karaman, S. A. Shahidi, N. Zare, M. Baghayeri, L. Fu, S. Rostamnia, J. Rouhi and S. Rajendran, Environ. Res., 2023, 222, 1–14 CrossRef PubMed.
- C. M. Santana, Z. S. Ferrera, M. E. T. Padrón and J. J. S. Rodríguez, Molecules, 2009, 14, 298–320 CrossRef CAS PubMed.
- H. Tian, Y. Hu, X. Xu, M. Hui, Y. Hu, W. Qi, H. Xu and B. Li, Bioresour. Technol., 2019, 289, 121649–121657 CrossRef CAS PubMed.
- O. J. Otutu, D. R. Okoro and E. K. Ossai, J. Appl. Sci., 2008, 8, 334–339 CrossRef.
- H. G. Rauf, J. M. Hadi, S. B. Aziz, R. T. Abdulwahid and M. S. Mustafa, Int. J. Electrochem. Sci., 2022, 17, 1–15 Search PubMed.
- M. S. Mustafa, H. O. Ghareeb, S. B. Aziz, M. A. Brza, S. Al-zangana, J. M. Hadi and M. F. Z. Kadir, Membranes, 2020, 10, 1–16 CrossRef PubMed.
- J. M. Hadi, S. B. Aziz, M. S. Mustafa, M. A. Brza, M. H. Hamsan, M. F. Z. Kadir, H. O. Ghareeb and S. A. Hussein, Int. J. Electrochem. Sci., 2020, 15, 4671–4683 CrossRef CAS.
- J. M. Hadi, S. B. Aziz, M. S. Mustafa, M. H. Hamsan, R. T. Abdulwahid, M. F. Z. Kadir and H. O. Ghareeb, J. Mater. Res. Technol., 2020, 9, 9283–9294 CrossRef CAS.
- S. Wu, D. Guo, X. Xu, J. Pan and X. Niu, Sens. Actuators, B, 2020, 303, 127225–127233 CrossRef CAS.
- X. Liu, H. Li, H. Zhou, J. Liu, L. Li, J. Liu, F. Yan and T. Luo, J. Electroanal. Chem., 2020, 878, 114568–114574 CrossRef CAS.
- T. Tabanlıgil Calam and G. Taşkın Çakıcı, J. Food Compos. Anal., 2022, 114, 104728–104742 CrossRef.
- A. J. Stewart and R. F. Stewart, Ecotoxicology, 2008, 5, 2682–2689 Search PubMed.
- K. F. Kayani and K. M. Omer, New J. Chem., 2022, 46, 8152–8161 RSC.
- A. Brega, P. Prandini, C. Amaglio and E. Pafumi, J. Chromatogr. A, 1990, 535, 311–316 CrossRef CAS PubMed.
- T. Zhang, X. Chen, P. Liang and C. Liu, J. Chromatogr. Sci., 2006, 44, 619–624 CAS.
- T. K. Koley, Z. Khan, D. Oulkar, B. K. Singh, A. Maurya, B. Singh and K. Banerjee, Arab. J. Chem., 2020, 13, 1355–1366 CrossRef CAS.
- I. Ali, V. K. Gupta, V. K. Saini and H. Y. Aboul-Enein, Int. J. Environ. Pollut., 2006, 27, 95–103 CrossRef CAS.
- W. Alshitari, J. Chromatogr. B, 2019, 1122–1123, 73–77 CrossRef CAS PubMed.
- N. H. Al-Shaalan, I. Ali, Z. A. ALOthman, L. H. Al-Wahaibi and H. Alabdulmonem, Molecules, 2019, 24, 1–11 Search PubMed.
- K. F. Kayani, N. N. Mohammad, D. A. Kader and S. J. Mohammed, ChemistrySelect, 2023, 8, 202303472 CrossRef.
- S. Narouie, G. H. Rounaghi, H. Saravani and M. Shahbakhsh, Electroanalysis, 2022, 34, 798–808 CrossRef CAS.
- T. M. Sharanakumar, N. Mounesh, N. Y. Praveen Kumar, K. V. Reddy and A. Sunilkumar, Electrocatalysis, 2023, 14, 381–392 CrossRef CAS.
- L. Ji, F. Li, C. Li and P. Hu, Microchem. J., 2022, 181, 107688–107696 CrossRef CAS.
- K. F. Kayani and C. N. Abdullah, J. Fluoresc., 2024, 1–13 Search PubMed.
- V. K. Redasani, P. R. Patel, D. Y. Marathe, S. R. Chaudhari, A. A. Shirkhedkar and S. J. Surana, J. Chil. Chem. Soc., 2018, 63, 4126–4134 CrossRef CAS.
- A. S. Fayed, R. M. Youssif, N. N. Salama, H. A. Hendawy and E. S. Elzanfaly, Chem. Pap., 2019, 73, 2723–2736 CrossRef CAS.
- C. Bosch Ojeda and F. Sanchez Rojas, Anal. Chim. Acta, 2004, 518, 1–24 CrossRef CAS.
- F. Ariani, M. Bachri and S. Sinaga, Asian J. Pharm. Clin. Res., 2018, 11, 1–3 CrossRef.
- H. M. Lotfy, D. Mohamed and M. S. Elshahed, Spectrochim. Acta, Part A, 2019, 222, 1–31 CrossRef PubMed.
- M. Attimarad, A. B. Nair, N. Sreeharsha, B. E. Al-Dhubiab, K. N. Venugopala and P. Shinu, Int. J. Environ. Res. Public Health, 2021, 18, 1–16 Search PubMed.
- H. M. Lotfy, M. A. Hegazy, S. Mowaka and E. H. Mohamed, Spectrochim. Acta, Part A, 2015, 140, 495–508 CrossRef CAS PubMed.
- C. Kang, Y. Wang, R. Li, Y. Du, J. Li, B. Zhang, L. Zhou and Y. Du, Microchem. J., 2000, 64, 161–171 CrossRef CAS.
- Z. Wang, Y. Kong, C. Yao, Y. Wang, X. Ding and Y. Zhou, Appl. Clay Sci., 2012, 55, 173–176 CrossRef CAS.
- B. Kaur and R. Srivastava, Electrochim. Acta, 2014, 141, 61–71 CrossRef CAS.
- F. M. Najib and M. S. Mustafa, Malaysian J. Anal. Sci., 2014, 18, 491–506 Search PubMed.
- G. Sowjanya, S. Ganapaty and S. Almas, Int. J. Pharm. Pharm. Sci., 2018, 11, 1–11 Search PubMed.
- E. Dinç and F. Onur, Anal. Chim. Acta, 1998, 359, 93–106 CrossRef.
- D. M. Atole, H. H. Rajput, 2018, 11, 59–66.
- S. S. Saleh, H. M. Lotfy, N. Y. Hassan and H. Salem, Spectrochim. Acta, Part A, 2014, 132, 239–248 CrossRef CAS PubMed.
- Y. Rostom, H. M. Lotfy, M. Öztürk, G. Tiris, N. Erk and S. S. Saleh, Spectrochim. Acta, Part A, 2021, 247, 119080–119092 CrossRef CAS PubMed.
- International Conference on Harmonization (ICH), Guidance for Industry Q2B Validation of Analytical Procedures: Methodology, 1997, pp. 301–827 Search PubMed.
- M. Attimarad, V. K. Narayanswamy, B. E. Aldhubaib, N. SreeHarsha and A. B. Nair, PLoS One, 2019, 14, 1–15 Search PubMed.
- T. Boontongto, K. Siriwong and R. Burakham, Chromatographia, 2018, 81, 735–747 CrossRef CAS.
- A. Vermeulen, K. Welvaert and J. Vercammen, J. Chromatogr. A, 2005, 1071, 41–46 CrossRef CAS PubMed.
- K. Reddaiah and T. Madhusudana Reddy, J. Mol. Liq., 2014, 196, 77–85 CrossRef CAS.
- B. Sanna Jilani, C. D. Mruthyunjayachari, P. Malathesh, N. Mounesh, T. M. Sharankumar and K. R. V. Reddy, Sens. Actuators, B, 2019, 301, 1–8 CrossRef.
- J. Sun, Z. Shi, J. Li, B. Liu and T. Gan, Electroanalysis, 2016, 28, 111–118 CrossRef CAS.
- J. Płotka-Wasylka, Talanta, 2018, 181, 204–209 CrossRef PubMed.
- A. F. El-Yazbi, E. F. Khamis, R. M. Youssef, M. A. El-Sayed and F. M. Aboukhalil, Heliyon, 2020, 6, 1–8 CrossRef PubMed.
- K. S. Kokilambigai and K. S. Lakshmi, Green Chem. Lett. Rev., 2021, 14, 97–105 Search PubMed.
- S. Rathinam and L. K. Santhana, J. Appl. Pharm. Sci., 2021, 11, 150–160 CAS.
- F. Pena-Pereira, W. Wojnowski and M. Tobiszewski, Anal. Chem., 2020, 92, 10076–10082 CrossRef CAS PubMed.
- K. F. Kayani, O. B. A. Shatery, M. S. Mustafa, A. H. Alshatteri, S. J. M. De and S. B. Aziz, RSC Adv., 2024, 14, 5012–5021 RSC.
- F. Pena-pereira, M. Tobiszewski, W. Wojnowski and E. Psillakis, Adv. Sample Prep., 2022, 3, 100025 CrossRef.
| This journal is © The Royal Society of Chemistry 2024 |

