 Open Access Article
Creative Commons Attribution 3.0 Unported Licence
Part I: determination of a structure/property transformation mechanism responsible for changes in the point of zero change of anatase titania with decreasing particle size
Miriam
Leffler
 *,
Anne
Mirich
,
Jared
Fee
,
Seth
March
and
Steven L.
Suib

Department of Chemistry, University of Connecticut, USA. E-mail: Miriamleffler1066@gmail.com; anne.mirich@uconn.edu; jare.fee@uconn.edu; seth.march@uconn.edu; steven.suib@uconn.edu
First published on 15th October 2024
Abstract
Below a diameter of approximately 28 nm, the surface crystal structure of anatase titania is known to change. These changes include surface bond lengths and crystal lattice parameter expansion/contractions. Concurrent with these structure changes, the materials point of zero charge (PZC) has been observed to shift toward lower pH values. Therefore, the objective of this work was to determine if a correlation exists between these known structural changes and the shift in the materials PZC values with decreasing particle size. To achieve this a method was developed to identify and minimize the effect of all known variables, save particle size, affecting the materials pHPZC. This led to the discovery of two regions for point of zero charge. Above the average spherical primary particle diameter ≅ 29 nm for anatase titania, denoted as Region I, PZC values remain constant. In Region I the materials surface crystal structure and properties were also found to remain constant. Below the average spherical primary particle diameter ≅29 nm is the second zone, defined as Region II, where pHPZC values decrease almost linearly. An examination of possible surface structure factors and properties responsible for the shift in these PZC values (Region II) identified three underlying causes. These being changes in the materials band gap (i.e. surface bond lengths), lattice parameters and bond ionic content.
1 Introduction
Point of zero charge (PZC) is an important adsorption property, critical to multiple areas in chemistry where the surface charge is neutralized by counter ions resulting in its surface potential going to zero. In catalysis PZC has been found to control the kinetics of electrochemical reduction of diazonium salts.1 Changes in surface roughness have been identified as shifting the material's isoelectric point/PZC affecting its utility as a catalyst support.2 PZC is also critical to the loading and retention (i.e. adhesion) of a catalyst onto a support.3Changes in PZC values are also important in their effect on dielectric and capacitive properties, which affect electrode performance.4,5 These changes can occur through the introduction of different protons and specifically adsorbing ions6 at the solid/liquid interface.7–10 The effect on these properties is important in electrical energy storage devices such as batteries and capacitors, which are critical in electronic systems.11,12
PZC is in fact critical across many other fields of chemistry beyond the two detailed above. These include flotation in mineral engineering (i.e., extracting valuable minerals from ores),13 waste remediation (contaminate removal),14 soil science,15 electrochemistry,16 pharmacology (drug production),17 colloidal chemistry and surface science.18 Therefore, if only small changes to the surface structure have a significant effect on this property, a fundamental understanding of the underlying factor(s) controlling a material's PZC value is critical. It will serve to advance work in these and other fields of chemistry where this value is important to their work.
Anatase titania was chosen for this work due to its importance in multiple fields. These include water purification systems,19 photocatalysis,20 electrochemical and biosensors,21 a finishing agent on cloth allowing it to self-clean,22 and photovoltaic systems.23 Changes in these materials' point of zero charge (PZC) in the synthesized material have been shown to affect properties such as photocatalysis,24 water treatment,25 and catalytic reaction rates.26 Therefore, the underlying cause(s) responsible for the shift in this property will be important across multiple fields where this material is used.
The multiple factors affecting PZC/surface charge have been studied and identified in the literature. These include:
(1) Morphology2
(2) Roughness2
(3) Particle size27,28
(4) Surface crystal structure7–9
(5) Composition10
(6) Temperature29
(7) Surface contamination/surfactants30
(8) Representative sample size of particle population31
(9) Solubility32
(10) Pretreatment, which can introduce solvents, acids, bases etc. into the pore system, changing the overall composition of the surface, resulting in a shift in the PZC value10,33
(11) Grinding34
(12) Stable surface phase (i.e., dominant species) in an aqueous environment at its PZC value according to its Eh-pH diagram,35 and
(13) Electrolyte concentration36
Yet even with knowledge of these variables, PZC values for the same phase often extend over 3 to 4 pH units.9,37,38 Therefore, an understanding of how each of these factors impinges on PZC values is critical.
Theoretical work by Barisik et al.28 determined that as spherical silica nanoparticle's size decreased below d ≅ 20 nm, surface charge increased significantly. Above this diameter, surface charge remained essentially constant. Their work allowed the examination of changes in a particles surface charge without the physical constraints cited above. Therefore, decreasing particle size would allow an examination of surface structure/property changes to be examined once the known factors affecting pHPZC are minimized.
Work carried out by Suttiponparnit et al.39 demonstrates the difficulty of determining an accurate primary particle size. They used the specific surface area of each sample to determine the average primary particle size for each PZC value of anatase titania. Their results though were opposite those found by Barisik et al.28 They observed that as the surface area increased (i.e. decreasing particle size) PZC values were found to increase. Yet even with this discrepancy between their results and Barisik et al.'s,28 the importance of their work is that they demonstrated experimentally that there is a systematic shift in anatase titania's PZC with changing surface area (i.e., particle size) and was the impetus for this research.
Defining a normalized average primary particle diameter even for the same powder population measured presents a significant problem. Lin et al.'s40 work illustrates this. Their work used three different methods to measure an average spherical particle diameter (DSP) for the same sample of anatase titania. These included hydrodynamic diameter (H. D.), BET (surface area using nitrogen adsorption), and transmission electron microscopy (TEM). The H. D. method resulted in a DSP = 314 ± 8 nm, while TEM gave a DSP = 11.0 ± 3.4 nm. Using the equation for a spherical diameter [ref. 41, Appendix A], the specific surface area (SA) from the BET (324 m2 g−1) and the density of anatase titania (ρ = 3.89 g cm−3)42 gave an average primary particle DSP = 4.75 nm for a particle with a spherical, cubic, and/or rectangular morphology.
Each of the preceding examples demonstrates the difficulty of obtaining a normalized average primary particle size for a powder population. Once a method for normalizing each powder population's average primary particle diameter is achieved, it should then be possible to determine the correct shift in a material's PZC values with size. Furthermore, this would allow an examination of the underlying changes to a material's surface structure and properties for these changes.
Leffler43 addressed this problem by devising a method to standardize/normalize the average primary particle size (i.e., diameter) between two separate populations of the same phase. The material chosen to test this method was goethite (α-FeO(OH)). Synthesized goethite used in experimental work possesses two morphologies, these being: (1) cubic to rectangular and (2) acicular (needle like).44–46
The effect of these two different morphologies, where their size (i.e. DSP) has not been normalized, is presented in Fig. 1a. Using the equation for a spherical diameter [ref. 41, Appendix A], two sets of particle sizes for these goethite groups were calculated, using their specific surface area. Group 1 possesses a morphology that is roughly cubic to rectangular47–55 which decreases almost linearly below a d ≅ 65 nm. Group 2 possesses an acicular (i.e., needle like) morphology56–59 which demonstrates no change in the material's pHPZC values with decreasing particle size. In Fig. 1a there is no apparent correlation between group 1 & 2.
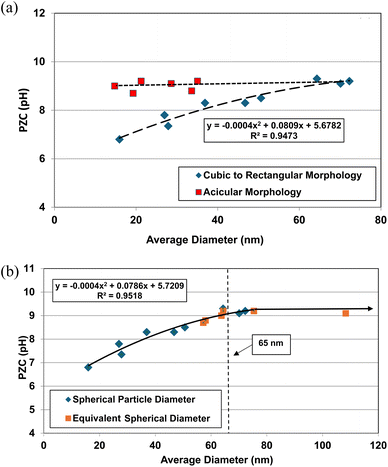 | ||
| Fig. 1 (a) Correlation between the calculated average primary particle spherical diameters using specific surface area plotted against their PZC values for Groups 1 & 2 of synthetic goethite (α-FeO(OH)).47–59 (b) Correlation between the spherical to rectangular particle diameters with the normalized acicular particle diameters against their PZC values for Groups 1 & 2 of goethite (α-FeO(OH)).47–59 | ||
The next step was to calculate the equivalent spherical radius (RES) for Group 2 using each population's acicular volume.60 Once the equivalent particle diameters (DES = 2 × RES) were normalized and plotted along with the values from group 1, a single curve emerged and is presented in Fig. 1b. The single curve decreases almost linearly for both particle populations below d ≅ 65 nm. This curve now allows correlation between any possible underlying structure and/or property parameter(s) responsible for these changes in PZC values without the complicating factor of the material's average primary particle morphology. Appendix A provides the full method used to obtain the results in Fig. 1a and b.
The method used to obtain the results in Fig. 1b was also used to determine the average primary particle size (DSP) for other metal oxides/hydroxides from literature values. These values were then plotted against their PZC values. The results obtained are available in Appendix A. They include barium titanate (BaTiO3),61–72 monoclinic zirconia (ZrO2),73–85 hematite (α-Fe2O3),86–95 and 3% doped tetragonal zirconia (3% YTZ).96–109 They follow the same form as the curve in Fig. 1b. The final plot [Fig. 12] demonstrates the effect of the largest cation110 in each structure on the particle size at which PZC values begin shifting to lower pHPZC values.
Until this work there has been no systematic method for identifying and minimizing the effect of all the known possible variables responsible for changes in each metal-oxide/hydroxide point of zero charge values.2,7–10,27–36 Typically, studies into the effect of different variables of point of zero charge often consider only a few of the factors responsible for changes in this property. Therefore, the objectives of this project were to (1) develop a method minimizing the effect of all the known factors affecting PZC values for all metal-oxides/hydroxides, (2) develop a protocol for obtaining the most accurate and precise normalized average primary particle diameters of different morphologies with the same phase and (3) determine any underlying physical parameter(s) and/or properties which correlate directly with any changes in the materials pHPZC.
2 Experimental section
2.1 Choice of metal oxide systems
Anatase titania [US Research Nanomaterials, SkySpring Nanomaterials] was chosen for the following reasons: (1) the phase is stable at ambient temperature and pressure,111 (2) the material is available commercially from the micron region down to a diameter of 5 nm,112,113 (3) it is stable even when exposed to corrosive environments,114 (4) is highly insoluble over a wide range of pH values in an aqueous environment, dilute acids and inorganic bases at ambient temperature and pressure,3,42,115 (5) the bulk and surface structures are identical,9 and (6) the dominant species is TiO2 from a pH = 0 to 14 in an aqueous environment at ambient temperature and pressure35 indicating there is no thermodynamic driving force to transform the surface structure, allowing it to remain stable.2.2 Determination of the average primary particle size, morphology, roughness and elemental composition
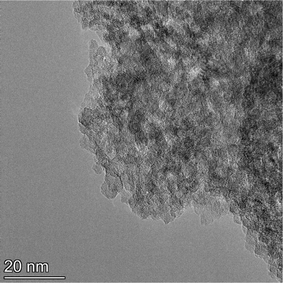
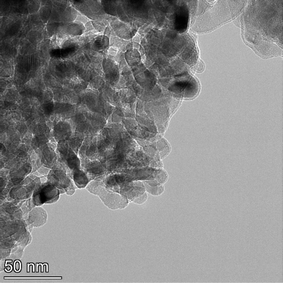
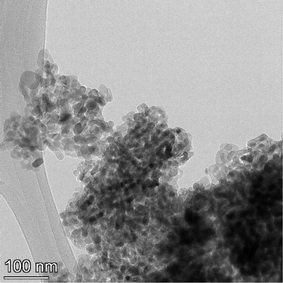
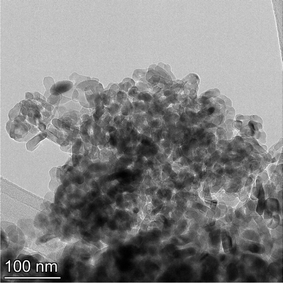
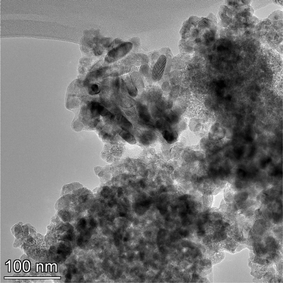
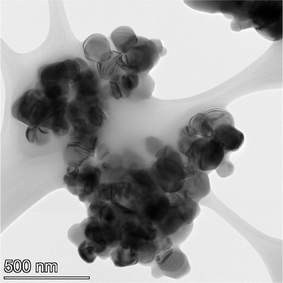
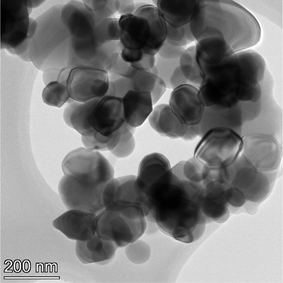
The samples obtained exhibited a spherical to cubic morphology, with smooth surfaces in the TEM micrographs available from the vendor for each sample tested.112,113 Detailed particle morphology, size and surface smoothness were then reconfirmed using an FEI, Talos F200× microscope utilizing a 200 kV voltage transmission electron microscope (TEM). Elemental mapping was done with an energy dispersive X-ray spectroscopy (EDS) detector. The EDS is sensitive down to 0.1% by weight of elements present in the sample. These include even light elements such as carbon, nitrogen and oxygen116 which can be component parts of solvents. The TEM grids were prepared by combining a 2 mg sample with 20 mL of solvent (ethanol: Fischer Scientific) and sonicating for 5 minutes. The solution was then dispersed on a copper grid dropwise via a pipette. Multiple micrographs were taken of each powder population. Representative TEM micrographs of each sample are presented in Appendix B.2.3 Minimum sample size
To ensure a representative sample size in each literature and experimental data set, eqn (1) through (3) were used to calculate an absolute theoretical minimum amount (Mi).31,42 | (1) |
| wi = (kυd3ρ) | (2) |
 | (3) |
Since Mi typically corresponds closely to the top size of the distribution, and only this value was calculated. For this material a d = 1 µm was chosen which was significantly larger than each of the average primary particle sizes in the powder populations examined. In addition, as the diameter of Mi decreases, the sample needed for a representative sample also decreases. Therefore, the calculated Mi = 1 µm would be significantly larger than required for the average primary particle diameters used. The variables input into eqn (3) through (5) were for a typical Rosin-Rammler size distribution, with a slope = 1, with ξ = ± 5% (0.05) maximum allowable error, and the top fraction size is 10% (0.10) for a 1.0 g powder population, where Δyi = 0.10 g. The density used for anatase titania was ρ = 3.84 g cm−3.42 The minimum top size value calculated for anatase titania [eqn (3)–(5)] is Mi = 2.96 × 10⁻¹¹ g.
2.4 Confirmation of crystal structure of anatase titania using X-ray diffraction
Powder X-ray diffraction (PXRD) patterns were taken to confirm both the structure and composition of all seven powder samples. PXRD micrographs of each sample [Appendix C] were made using a Rigaku Ultima IV X-ray diffractometer set at 40 kV, 44 mA, and 1.76 kW. The system is sensitive down to 0.2% by weight117 of all structures present in the sample. The PXRD patterns were taken between 5° to 75° 2-theta. The CuKα1 X-rays were produced using a copper tube with a wavelength of λ = 1.54056. Rigaku PDXL 1.8.0.3 software was used to analyze the structures.2.5 Temperature range
The ambient temperature range within which each measurement was taken ran from 293 K to 298 K. This was to minimize the temperature effect on the measured PZC value.29 The solution temperature was monitored and recorded during the titration using a temperature probe on a Hanna Instruments (HI) 2214 pH/ORP meter. This insured that during the titration the electrolyte solution remained within the designated temperature range.2.6 Prevention of contamination and no pretreatment
To avoid contamination each sample remained in its container until used in its titration run. There was no pretreatment of the sample, as this is known to affect measured PZC values.27 This procedure reduced the possibility of surface contamination to a minimum before testing.2.7 Mass titration method
The mass titration method was used to determine PZC values of anatase titania samples which is comparable to the common intercept point (CIP). An added advantage of this method is that avoids the possible problems posed using different electrolyte concentrations employed in CIP.118 The procedure involved performing three runs, one with a blank (0.0 g sample) electrolyte solution and two more runs with increasing powder sample sizes. The full procedure is presented in Appendix D.2.8 Band gap measurements
Band gap measurements were made thru Eurofins Materials Science at the EAG Laboratories in Eindhoven, the Netherlands. Two sets of samples were measured. The samples presented in this paper were pressed in an XRD sample holder by hand (i.e., at ambient temperature and pressure) and a second set of powder samples, pressed at 10 tons. A PerkinElmer, Lambda 1050 UV-VIS-NIR spectrometer equipped with a 150 mm integrating sphere was used to perform the measurements. Reflection UV-VIS-NIR analysis was performed between 200 and 1000 nm. Eqn (4) was used to calculate band gap energy.| Band gap energy (E) = h × C/λ | (4) |
Fig. 28, in Appendix E, presents the plot of band gap values for the sample pressed at 10 tons. An explanation of the effect pressure has on the materials surface bond lengths is included.119 Therefore, the set of measurements taken at ambient temperature and pressure were used. This allowed the comparison of the band gap results with all the other experimental work carried out under the same conditions at ambient temperature and pressure.
3 Results
3.1 Powder population average primary particle size and elemental composition
An examination of the particles for each powder population using transmission electron microscopy (TEM) micrographs revealed four basic shapes. These were a circle (sphere), ellipse (ovoid), square (cube) and rectangle (rectangular cube) [Appendix B]. The method developed by Leffler43 was then augmented to determine the average equivalent spherical diameter (DES).The first step was to identify and physically outline the particles so their surface was clearly identified, and their entire circumference could be easily measured. Next, circular (spherical) particle diameters (DS) were then measured directly from the TEM micrographs. The other three non-circular particles were determined by calculating their equivalent circular radius (RES). This was accomplished by first obtaining the surface area equations for a circle (A = r2 × π), ellipse (A = q × p × π), square (A = a2), and rectangle (A = w × h).60 Then the surface area equations for the three non-circular shapes were set equal to the surface area of the circle. Rearranging these equations resulted in the equations for the RES of each non-circular shape. Then inserting RES into DES = 2 × RES gave eqn (5) through (7).
 | (5) |
 | (6) |
 | (7) |
The next step was to find the sample size required to obtain an accurate average DES for each powder population. This was done by calculating the average diameter for a series of increasing sample sizes. An example of this process is presented in Table 1 for powder population 7. The first average DES was determined for a sample size of 5 measured particle diameters. This gave an average DES = 121.77 nm. Then the sample size was increased to 10 particles and the process repeated, each time incrementing the sample size by 10 particles. The reason for using powder population 7, is that this one demonstrated the widest variation of measured particle sizes, stretching from a DES ≅ 56.45 nm to a DES ≅ 256.41 nm.
| Sample size | Average particle diameter (nm) | Average particle variation (±nm) |
|---|---|---|
| 5 | 121.77 | 22.30 |
| 10 | 151.30 | 33.12 |
| 20 | 151.98 | 31.71 |
| 30 | 147.27 | 35.68 |
| 40 | 143.33 | 35.32 |
| 50 | 140.95 | 32.78 |
| 60 | 139.98 | 30.69 |
| 70 | 141.77 | 31.72 |
| 80 | 142.614 | 31.66 |
| 90 | 142.45 | 31.75 |
| 100 | 143.11 | 33.59 |
| 110 | 144.35 | 35.02 |
| 120 | 143.45 | 35.84 |
| 127 | 142.614 | 36.32 |
It was found that above a sample size of 50, the average diameters obtained for sample sizes from 50–127 were found to oscillate around an average DES = 142.233 nm with an average variation of ±1.021 nm [Table 1]. This indicates that the sample size required to obtain the most accurate value is at/or above 50 spherical and equivalent spherical particle diameters. Sample sizes for all the powder populations examined in this work far exceeded this, typically about 100 particles were measured. Results for all the powder populations are presented in Appendix B, in Table 3.
In addition to the average primary particle diameters determined from TEM measurements, are two additional sets of particle sizes for each powder population in Table 3 [Appendix B]. This data was available on the websites for both U. S. Nanomaterial Research112 and Spring Sky Nanomaterials.113 The average primary particle diameters were determined from their BET (nitrogen adsorption) measured specific surface area (m2 g−1) using eqn (13), and ρ = 3.84 g cm−3.45 The second method was an Aerodynamic Particle Sizer (APS) which relies on time of flight coupled with Dynamic Light Scattering (DLS) to measure particle size. A comparison of the results from the three methods for the powder populations, using identical synthesis process was made. The differences between the average primary particle size for the method developed in this work and those provided by the companies112,113 ranged from 5.785% to 463.301%, with an average of 66.355% for all the values in the two sets.
A plot of both sets of the experimental particle data against their PZC values (unpublished) from both vendors [Table 3] was made for their Region II values. The best fit function for the curves was a second order polynomial. The correlation factors (R2) for these two curves gave values of R2 = 0.4567 (BET) and R2 = 0.5337 (APS). These R2 values indicate a poor correlation between each of the plotted data sets. More importantly these results point to the limitations of relying solely on automated particle sizing methods.
3.2 Elemental analysis of each sample using EDS
EDS elemental analysis determined that the only detectable elements were Ti4+ and O2− present in each of the seven samples in this study. Therefore, there were no contaminants of trace elements above the detection limit of 0.1% by weight. This affirmed that the received samples were the analytical grades certified by the manufacturers. It also confirmed that there were no contaminants remaining from the synthesis method. A representative set of EDS micrographs from powder population 1 [Appendix B], demonstrates the presence of only Ti4+ and O2−.3.3 Crystal structure of anatase titania using powder X-ray diffraction
Each of the PXRD patterns obtained matched the JCPDS file #00-0634-0863 (ref. 120) for synthetic anatase titania, confirming the structure and composition of each powder sample. The PXRD micrograph for the powder population with an average primary particle of d ≅ 12.69 nm is presented in Fig. 2. The XRD micrographs for each of the other six samples are presented in Appendix C.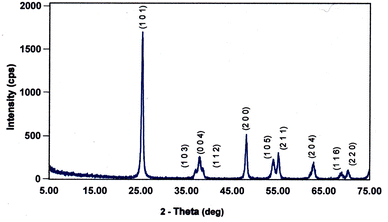 | ||
| Fig. 2 The PXRD pattern for the sample with an average diameter ≅12.69 nm. The indexed peaks fit those in the JCPDS file #00-0634-0863 (ref. 120) for synthetic anatase titania. | ||
For a second phase in a sample to be detected in the PXRDs taken, using the equipment described in Section 2.7, there must be at least 0.2 wt% of the powder sample.117 From Fig. 2 any possible contaminant within the surface penetration depth of the X-ray beam was below the equipment's detection limit. Like the result in Fig. 2, the PXRD micrographs in Appendix C demonstrate only the presence of a single-phase of synthesized crystalline anatase titania. The slight count decrease in the base line [Fig. 2] from 5° 2-theta to approximately 15° 2-theta is an artifact of the equipment.121,122 In addition, the XRD micrographs in Appendix C support this contention, as even the particle population with a d = 5.31 nm has a completely flat baseline from 10° 2-theta to 75° 2-theta.
In addition, work by Samad et al.123 examined the effect of surface loading of a second oxide (i.e., alumina (Al2O3)) on to a pristine surface of a primary oxide (i.e., silica (SiO2)) on the samples PZC value. Therefore, this study can also be used to simulate the effect of surface contamination on a sample's surface. An examination of all the curves where PZC values change indicated that at/or below a surface loading of 0.2 wt%, the shift in PZC values would be less than ±0.2 pH units. This work indicates that even had there been a small amount of secondary contamination on the samples surface used in this study, its effect on the pHPZC values measured would have been minimal.
3.4 Mass titration results
Titration curves were obtained by plotting the cumulative volume of each titrant (i.e. 0.01 N hydrochloric acid (HCl) or 0.2 N sodium hydroxide (NaOH)) against their pH at that volume. Intersection of the three curves identified the powder populations PZC value. Fig. 3 presents the results for the powder population with an average primary particle diameter ≅12.69 nm. Appendix D presents the titration method and data for the other six other powder populations.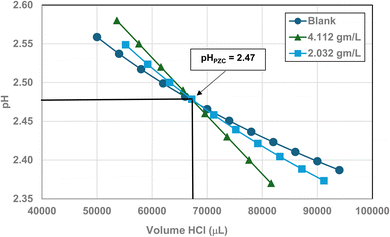 | ||
| Fig. 3 Mass titration curves of anatase titania with an average primary particle with a d ≅ 12.69 nm. Intersection of the three curves indicate the materials pHPZC = 2.47. | ||
3.5 Changes in PZC values across the decreasing average primary particle diameter sizes
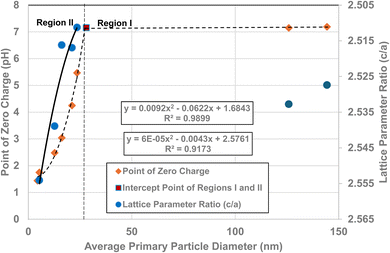
A plot of the normalized average primary particle sizes (i.e., diameters) against its PZC value for each anatase titania sample revealed two regions [Fig. 4]. A regression curve was fitted to the experimental data in Region II. A best fit function was found to be a second order polynomial with a correlation value of R2 = 0.9921. To determine the intersection of Regions I and II. The equation for the regression curve was used to calculate the average primary particle diameter where pHPZC = 7.17. The predicted intersection of the curves for Regions I and II is at d ≅ 29 nm, with a pHPZC = 7.17.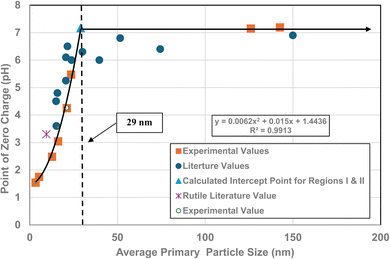 | ||
| Fig. 4 Values for both experimental and literature124–134 pHPZC values are plotted against their normalized average primary particle diameter. The experimental point at pHPZC = 4.26 was measured using 0.1 M NaOH for the electrolyte, and 0.01 M NaClO4 as the titrant.134 | ||
In addition, literature pHPZC values for anatase titania, which were measured within the parameters set in Section 2.0, were plotted alongside the experimental results. They confirm the shift toward lower pHPZC values as the average primary particle size decreases in Region II below a d ≅ 29 nm. In addition, the values above d ≅ 29 nm, indicate pHPZC values remain roughly constant (pHPZC = 6.0–6.9)124–133 as the average primary particle diameters increase, thus supporting the findings of a Region I as indicated by the experimental values. The scatter in the literature data [Fig. 4], which also used automated particle sizing techniques, reemphasizes the limitations of these methods.
3.6 Correlation of PZC values and band gap
Region I demonstrates essentially no changes in the PZC values with a decreasing/increasing average primary particle diameter. The PZC values of each particle population are pH = 7.15 (d ≅ 126 nm) and PZC = 7.19 (d ≅ 142 nm), are well within the calibration error (pH = ± 0.2) of the equipment (HI 2214 pH/ORP meter). The difference between the two powder populations diameters is ∼16 nm. In Region II [Fig. 4] a change of this magnitude in the average particle diameter of two powder populations would result in a shift of its PZC value by approximately 3.5 pH units. This demonstrates that the underlying physical parameters responsible for changing PZC values in Region II does not occur above the average primary particle sizes greater than d ≅ 29 nm in Region I.The results in Fig. 4 also indicate that the experimental procedure used (Section 2) succeeded in minimizing the effects of all the other factors cited. Fig. 4 suggests that there is an unidentified physical parameter responsible for the decrease in PZC values below the normalized average primary particle size of d ≅ 29 nm for anatase titania. This parameter would need to be found at the surface, as pHPZC is purely a surface measurement.
The PXRD patterns [Fig. 21, Appendix C] of each powder population confirmed that the structures are anatase titania. As the bulk/surface structures of this material are known to be identical9,10 this confirms the structure at the solid/liquid interface is anatase titania. Based on Eh-pH diagrams, the dominant species TiO2 is stable from a pH = 1 to pH = 14.35 This eliminated any thermodynamic driving force that would change the bulk/surface structure's oxidation state and/or coordination number, as pHPZC values in Region II decrease.
One of the physical parameters known to change with decreasing average primary particle size below a given diameter, is anatase titania's indirect band gap. Lin et al.111 demonstrated that this is the result of increasing surface bond lengths. Their work demonstrated that the average diameter of anatase titania at which the indirect band gap values begin decreasing is at d ≅ 28 nm, within 1 nm of the projected intercept point (d ≅ 29 nm) of Regions I and II [Fig. 4]. This diameter is effectively identical to the calculated value at which pHPZC values start decreasing. That made it possible to obtain values for the indirect band gap of anatase titania from the literature. The protocol used to choose the band gap literature values are as follows:
(1) The parameters used to determine the method for minimizing the factors affecting pHPZC values were applied to the measured indirect band gap values from the literature [Section 2].
(2) The literature used presented all the raw data used to obtain their results (i.e., transmission electron micrographs), specific surface area measurements (BET), band gap spectra, powder X-ray diffraction, high resolution transmission electron microscope, TEM, etc. The results presented were then reconfirmed using the author's raw data.
(3) The particle populations, whose band gap values were used, possessed a cubic to spherical morphology, thereby matching the shapes present in powder populations measured [Fig. 16, Appendix B]. This avoided variations in the data used due to differing particle morphologies, that is known to affect indirect band gap values.135,136
(4) Band gap measurements were made at ambient temperature and pressure to match the experimental conditions under which each sample population pHPZC was measured. This is because temperature and pressure have been demonstrated to affect band gap values [ref. 137, Appendix A].
(5) The samples were not pretreated as this is known to affect the material's indirect band gap.138
A plot of multiple literature indirect band gap values139–145 and experimental pHPZC values against their average primary particle diameter demonstrated a clear visual correlation between the two parameters [Fig. 5a]. A regression curve fit of the indirect band gap values in Region II resulted in a correlation value of R2 = 0.9645 with an intercept value between the two Regions of d ≅ 29 nm. In Region I there is essentially no change in the indirect band gap and pHPZC values. As the average primary particle size decreases in Region II, the indirect band gap values (i.e. increasing surface bond lengths) and pHPZC values demonstrate an almost identical shift toward lower values along the fitted regression curve. These initial results demonstrate that there is a strong visual correlation between the indirect band gap and all the experimental pHPZC values.
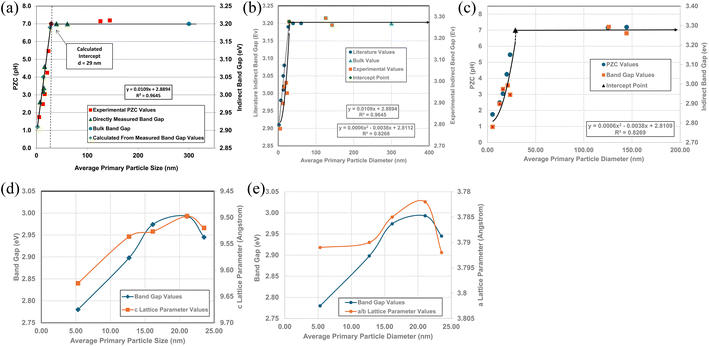 | ||
| Fig. 5 (a) A visual correlation of experimental PZC and literature indirect band gap values137–142 against their average primary particle diameter. The equation calculates band gap values. (b) Visual correlation between the literature and experimental indirect band gap values. The literature values gave a best fit curve for a linear function, with a correlation value R2 = 0.9645.137–142 Experimental values gave a best fit curve for a polynomial function with an R2 = 0.8268. (c) A plot of both the experimental PZC and indirect band gap values against their average primary particle size. The equation calculates band gap values. (d) A visual correlation between band gap and c lattice parameter values plotted against their average primary particle diameter. The c lattice parameter values have been reversed to visually correlate the two curves more easily. (e) A visual correlation between band gap and a/b lattice parameter values plotted against their average primary particle diameter. The a/b lattice parameter values have been reversed to visually correlate the two curves more easily. | ||
To confirm that the indirect band gaps for each sample followed the pattern found in Fig. 5a, samples from each powder population were sent to EAG Laboratories in the Netherlands. Both the experimental and literature indirect band gaps were then plotted against their average primary particle diameter on the same graph. The results of these plots are presented in Fig. 5b. Due to the slight offset between the two sets, their band gaps were plotted on different y axis. This offset was most likely due to sample preparation [Appendix E]. Both curves consist of a Region I and Region II which mirror each other.
The best fit function for the experimental band gap value in Region II was found to be a second order polynomial with an R2 = 0.8268. The intercept point band gap values at d = 29 nm are the average of the two points in Region I (eV = 3.277) and is included in the fitted curve. They demonstrate that the results also follow the same pattern found in Fig. 5a, where a strong visual correlation between the experimental and literature values is observed [Fig. 5b].
Fig. 5c presents a plot of experimental values for each sample's PZC and indirect band gap against their average primary particle diameter. The two plots allow for a visual correlation of the data. The intercept point (d = 29 nm) was used for the fitted curve of the band gap values and is the average of the measured bulk band gap values [Appendix E] in Region I. The fitted trend line for the experimental indirect band gap values, including the projected intercept point, has an R2 = 0.8269.
Fig. 5a and c demonstrate that surface bonds (i.e., band gaps) begin to lengthen below an average primary particle diameter of d ≅ 29 nm. To determine how the bonds in the lattice expand or contract, lattice parameters a/b, and c were measured from their PXRD patterns (Fig. 21, Appendix C) using the Rigaku PDXL 1.8.0.3 software. These values were also used to determine if surface roughness might have affected the measured pHPZC values.
Band gap values from d = 5.31 nm to d = 21.08 nm continually increase. Above this last particle size, the band gap then decreases significantly from eV = 2.993 to eV = 2.945 at the next particle size d = 23.54 nm. Fig. 5d and e illustrate the underlying cause for the shift downward of the band gap from particle sizes d = 21.08 nm to d = 23.54 nm. In Fig. 5d the curves for experimental band gaps and c lattice parameters demonstrate a strong visual correlation between d = 5.31 nm to d = 23.54 nm. This indicates a close paralleling of the expansion and contraction of the surface c lattice parameter bonds.
In Fig. 5e the a/b lattice parameter surface bonds between particle sizes d = 12.69 nm to 23.54 nm parallel the experimental band gap values. Below a particle size of d = 12.69 nm the a/b lattice parameters remain essentially constant, while the band gap value continues to decrease. This suggests that the c lattice parameters may play a more significant role in surface bond length (i.e., band gap) expansion than those for the a/b lattice parameters at the smallest average primary particle diameter.
Surface band gaps have been shown to correlate directly with surface roughness.146 In this case though, Fig. 5d and e demonstrate that the band gap values correlate directly with changes to the materials surface structure (i.e. bond lengths). Therefore, it was determined that there was insufficient surface roughness present on each of the particle populations used to affect the materials band gap values. Nor was it responsible for the band gap decrease from d = 21.08 nm to d = 23.54 nm.
3.7 Correlation of PZC values and lattice parameter ratios (c/a)
Fig. 5a and c demonstrate that surface bonds (i.e., band gap) begin to lengthen below an average primary particle diameter of d ≅ 29 nm. Using the measured lattice parameters the lattice parameter ratio (c/a) was calculated for each sample. These results were then plotted against their average primary particle diameters [Fig. 6]. Lattice parameter ratio data in Region II were found to have a best fit function of a 2nd order polynomial with an R2 = 0.9173. The fitted curve for the experimental pHPZC values gave an R2 = 0.9899.The curve in Fig. 6 demonstrates that as the average primary particle diameter decreases, the lattice parameter ratios (c/a) indicate that the c lattice parameter expands significantly with respect to the a/b lattice parameters. An examination of the change in the individual lattice parameter lengths was made as particle size decreased from a diameter of 23.54 nm to 5.31 nm. The a/b lattice parameters contracted slightly by ∼– 0.24%, while the c lattice parameters expanded by ∼+ 1.04%. The lattice parameter ratio (c/a) in Region I remains approximately the same, with a difference of only ∼8.4 × 10⁻⁴ nm (0.21%). These results suggest that the lattice parameter ratios (c/a) in Region I (i.e., the bulk structure) change very little [Fig. 5a–c], and by extension surface bond lengths remain constant.
3.8 Quantitative correlation of PZC values, lattice parameter ratios (c/a) and band gap
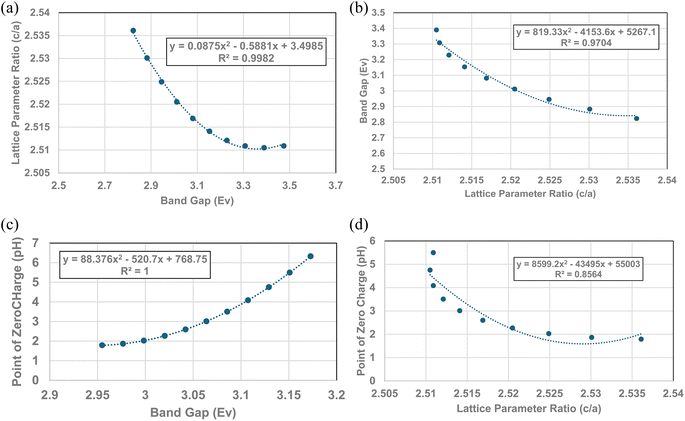
Fig. 4, 5c and 6 demonstrate strong visual correlations between the experimental pHPZC, band gap and lattice parameter ratio (c/a) values. To confirm these correlations, it was necessary to demonstrate a quantitative relationship between the two structural parameters and pHPZC. This was achieved by using the equations in Fig. 4, 5b (experimental calues), and 6, fitted to the portion of the curve in Region II for pHPZC, band gap, and lattice parameter ratio (c/a) values. This was possible, as all three regression curves have R2 values greater than 0.82, indicating a strong correlation between the data sets plotted in these figures. To achieve this, values for pHPZC, band gap, and lattice parameter ratio (c/a) were generated for diameters from 6 nm to 24 nm, in increments of 2 nm. This range was chosen as there is physical data to compare with the calculated values. As the generated values were for the same particle diameter, the factors could then be plotted directly against each other.To determine the correlation between the two structure parameters, band gap (eV) (x axis: independent variable) and lattice parameter ratio (c/a) (y axis: dependent variable), were plotted together in Fig. 7a. A regression curve was then fitted to the calculated values. A 2nd order polynomial was found to be the best fit function between these two parameters, with an R2 = 0.9969. When the plot of the two data sets was reversed (i.e., lattice parameter ratio (c/a) → x axis, band gap → y axis), making the lattice parameter ratio (c/a) the independent variable [Fig. 7b], the R2 value for the regression curve decreased to 0.9677. The higher correlation factor in Fig. 7a indicates that the lattice parameter ratio (c/a) is the dependent variable in the relationship. Therefore, the expansion and/or contraction of the band gap (i.e. surface bond lengths) are the independent factor responsible for the change in lattice parameter ratio (c/a) values.
The calculated values for the material's band gap and lattice parameter ratio (c/a) were then plotted as the independent variable against the materials calculated pHPZC values as the dependent variable. The curves are presented in Fig. 7c and d. Regressions were fitted to both curves in Fig. 7c. A 2nd order polynomial was found to be a best fit function for both curves. Based on the correlation values in Fig. 7c (R2 = 1.0) and 7d (R2 = 0.8564), the higher correlation factor in Fig. 7c indicates that materials band gap (i.e., surface bond lengths) value is the independent factor responsible for changes in the materials PZC values.
4 Discussion
Fig. 5a and c demonstrate that in Region I, pHPZC does not change as the particle size increases/decreases, nor do their band gap (i.e., surface bond length) values. Based on the Nernst Equation [eqn (8)]147 the potential difference (ψ0) goes to zero at the aqueous/solid interface when the specific surface charge (coulombs per m2) and the concentration of counter ions (mol L−1) in solution at the surface (pHPZC) are equal. Under this condition the surface potential (Ψ0) equals zero so that it can no longer draw counter ions out of solution to adsorb on to the surface. | (8) |
![[thin space (1/6-em)]](https://www.rsc.org/images/entities/char_2009.gif) 485 C mol−1), pHSolution = concentration of counter ions in solution (mol L−1) both at and away from the surface, pHPZC Solution = concentration of the solution counter ions (mol L−1) at and away from the surface which results in zero potential at the aqueous/solid interface.
485 C mol−1), pHSolution = concentration of counter ions in solution (mol L−1) both at and away from the surface, pHPZC Solution = concentration of the solution counter ions (mol L−1) at and away from the surface which results in zero potential at the aqueous/solid interface.
Based on eqn (8), the material's specific surface charge (coulombs per m2) for particles in Region I does not change since each sample's pHPZC remains constant (pHPZC ≅ 7.17). In Region II, the decrease in pHPZC values indicates that the property responsible for the increase in the materials positive specific surface charge is changing. This is evident from the increase in the specific concentration of negative counter ions at the surface (pHPZC) needed to take the aqueous/solid interface potential to zero. Based on the quantitative correlations in Fig. 7c this property appears to be controlled by changes in the materials surface band gap (i.e., surface bond lengths).
A possible explanation for changes in anatase titania's specific surface charge might be due to the material's ionic/covalent bonds. This type of bond possesses an asymmetric electron charge distribution,146 which creates surface dipoles.149 The polarity of an electric dipole is quantified by its electric dipole moment (µ = coulombmeters) [eqn (9)]:148
| µ = q × e × d | (9) |
Work by Yan et al.,150 using molecular dynamic simulation (MD) demonstrated a linear relationship between anatase titania's increasing surface area (nm2) and its electric dipole moment. Their model determined values for surface areas between 12.8 nm2 (d = 120.8 nm) to 78.5 nm2 (d = 19.6 nm). The electric dipole moments increased linearly from 27.5 Deby (D) to 182.1 D with increasing surface area.
Eqn (10) might explain possible changes to the overall ionic character (I%) of a material's surface bonds148 using the surface and bulk structure bond dipole moments. In Region I the average surface bonds are approximately 3% to 4% shorter than those within the bulk structure.151 Therefore, a value for the observed dipole moment (µobs) can be determined from the shorter surface bonds.149,150 The theoretical dipole moment (µ100%) could then be calculated from the longest possible average bond length, which is located within the materials bulk structure.146
 | (10) |
As the particle size decreases in Region II, surface bonds expand (Fig. 5a–c) resulting in the observed dipole moment of the surface bonds increasing [eqn (9)]. This results in an increase in the ionic character of the surface bonds [eqn (10)]. At the particle size where surface bonds become equal with those within the bulk (Region II) suggests they might become fully ionic (i.e., I% = 100%). This might also indicate that the bulk M2+–O2− bonds are already fully ionic.
Evidence available in the literature supports this shift in bond ionic character as particles size decreases into the nanoscale region. Pauling's152 work on electronegativity is based on the concept that each atom has a single set value. He used the bond energy of atoms to determine their electronegative value, which is typically measured using a known mass of a material at its melting temperature. His work though, did not account for the particle size effect on the melting point of materials. As the average primary particle size decreases into the nanoscale region its melting point is significantly depressed.153 Some examples of this are gold (Au),154 silver (Ag),155 tin (Sn),156 copper (Cu) and cobalt (Co)157 particles. The curves for these examples mirror the pHPZC results in Regions I and II in Fig. 4, 5a, c and 6.
Work by Gibbs et al.158 examined the question of changing electronegative (χ) values due to the increasing coordination number in different elements. As the coordination number of an anion about a cation increases the ionic radius of the cation becomes larger. This results in an increase in the bond lengths between the anions and cations in the structure.110 Gibbs et al.158 also determined that as a bond lengthens the electron density along its bond path decreases. This in turn decreases the electronegative value of the cation.
One of the examples they present is for the silicon (Si) atom. Silicon, with a coordination number (CN.) of 4, has a χ = 1.81, the same as found in Pauling's electronegative table.152 As the coordination number of Si increases to 6, then 8, χ = 1.70 and 1.46 respectively. Calculating the ionic character150–152 for these Si4+–O2− bonds [eqn (11)] results in a shift in the values from I% = 51.03% (CN: 4), to I% = 55.51% (CN: 6), and finally I% = 64.67% (CN: 8).
 | (11) |
In total, the Si4+–O2− bond ionicity increases by 13.64% with increasing bond length. Therefore, it is reasonable to conclude that expanding bond lengths directly affects the overall ionic character possibly due to its increased surface dipole moments.
Using this information, a model was developed to explain the stability of pHPZC values in Region I and their decreasing values in Region II based on structural surface changes. In Region I the surface structure is suggested by Livey and Murray's159 work and supported by density functional modeling of the anatase titania surface by Oliver et al.160 Both determined that surface atoms arrange themselves to reduce surface energy to their lowest state. This is achieved by the surface cations (i.e., Ti4+) retracting downward toward the bulk, while the anions (O2−) pull up and over the cations, partially covering them. An examination of the structure factors in Region I finds that band gap values in Fig. 5a–c and lattice parameter ratios (c/a) [Fig. 6] remain essentially constant. Therefore, the surface structure (i.e., bond lengths) remain little changed with respect to the solid/aqueous interface above an average primary particle size of d ≅ 29 nm.
When metal/oxygen atoms bond the electrons lost from the metal atoms are fully transferred to the oxygen.110 At the surface, in Region I, bond lengths for the six coordinated metal atoms are approximately 3–4% shorter than within the bulk structure.151 Therefore, based on Coulomb's Law161 [eqn (12)] the attractive electrostatic force (F) between the metal (+) and oxygen (−) atoms at the surface in Region I would be stronger than within the bulk structure. This might have resulted in the transferred electron density around the surface oxygen bowing back toward the positively charged metal atoms. The distorted portion of this transferred electron density might have then partially shielded some of the positive charge on the surface metal atoms, which are seated lower than the surface oxygen. This might have resulted in reduction of the overall global fraction of the positively charged surface which is exposed at the solid/aqueous interface.159,160
 | (12) |
As the surface bond lengths expanded between the metal and oxygen atoms in Region II (Fig. 5a–c), electrostatic attractive force between the metal atoms and the transferred electron density about the oxygen [eqn (12)] would have decreased.161 This might have resulted in the distorted electron density, which had bowed toward the metal atoms in Region I, retracting back toward the oxygen in Region II. This correlates with Gibbs et al.'s158 findings that as bond lengths increase, electron density along the bond path decreases. With the loss of the electron density shielding part of the metal surface atoms, and their movement upward toward the surface, the effect would be to increase the global fraction of the surface possessing a positive charge. This is supported by the decreasing pHPZC values in Region II, which indicate that the concentration of negatively charged counter ions being adsorbed at the surface, needed to shift surface potential to zero, is increasing [eqn (8)] due to a higher specific (i.e. global) surface area with a positive charge.
The increase in surface bond lengths might also account for the contraction of the a/b lattice parameters. As the distorted electron density retracted back toward the oxygen atoms in Region II, the electron density might have become more evenly distributed about the surface oxygen atoms, resulting in the anions becoming more spherical. It might have then resulted in a decrease in their ionic radius, thereby reducing the volume occupied by each oxygen atom in the lattice. This might account for the small contraction (∼0.24%) of the a/b lattice parameters.
5 Conclusions
The results in this work demonstrate that a protocol to selectively minimize the effect of all the factors affecting a metal oxide's pHPZC has been developed. The findings obtained using this method allowed identification of the surface structure factor and property affecting a metal-oxide/hydroxide's point of zero charge. This was achieved by first demonstrating a direct visual correlation of the pHPZC values with the materials band gap (i.e., surface bonds) [Fig. 5a and c], and lattice parameter ratio (c/a) [Fig. 6]. The quantitative correlations established [Fig. 7a–d] demonstrate changes in the materials surface band gap (i.e., surface bond length) is the independent structural parameter responsible for the shift in both the lattice parameter ratio (c/a) and pHPZC values in Region II. The final correlation found between surface bond expansion [Fig. 5a and c] and pHPZC was the increase in the surface bond's percent ionic content [eqn (9) & (10)] in Region II. These findings also demonstrate that particle size and morphology, while affecting those surface structure factors and properties responsible for the change in pHPZC values, are not the underlying cause responsible for this change.Data availability
All data is available on request.Conflicts of interest
There are no conflicts to declare.Appendices
A Appendix A
 | (13) |
Group 1 possesses SSA's below 60 m2 g−1, with none of the source literature specifying dimensions for an acicular crystal.47–55 This indicated that the average particle morphology was roughly cubic to rectangular. Group 2 data sets, with SSAs over 60 m2 g−1, did specify that the particles possessed an acicular (needle like) morphology.56–59 All the data sets used provided PZC, and specific surface area. Data sets possessing acicular morphologies also provided the dimensions (i.e., length, width, depth) for the average primary particle size of that population.
The first step was to determine what happened when the average primary particle diameter was determined using only one measurement method for both data sets. This was accomplished using eqn (13), each data set's SSA and the density (ρ = 4.28 g cm3) for goethite.42 Then the calculated average primary particle diameter for each data set was plotted against its PZC value. The results are presented in Fig. 1a.
An examination of the results demonstrates that PZC values for Group 1 (cubic to rectangular particles) remains constant above an average spherical primary particle diameter of approximately 65 nm. Below a d ≅ 65 nm, PZC values then decrease almost linearly. Group 2 (acicular particles) demonstrates little apparent change in the material's PZC value regardless of the particle diameter.
From the results in Fig. 1a, there appears to be no correlation between the two groups even though they all possess the same phase. The only difference between them is their morphology.
The cause of this discrepancy is most likely due to eqn (13), as the spherical/cubic/rectangular particle diameter is inversely related to its SSA. This geometric relationship though does not hold for the acicular particles in Group 2. These differences may be why morphology2 was identified as affecting PZC values.
The next step was to calculate diameters for the acicular particles had they possessed spherical to cubic morphologies with the same volume. This was accomplished by first determining the volume (VAP) of the average acicular particle size for its population from the dimensions provided in each paper.56–59 The average acicular volume was then set equal to the equation for a sphere (VS = 4/3 × π × r3)60 and rearranged to obtain the particle's equivalent spherical radius (RES) had it possessed that morphology [eqn (14)]. Placing the equivalent spherical radius into eqn (15) gives the equivalent spherical diameter (DES) for the acicular particle. Therefore eqn (14) and (15) effectively normalized the morphology of the particles in Groups 2 with Group 1.
 | (14) |
| DES = 2 × RES | (15) |
When the DES values were plotted against their PZC values alongside the data sets from Group 1 [Fig. 1b] a single curve emerged. The fitted regression curve, with a correlation factor (R2 = 0.9058) indicates that the PZC values, the spherical to cubic particle diameters (DSP) and the normalized/equivalent acicular diameters (DES) sets, at and below approximately 65 nm are strongly correlated.
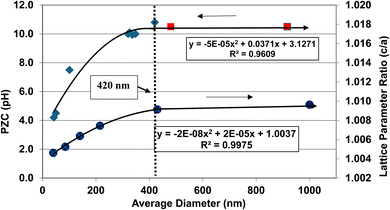 | ||
| Fig. 8 Plots of the average primary particle size, PZC values and their lattice parameter ratio (c/a) for BaTiO3.61–72 The method presented in Section A.1 was used to obtain the average diameter of each data set. The two sets of data were plotted together so a visual correlation could be obtained. | ||
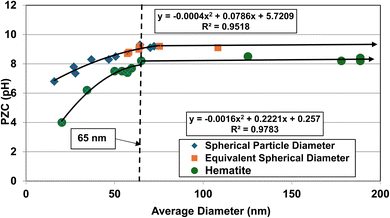 | ||
| Fig. 9 Plots of the average primary particle size against their PZC values for goethite (upper curve)47–59 and hematite (lower curve)86–95 were plotted together so the results could be visually correlated. The method presented in Section A.1 was used to obtain the average diameter of each data set. | ||
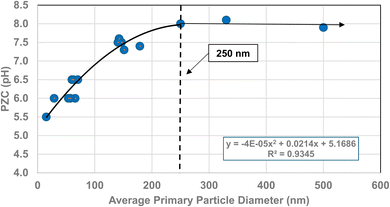 | ||
| Fig. 10 A plot of the average primary particle size and PZC values for 3% doped tetragonal ZrO2.96–109 The method presented in Section A.1 was used to obtain the average diameter of each data set. | ||
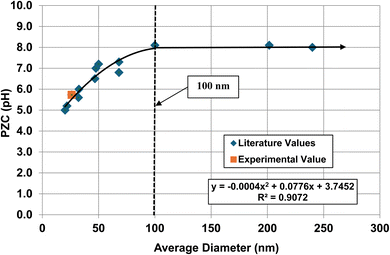 | ||
| Fig. 11 A plot of the average primary particle size against their PZC values for monoclinic zirconia (ZrO2).73–85 The method presented in Section A.1 was used to obtain the average diameter of each data set. The experimental point was measured in 0.1 M NaClO4 electrolyte using 0.01 M NaOH as the titrant.134 | ||
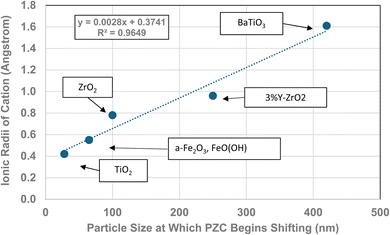 | ||
| Fig. 12 The effect of the largest cation ionic radius on the particle size at which the metal-oxide PZC values begin to decrease.110 | ||
| Formula | Particle size | Coord. no. | Oxidation # | Ionic radius (Angstrom) | Largest cation |
|---|---|---|---|---|---|
| ZrO2 | 100 | 7 | 4 | 0.78 | Zr |
| TiO2 | 28 | 6 | 4 | 0.42 | Ti |
| BaTiO3 | 420 | 12 | 2 | 1.61 | Ba |
| 3% Y-ZrO2 | 250 | 7 | 3 | 0.96 | Y |
| FeO(OH) | 65 | 6 | 3 | 0.55 | Fe |
| α-Fe2O3 | 65 | 6 | 3 | 0.55 | Fe |
B Appendix B
 | ||
| Fig. 20 (a–d) Are the EDS micrographs of the powder population in Fig. 13. (b) The EDS micrographs for Ti4+ and O2−. (c) The EDS micrograph for O2− and (d) the EDS micrograph for Ti4+ (d). No trace elements were found in figures (b)–(d). | ||
| Powder population | Sample designation | Specific surface area (m2 g−1) | Spherical diameter from SSA (nm) | Aerodynamic particle sizer diameter (nm) | TEM avg. particle diameterc (nm) | pHPZC |
|---|---|---|---|---|---|---|
| a U. S. nanomaterial research. b Spring Sky nanomaterials. c This work. | ||||||
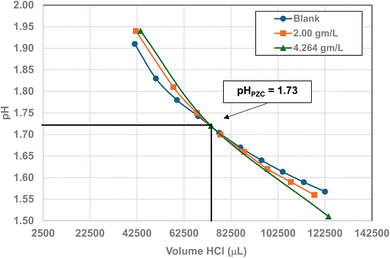
| 1 | US3838a | 480–650 | 3.22–2.38 | 5.00 | 5.307 ± 0527 | 1.73 |
| 2 | US3490 | 200–240 | 7.73–6.44 | 18 | 12.689 ± 2.397 | 2.47 |
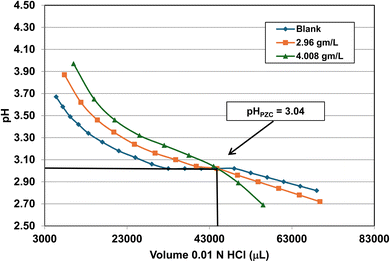
| 3 | US3492 | 60 | 25.8 | 15 | 16.131 ± 3.958 | 3.04 |
| 4 | US3493 | 40 | 38.7 | 35 | 21.108 ± 4.059 | 4.25 |
| 5 | 7910DLb | 50–150 | 30.93–10.31 | 10–30 | 23.538 ± 4.044 | 5.46 |
| 6 | US3411 | 85 | 18.2 | 100 | 126.002 ± 29.775 | 7.15 |
| 7 | US1152M | 10 | 154.6 | 800 | 142.02 ± 36.321 | 7.19 |
| Powder population | Percent variation using SSA (m2 g−1) | Percent variation aerodynamic particle sizer |
|---|---|---|
| 1 | 39.325–55.154 | 5.785 |
| 2 | 39.081–49.247 | 41.855 |
| 3 | 59.941 | 7.011 |
| 4 | 22.229 | 28.936 |
| 5 | 31.930–56.199 | 57.516–27.454 |
| 6 | 149.515 | 20.632 |
| 7 | 8.858 | 463.301 |
| Average value | 51.148 | 81.561 |
Percentage difference between the TEM measured average primary diameters and the values using the Aerodynamic Particle Sizer and the values provided by each vendor.112,113 Eqn (16) was then used to calculate the percentage difference between the TEM values and the BET (m2 g−1) and the values measured using the Aerodynamic Particle Sizer. The results are presented in Table 4.
 | (16) |
C Appendix C (Fig. 21)
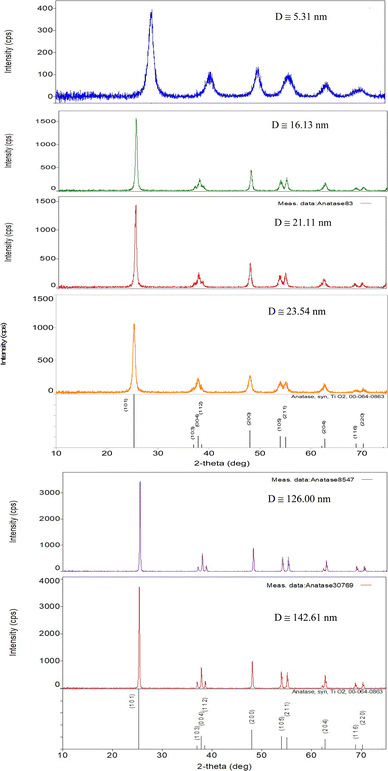 | ||
| Fig. 21 PXRD patterns for each of the samples used in this work, save Fig. 2. Each pattern fits the PXRD pattern JCPDS #00-064-0863 for synthesized anatase titania.120 | ||
D Appendix D
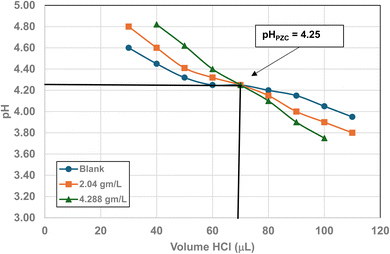 | ||
| Fig. 24 Mass titration curves of anatase titania with an average primary particle with a d ≅ 21.108 nm. Intersection of the three curves indicate the materials pHPZC = 4.25. | ||
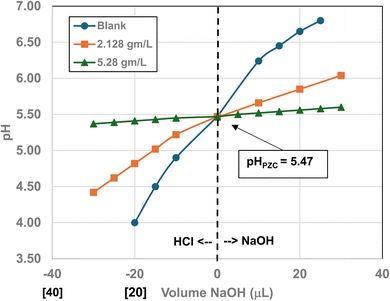 | ||
| Fig. 25 Mass titration curves of anatase titania with an average primary particle of d ≅ 23.538 nm. Intersection of the three curves indicates the materials pHPZC = 5.46. | ||
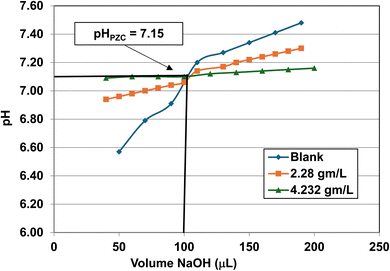 | ||
| Fig. 26 Mass titration curves of anatase titania with an average primary particle with a d ≅ 126.002 nm. Intersection of the three curves indicate the materials pHPZC = 7.15. | ||
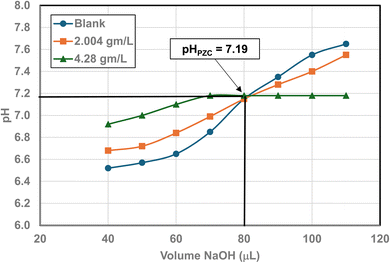 | ||
| Fig. 27 Mass titration curves of anatase titania with an average primary particle with a d ≅ 142.614 nm. Intersection of the three curves indicate the materials pHPZC = 7.19. | ||
A volume of 250 mL 0.01 M KCl electrolyte solution was used in each run. It was prepared from a 1.0 M potassium chloride (KCl) solution (Aldon Corporation) and Reagent grade de-ionized water (DI) (ChemLab). A 600 mL Nalgene beaker was employed to avoid silica dissolving into the solution from a silica glass beaker162 and allow for large volumes of titrants. The anatase titania sample was taken directly from the manufacturer's container, measured on weighing paper using a GEM20 jeweler's scale (Smart Weigh), accurate to three significant figures, and then placed into the electrolyte solution. This procedure was used to minimize contamination due to handling.
The three runs consisting of samples sizes, 0.0 g L−1 (blank), ∼2.0 g L−1 and ∼4.0 g L−1 in the electrolyte. The pH was adjusted by hand using both a 200 µL and a 1000 µL Gilson pipettor. Each run was performed by only decreasing or increasing the pH of the system during each run. The titrants used were 0.01 N hydrochloric acid (HCl) (LabChem) or 0.2 N sodium hydroxide (NaOH) (LD Carlson Corporation). Interception of these three titration curves determined the materials PZC. The titrations were performed at ambient temperature and pressure. The solution acid molality/molarity was kept low to avoid problems with dissolution of the sample.115 This eliminated a situation where the surface dissolved and then reprecipitated back onto the surface of the particles during the titration runs.
Fig. 22 through 27 present the titration results of powder populations with average primary particle diameters of 5.307 nm, 16.131 nm, 21.108 nm, 23.538 nm, 126.002 nm, and 142.614 nm. The titration curve for the powder population with an average primary particle diameter of 12.689 nm is presented in Fig. 3. Titrations in Fig. 22 and 23 required between 6 to 7 hours. The shift in the direction in the titration curves in Fig. 25 and 26 from Fig. 22–24 was due to the direction of the titrant used.163 In Fig. 22–24 0.01 N HCl, was the titrant, whereas in Fig. 25–27 0.2 N NaOH was the titrant.
It was possible to achieve pH values below 2.0 pH units as the anatase titania is a photoelectric catalyst which splits water into O–H− and H+.164–166 Therefore, based on the work by Brown et al.'s167 model of the Stern layer, Outer Helmholtz Plane (OHP) and diffuse region (i.e. solution) the O–H− would be adsorbed onto the surface just outside the OHP to neutralize the Ti4+ surface atoms. At the same time the H+ ions would remain in the diffuse region (i.e. solution), resulting in a pH concentration below 2.0 pH units.
Fig. 25 is a combination of three sets of titrations (i.e. 6 individual titration curves). The initial pH values recorded for all 4 runs with a sample, before the titration began, were between the values of pH = 5.46–5.48. The first leg of the blank run was run first using 0.01 N HCl, and the second leg using 0.2 N NaOH. The first titration runs with a sample used 0.2 N NaOH. The second set of titrations with each sample were performed using 0.01 N HCl as the titrant. The weight for each run in the second set of titrations using 0.2 N NaOH was 0.0 g L−1, 2.129 g L−1, and 5.285 g L−1.
E Appendix E
| Sample diameter (nm) | Hydraulic press preparation (sample pressed at 10 tons) | XRD preparation (sample pressed at low pressure) | ||
|---|---|---|---|---|
| Cut off point (nm) | Bandgap (eV) | Cut off point (nm) | Bandgap (eV) | |
| 5.307 | 382.59 | 3.249 | 422.18 | 2.780 |
| 12.689 | 393.54 | 3.159 | 428.92 | 2.898 |
| 16.131 | 385.38 | 3.226 | 418.05 | 2.974 |
| 21.108 | 389.18 | 3.194 | 415.29 | 2.993 |
| 23.538 | 401.60 | 3.095 | 447.09 | 2.945 |
| 126.002 | 393.07 | 3.163 | 377.50 | 3.293 |
| 142.614 | 390.14 | 3.186 | 381.25 | 3.261 |
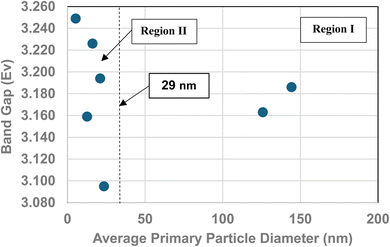 | ||
| Fig. 28 Indirect band gap values of anatase titania prepared by pressing each sample at 10 tons.119 | ||
A plot of the values in Fig. 28 demonstrates that the band gap values for Region II (5.307–23.538 nm) pressed at 10 ton were significantly different than those pressed at ambient pressure. For the samples pressed at 10 tons, band gap values decreased as the particle size increased in Region II (Fig. 28). This indicates that as the particle size decreased, surface bond lengths also decreased. For the hand pressed samples at ambient pressure resulted in the exact opposite trend. As particle size decreased in Region II, surface bond lengths increased [Fig. 5b]. Therefore, these results demonstrate the importance of maintaining the same physical conditions under which different techniques are used to examine a system. This allows for the correlation of different properties, when measured under identical experimental conditions.
References
- T. Li, S. Ciampi and N. Darwish, The Surface Potential of Zero Charge Controls the Kinetics of Diazonium Salts Electropolymerization, ChemElectroChem, 2022, 43(17), 1–5 Search PubMed.
- F. Borghi, V. Vyas, A. Podesta and P. Milani, Nanoscale Roughness and Morphology Affect the Isoelectric Point of Titania, PLoS One, 2013, 8(7), 1–14 Search PubMed.
- O. Akbarzadeh, N. A. M. Zabidi, Y. A. Wahab, N. A. Hamizi, Z. Z. Chowdhury, Z. M. A. Merican, M. A. Rahman, S. Akhter, M. Shalauddin and M. R. Johan, Effects of Cobalt Loading, Particle Size, and Calcination Condition on Co/CNT Catalyst Performance in Fischer Tropsch Reactions, Symmetry, 2019, 11(7), 1–18 Search PubMed.
- Y. Wang, M. I. Tejodor-Tejodor, W. Tan and M. A. Anderson, Influence of Solution Chemistry on the Dielectric Properties of TiO2 Thin-Film Porous Electrodes, J. Phys. Chem. C, 2016, 120(38), 21543–21551 CrossRef CAS.
- W. Tan, T. Gao and Y. Wang, Influence of Surface Potential on the Capacitive Performance of the TiO2 Thin-Film Electrode with Different Crystalline Forms, Langmuir, 2020, 36(14), 3836–3842 CrossRef CAS PubMed.
- Y. Wang, M. I. Tejodor-Tejodor, W. Tan and M. A. Anderson, Importance of Protons and Specifically Adsorbing Ions on Changing Capacitance, Space Charge Potential Inside the Solid, and the Interfacial Potential at TiO2 Aqueous Solution Interface, Electrochim. Acta, 2016, 219, 577–587 CrossRef CAS.
- R. H. Yoon, T. Salman and G. Donnay, Predicting Points of Zero Charge of Oxides and Hydroxides, Colloid Interface Sci., 1979, 70(3), 483–493 CrossRef CAS.
- M. Bowker, The surface structure of titania and the effect of reduction, Curr. Opin. Solid State Mater. Sci., 2006, 10, 153–162 CrossRef CAS.
- Y. Xia, K. Zhu, T. C. Kaspar, Y. Du, B. K. Birmingham, K. T. Park and Z. Zhang, Atomic Structure of the Anatase TiO2 (001) Surface, J. Phys. Chem. Lett., 2013, 4(17), 2958–2963 CrossRef CAS.
- G. A. Parks, The Isoelectric Points of Solid Oxides, Solid Hydroxides, and Aqueous Hydroxo Complex Systems, Chem. Rev., 1965, 65(2), 177–198 CrossRef CAS.
- D. Linden and T. B. Reddy, Handbook of Batteries, McGraw-Hill Companies Inc., Two Penn Plaza, New York, N. Y, 2002 Search PubMed.
- A. B. Carlson, D. G. Gisser and F. K. Manasse, Electrical Engineering Concepts and Applications, Addison-Wesley Publishing Company, Inc., United States of America. 1981 Search PubMed.
- S. R. Rao and J. Leja, Surface Chemistry of Froth Flotation, Volume 1: Fundamentals, Springer Science + Business Media, LLC, New York, 2nd edn, 2004 Search PubMed.
- A. Kaya and Y. Yukselen, Zeta-Potential of soils with surfactants and its relevance to electrokinetic remediation, J. Hazard. Mater. B, 2005, 120, 119–126 CrossRef CAS PubMed.
- S. K. Khan and S. Kar, Surface charge is a function of organic carbon content and mineralogical compositions of soil, Eurasian J. Soil Sci., 2018, 7(1), 59–63 CAS.
- O. M. Bockris, A. K. N. Reddy and M. Gamboa-Aldeco, Modern Electrochemistry, Volume 2, Fundamentals of Electrodics, Kluwer Academic, Plenum Publishers, New York, Boston, Dordrecht, London, Moscow, 2nd edn, 2000 Search PubMed.
- F. Sabbagh, I. I. Muhamed, Z. Nazari, M. Peyman and N. M. Katir, Investigation of acyclovir-loaded, acrylamide-based hydrogels for potential use as vaginal ring, Mater. Today Commun., 2018, 16, 274–280 CrossRef CAS.
- P. C. Hiemenz, Principles of Colloid and Surface Chemistry, Marcel Dekker, Inc., New York, Basel, 2nd edn, 1986 Search PubMed.
- V. Seiβ, S. Thiel and M. Eichelbaum, Preparation and Real-World Applications of Titania Composite Materials for Photocatalytic Surface, Air, and Water Purification: State of the Art, Inorganics, 2022, 10, 139–184 CrossRef.
- R. Gomez, T. Lopez, E. Ortiz-Islas, J. Navarrete, E. Sanchez, F. Tzompanztzi and X. Bokhimi, Effect of sulfation of the photoactivity of TiO2 sol-gel derived catalysis, J. Mol. Catal. A: Chem., 2003, 193, 217–226 CrossRef CAS.
- U. Yogeswaran and S. M. Chen, A Review on the Electrochemical Sensors and Biosensors Composed Nanowires as Sensing Material, Sensors, 2008, 8, 290–313 CrossRef CAS PubMed.
- K. K. Gupta, M. Jassal and A. K. Agrawal, Sol-gel derived titanium dioxide finish of cotton fabric for self-cleaning, Indian J. Fibre Text. Res., 2008, 33, 443–450 CAS.
- N. Muhammad, K. P. S. Zanon, M. N. Y. Iha and S. Ahmed, The Use of Rutile- and Anatase-Titania Layers towards Light Scattering in Dye-Sensitized Solar Cells, ChemistrySelect, 2018, 3, 10475–10482 CrossRef CAS.
- F. Azeez, E. Al-Hetiani, M. Arafa, Y. Abdelmonem, A. A. Nazeer, M. O. Amin and M. Madkour, The effect of surface charge on photocatalytic degradation of methylene blue dye using chargeable titania nanoparticles, Sci. Rep., 2018, 8, 7104–7413 CrossRef PubMed.
- M. Zeng, Influence of TiO2 Surface Properties on Water Pollution Treatment and Photocatalytic Activity, Bull. Korean Chem. Soc., 2013, 34(3), 953–956 CrossRef CAS.
- A. Gul, R. Ullah, J. Sun, T. Munir and S. Bai, The fabrication of TiO2–supported clinoptilolite via F− contained hydrothermal etching and resultant highly energetic {0 0 1} facet for the enhancement of its photocatalytic activity, RSC Adv., 2021, 11, 17849–17859 RSC.
- F. Azeez, E. Al-Hetlani, M. Arafa, Y. Abdelmonem, A. Abdel Nazeer, O. M. Amin and M. Madkour, The effect of surface charge on photocatalytic degradation of methylene blue dye using chargeable titania nanoparticles, Sci. Rep., 2018, 8, 7104–7113 CrossRef PubMed.
- M. Barisik, S. Atalay, A. Beskok and S. Qian, Size Dependent Surface Charge, Properties of Silica Nanoparticles, J. Phys. Chem. C, 2014, 118, 1836–1842 CrossRef CAS.
- D. A. Palmer, M. L. Machesky, P. Benezeth, D. J. Wesolowski, L. M. Anovitz and J. C. Deshon, Adsorption of Ions on Zirconium Oxide Surfaces from Aqueous Solutions at High Temperatures, J. Solution Chem., 2009, 38, 907–924 CrossRef CAS.
- K. P. Ananthapadmanabhan and P. Somasundaran, Surface Precipitation of Inorganic Surfactants and Its Role in Adsorption and Flotation, Colloids Surf., 1985,(13), 151–167 CrossRef CAS.
- P. Gy, Sampling of Particulate Materials, Theory and Practice, Elsevier, New York, Revised 2nd edn, 1982 Search PubMed.
- J. J. Gulicovski, L. S. Cerovic and S. K. Milonjic, Point of Zero Charge and Isoelectric Point of Alumina, Mater. Manuf. Processes, 2008,(23), 615–619 CrossRef CAS.
- C. Knapp, J. Gil-Llambias, M. Gulppi-Cabra, P. Avila and J. Blanco, Phase Distribution in Titania–Sepiolite Catalyst Supports Prepared by Different Methods, J. Mater. Chem., 1997, 7(8), 1641–1645 RSC.
- R. M. Torres Sanchez, B. F. Aglietti and J. M. Porto Lopez, PZC Modification of Mechanochemically Treated Kaolinite, Mater. Chem. Phys., 1988, 20, 27–38 CrossRef.
- D. G. Brookins, Eh-Ph Diagrams for Geochemistry, Springer-Vorlag, Berlin, Heidelberg, New York, London, Paris, Tokyo, 2012 Search PubMed.
- T. Preocanin and N. Kallay, Point of Zero Charge and Surface Charge Density of TiO2 in Aqueous Electrolyte Solution as Obtained by Potentiometric Mass Titration, Croat. Chem. Acta, 2006, 79(1), 95–106 CAS.
- M. Kosmulski, Chemical Properties of Material Surfaces, in Surfactant Science Series, ed. Hubbard, A. T., Marcel Dekker, Inc., New York, NY, vol. 102, 2001 Search PubMed.
- M. Kosmulski, Compilation of PZC and IEP of sparingly soluble metal oxides and hydroxides from literature, Adv. Colloid Interface Sci., 2009, 152, 14–25 CrossRef CAS PubMed.
- K. Suttiponparnit, J. Jiang, M. Sahu, S. Suvachittanonot, T. Charinpanitkul and P. Biswas, Role of Surface Area, Primary Particle Size, and Crystal Phase on Titanium Dioxide Nanoparticle Dispersion Properties, Nanoscale Res. Lett., 2011, 6, 27–35 CrossRef PubMed.
- X. Lin, J. Li, S. Ma, G. Liu, K. yang, M. Tong and D. Lin, Toxicity of TiO2 Nanoparticles to Escherichia Coli: Effect of Particle Size, Crystal Phase and Water Chemistry, PLoS One, 2014, 9(10), e110247 CrossRef PubMed.
- R. Hogg, Particle Technology Laboratory Lecture Notes and Laboratory Manual: Parts 1 and 2, Department of Mineral Engineering, Mineral Processing Section, The Pennsylvania State University, 1991 Search PubMed.
- R. C. Weast, D. R. Lide, M. J. Astle and W. H. Beyer, CRC Handbook of Chemistry and Physics, CRC Press, Inc., Boca Raton, FL, 70th edn, 1989 Search PubMed.
- M. Leffler, Chemistry Dept., University of Connecticut, Unpublished results, 2021.
- M. Kosmulski, S. Durand-Vidal, E. Maczka and J. B. Rosenholm, Morphology of synthetic goethite particles, J. Colloid Interface Sci., 2004, 271, 261–269 CrossRef CAS PubMed.
- R. D. Piazza, T. A. G. Pelizaro, J. E. Rodriguez-Chanfrau, A. A. La Serna, Y. Veranes-Pantoja and A. C. Guastaldi, Calcium phosphates nanoparticles: The effect of freeze-drying on particle size reduction, Mater. Chem. Phys., 2020, 239, 1–6 CrossRef.
- V. Cavajda, P. Uhlik, A. Derkowski, M. Caplovicova, J. Madejova, M. Mikula and T. Ifka, Influence of grinding and sonication on the crystal structure of talc, Clays Clay Miner., 2015, 63(4), 311–327 CrossRef CAS.
- R. Botella, F. Chiter, D. Costa, S. Nakashima and G. Lefevre, Influence of hydration/dehydration on adsorbed molecules: Case of phthalate on goethite, Colloids Surf., A, 2021, 625, 1–13 CrossRef.
- C. Su and D. L. Suarez, Selenate and Selenite Sorption on Iron Oxides: An Infrared and Electrophoretic Study, Soil Sci. Soc. Am. J., 2000, 64, 101–111 CrossRef CAS.
- P. M. Borer, B. Sulzberger, P. Reichard and S. M. Kraemer, Effect of siderophores on the light-induced dissolution of colloidal iron (III) (hydr)oxides, Mar. Chem., 2005, 93, 179–193 CrossRef CAS.
- D. G. T. Rennert, Sorption of Iron-Cyanide Complexes on Iron Oxides and in Soils, Ph. D. thesis, Ruhr-Universität Bochum, Germany, 2002.
- M. Kersten and N. Vlasova, Arsenite Adsorption on goethite at elevated temperatures, Appl. Geochem., 2009, 24, 32–43 CrossRef CAS.
- A. Dabiza and M. Kersten, Exothermic Adsorption of chromate by goethite, Appl. Geochem., 2020, 123, 1–7 Search PubMed.
- A. C. Herrera Ramos and M. B. McBride, Goethite Dispensability in Solutions of Variable Ionic Strength and Soluble Organic matter Content, Clays Clay Miner., 1996, 44(2), 286–296 CrossRef CAS.
- S. Regenspurg, Characterization of Schwermannite–Geochemical Interactions with Arsenate and Chromate and Significance in Sediments of Lignite Opencast Lakes, Ph. D. thesis, University of Bayreuth, Germany, 2002.
- J. S. Zhang, R. Stanforth and S. O. Pehkonen, Proton-arsenic adsorption ratios and zeta potential measurements: Implications for protonation of hydroxyls on the goethite surface, J. Colloid Interface Sci., 2007, 315, 13–20 CrossRef CAS PubMed.
- G. Gaboriaud and J. J. Ehrhardt, Effects of different crystal faces on the surface charge of colloidal goethite (α−FeOOH) particles: An experimental and modeling study, Geoch. Cosm. Act., 2003, 67(5), 967–983 CrossRef.
- M. Kosmulski and E. Mączka, Surface Charges at Goethite–Electrolyte Solution Interface, VII Ogólnopolska 10 Konferencja Naukow, 2013.
- J. Liu, R. Zhu, L. Ma, H. Fu, X. Lin, S. C. Parker and M. Molinari, Adsorption of phosphate and cadmium on iron (oxyhdr)oxides: A comparative study on ferrihydrite, goethite, and hematite, Geoderma, 2021, 363, 1–11 Search PubMed.
- T. P. Luxton, C. J. Tadanier and M. J. Eick, Mobilization of Arsenite by Competitive Interaction with Silicic Acid, Soil Sci. Soc. Am. J., 2006, 70, 204–214 CrossRef CAS.
- A. Shenk, Calculus and Analytic Geometry, Goodyear Publishing, Inc., Santa Monica, California, 2nd edn, 1979 Search PubMed.
- S. Lee, U. Paik, H. A. Hacklye, Y. G. Jung and K. J. Yoon, Microstructure and permittivity of sintered BaTiO3; influence of particle surface chemistry in an aqueous medium, Mater. Res. Bull., 2004, 39, 93–102 CrossRef CAS.
- W. H. Shih, D. Kisailus and Y. Wei, Silica coating on barium titanate particles, Mater. Lett., 1995, 24, 13–15 CrossRef CAS.
- B. Y. Yu, W. C. J. Wei and K. C. Hsu, Study of processing adsorption mechanism of amphoteric polyelectrolyte in BaTiO3 colloids suspension, J. Chem. Res., 2004, 5(2), 163–170 Search PubMed.
- B. I. Lee, Electrokinetic Behavior of Barium Titanate Powders in Water, J. Korean Phys. Soc., 1998, 32(2), S1152–S1155 CAS.
- Z. C. Chen, T. A. Ring and J. Lamaitre, Stabilization and Processing of Aqueous BaTiO3 Suspensions with Polyacrylic Acid, J. Am. Ceram. Soc., 1992, 75(12), 3201–3208 CrossRef CAS.
- A. W. M. De Laat and G. L. T. van den Heuvel, Competitive and displacement adsorption of polyvinyl alcohol and the ammonium salt of a polyacrylic acid on BaTiO3, Colloids Surf., A, 1993, 70, 179–187 CrossRef CAS.
- A. W. M. de Laat and W. P. T. Derks, Colloidal stabilization of BaTiO3 with poly (vinyl alcohol) in water, Colloids Surf., A, 1993, 71, 147–153 CrossRef CAS.
- S. S. Tripathy and A. M. Raichur, Dissolution of BaTiO3 nanoparticles in aqueous suspensions, J. Exp. Nanosci., 2011, 6(2), 127–137 CrossRef CAS.
- U. Paik, Influence of Solids Concentration on the Isoelectric Point of Aqueous Barim Titanate, J. Am. Ceram. Soc., 2000, 83(10), 2381–2384 CrossRef CAS.
- H. E. Bergna and I. Burn, Ceramic Dielectric Compositions of and Method for Improving Sinterability, US Pat.5001804, 1991 Search PubMed.
- P. Gheradrdi and E. Matijevic, Homogeneous Precipitation of Spherical Colloidal Barium Titanate Particles, Colloids Surf., 1998, 32, 257–274 CrossRef.
- U. Paik, B. A. Hackley, S. C. Choi and Y. G. Jung, The effect of electrostatic repulsive forces on the stability of BaTiO3 particles suspended in non-aqueous media, Colloids Surf., A, 1998, 135, 77–88 CrossRef CAS.
- Y. K. Leong, Interparticle forces arising from an adsorbed strong polyelectrolyte in colloidal dispersions: charged patch attraction, Colloid Polym. Sci., 1999, 277, 299–305 CrossRef CAS.
- S. Dey, P. Bhattacharya, S. Bandyopadhyay, S. N. Roy, S. Majumdar and G. C. Sahoo, Single Step Preparation of Zirconia Ultrafiltration Membrane over Clay-Alumina Based Multichannel Ceramic Support for Waste Treatment, J. Membr. Sci. Res., 2018, 4, 28–33 CAS.
- M. Eibl, S. Virtanen, F. Pischel, F. Bok, S. Lonnrot, S. Shaw and N. Huittinen, A spectroscopic study of trivalent cation (Cm3+ and Eu3+) sorption on monoclinic zirconia (ZrO2), Appl. Surf. Sci., 2019, 487, 1316–1328 CrossRef CAS.
- M. Panalytical and C. Slips, The Importance of Particle Size Analysis and Zeta Potential, AZoNano, https://www.azonano.com/article.aspx?ArticleID=1097, 2024 Search PubMed.
- Y. K. Leong, P. J. Scales, T. W. Healy and D. V. Boger, Rheological Evidence of Adsorbate-mediated Short-range Steric Forces in Concentrated Dispersions, J. Chem. Soc., Faraday Trans., 1993, 89(4), 2473–2478 RSC.
- S. Biggs and T. W. Healy, Electrosteric Stabilization of Colloidal Zirconia with Low-molecular-weight Polyacrylic Acid, J. Chem. Soc., Faraday Trans., 1994, 99(22), 3415–3421 RSC.
- J. N. Ryan, M. Elimelech, J. L. Baseseman and R. D. Magelky, Silica-Coated Titania and Zirconia Colloids for Subsurface Transport Field Experiments, Environ. Sci. Technol., 2000, 34, 2000–2005 CrossRef CAS.
- A. Dering, Catalyst Preparation Uptake of Gold onto Different Supports, Project Report, Laboratory for Product and Process Design, University of Illinois at Chicago, 2004 Search PubMed.
- K. A. Gnann, Predicting Zeta Potential Ad Adsorption Behavior in the Al2O3-SiO2-TiO2-ZrO2-Surfactant System, Masters thesis, Alfred University, 2004.
- K. D. Hristovski, P. K. Westerhoff, J. C. Crittenden and L. W. Olson, Environ. Sci. Technol., 2008, 42, 3786–3790 CrossRef CAS PubMed.
- P. J. B. Marcos, R. H. R. Castro and C. D. Gouvea, Study of zirconia and magnesia suspensions in ethanol, Ceramica, 2001, 47(304), 187–192 CrossRef CAS.
- J. Wang, L. Gao, J. Sun and A. Li, Surface Characterization of NH4PAA-Stabilized Zirconia Suspensions, J. Colloid Interface Sci., 1999, 213, 552–556 CrossRef CAS PubMed.
- M. Leffler, Chemistry Dept. University of Connecticut, Unpublished Results, 2004.
- M. M. Ramos-Tejada, A. Ontiveros, J. L. Viota and J. D. G. Duran, Interfacial and rheological properties of humic acid/hematite suspensions, J. Colloid Interface Sci., 2003, 268, 85–95 CrossRef CAS PubMed.
- B. H. Jeon, B. A. Dempsey, W. D. Burgos, R. A. Royer and E. E. Roden, Modeling the sorption kinetics of divalent metal ions to hematite, Water Res., 2004, 8, 2499–2504 CrossRef PubMed.
- P. Reiller, V. Moulin, F. Casanova and C. Dautel, Retention behavior of humic substances onto mineral surfaces and consequences upon thorium (IV) mobility: case of iron oxides, Appl. Geochem., 2002, 17(12), 1551–1562 CrossRef CAS.
- R. C. Plaza, J. D. G. Duran, A. Quirantes, M. J. Ariza and A. V. Delgado, J. Colloid Interface Sci., 1997, 194, 398–407 CrossRef CAS PubMed.
- Y. Arai, D. L. Sparks and J. A. Davis, Effects of Dissolved Carbonate on Arsenate Adsorption and Surface Speciation at the Hematite-Water Interface, Environ. Sci. Technol., 2004, 38, 817–824 CrossRef CAS PubMed.
- J. J. Lenhart and B. D. Honeyman, Reactions at the Solid/Solution Interface Fe-Oxides and Hydroxides, Geochim. Cosmochim. Acta, 1999, 63(19/20), 2891–2901 CrossRef CAS.
- D. A. Lytle, J. M. Payne and T. J. Song, Adsorption Media for Arsenic Removal, U. S. Environmental Protection Agency, ORD, NRMRL, WSWRD, TTEB, Cincinnati, Ohio 45268, 2004 Search PubMed.
- E. Tombacz, A. Libor, E. Illes, A. Majzik and E. Klumpp, The role of reactive surface sites and complexation by humic acids in the interaction of clay mineral and iron oxide particles, Org. Geochem., 2004, 35, 257–267 CrossRef CAS.
- C. Y. Xu, K. Y. Deng, J. Y. Li and R. K. Xu, Impact of environmental conditions on aggregation kinetics of hematite and goethite nanoparticles, J. Nanopart. Res., 2015, 7, 394–407 CrossRef.
- S. Pivovarov, Adsorption of Cadmium onto Hematite: Temperature Dependence, J. Colloid Interface Sci., 2001, 234, 1–8 CrossRef CAS PubMed.
- T. Fengqiu, H. Xiaoxian, Z. Yufeng and G. Jingkun, Effect of dispersants on surface chemical properties of nano-zirconia suspensions, Ceram. Int., 2000, 26, 93–97 CrossRef.
- M. J. Kim, T. Y. Yang, Y. B. Lee and H. C. Park, Dispersion stability of Y-TZP/Ce-TZP powder system and slip casting, J. Mater. Sci., 2002, 37, 1661–1665 CrossRef CAS.
- M. T. Weng, W. C. Wei and C. Y. Huang, Influence of 3Y-TZP on Microstructure and Mechanical Properties of Al2O3-based Composites, Key Eng. Mater., 2007, 353–358, 1540–1543 CAS.
- A. Bleier and O. O. Omatete, Rheology and Microstructure of Concentrated Zirconia-Alumina Suspensions for Gelcasting Composites, Oak Ridge National Laboratory, P. O. Box 2008, Oak Ridge, TN. 37831, 1992 Search PubMed.
- J. W. Wei-Cheng, S. C. Wang and F. Y. Ho, Electrokinetic Properties of Colloidal Zirconia Powders in Aqueous Suspension, J. Am. Ceram. Soc., 1999, 32(12), 3385–3392 Search PubMed.
- A. J. Sanchez-Herencia, C. Pascual, J. He and F. F. Lange, ZrO2/ZrO2 Layered Composites for Crack Bifurcation, J. Am. Ceram. Soc., 1999, 82(6), 1512–1518 CrossRef CAS.
- Q. Tan, Z. Tang, A. Zhang, W. Yao and K. Fang, Optimization of the rheological properties of nanometer sized tetragonal polycrystal zirconia slurries for aqueous-gel-tape-casting processing, Mater. Sci. Eng. B, 2003, 99, 374–377 CrossRef.
- C. C. Chen, H. I. Hsiang and S. W. Hsu, Preparation and Characterization of Y-TZP powders coated with alumina, J. Ceram. Process. Res., 2008, 9(2), 131–134 Search PubMed.
- J. Wang, L. Gao and J. Sun, Interface Adsorption of Y-TZP Aqueous Suspensions, J. Inorg. Mater., 1999, 14(5), 754–762 Search PubMed.
- B. Ferrari and R. Moreno, Zirconia Thick Films Deposited on Nickel by Aqueous Electrophoretic Deposition, J. Electrochem. Soc., 2000, 147(8), 2987–2992 CrossRef CAS.
- Y. M. Kong, S. Kim and H. E. Kim, Reinforcement of Hydroxyapatite Bioceramic by Addition of ZrO2 Coated with Al2O3, J. Am. Ceram. Soc., 1999, 82(11), 2963–2968 CrossRef CAS.
- C. Pagnoux, Suspension systems for coagulation processing, J. Ceram. Process. Res., 2002, 3(1), 10–14 Search PubMed.
- F. Shojai, A. Pettersson, T. A. Mantyla and J. B. Rosenholm, Detection of carbon residue on the surface of 3Y-ZrO2 powder and its effect on the rheology of the slip, Ceram. Int., 2000, 26, 133–139 CrossRef CAS.
- F. Shojai, A. B. A. Pettersson, T. Mantyla and J. B. Rosenholm, Electrostatic and electrostatic stabilization of aqueous slips of 3Y–ZrO2 powder, J. Eur. Ceram. Soc., 2000, 20, 277–283 CrossRef CAS.
- R. D. Shannon, Revised effective ionic radii and systematic studies of inter-atomic distances in halides and chalcogenides, Acta Crystallogr. A, 1976, 32, 751–767 CrossRef.
- H. Lin, C. P. Huang, W. Li, C. Ni, S. Ismat Shah and Y. H. Tseng, Size dependency of nanocrystalline TiO2 on its optical property and photocatalytic reactivity exemplified by 2-chlorophenol, Appl. Catal., B, 2006, 68, 1–11 CrossRef CAS.
- US Research Nanomaterials, Inc. us-nano.com, 3302 Twig Leaf Lane, Houston, TX 77084, USA. Phone: (Sales) +832-359-7887; Fax: +281-492-8628.
- SkySpring Nanomaterials, Inc. 2935 Westhollow Drive, Houston, TX, 77082, USA Phone: +281-870-1700, Fax: +281-870-8002, Email: E-mail: sales@ssnano.com, 2020.
- T. Van Gestel, C. Vandecasteele, A. Buekenhoudt, C. Dotremont, J. Luyten and B. Van der Brugger, Corrosion properties of alumina and titania NF membranes, J. Membr. Sci., 2003, 214(1), 21–29 CrossRef CAS.
- HMC Harmony Chemical, Resources, Titanium Dioxide Chemical Properties, https://www.ti-line.net/resources/titanium-dioxide-properties/titanium-dioxide-chemical-properties.html, 2024.
- M. Scimeca, S. Bischetti, H. K. Lamisra, R. Bonfiglio and E. Bonanno, Energy Dispersive X-Ray (EDX), microanalysis: A powerful tool in biomedical research and diagnosis, Eur. J. Histochem., 2018, 62, 2841–2851 Search PubMed.
- https://www.rigaku.com/applications/bytes/xrd/ultima-iv/1864928622, 2024.
- T. Mahmood, M. T. Saddiue, A. Naeem, P. Westerhoff, S. Mustafa and A. Alum, Comparison of Different Methods for the Point of Zero Charge Determination of NiO, Ind. Eng. Chem. Res., 2011, 50(17), 10017–10023 CrossRef CAS.
- R. Le Clercq and D. Beelen, Analysis Report: ReportY0LFP098UV_Rev00.Docx, Bandgap Measurements on Nanoscale Anatase Titanium Oxide Powders (Cc Ok 6/23) Eurofins Materials Science Netherlands B.V, 2020 Search PubMed.
- International Center for Diffraction Data, 12 Campus Blvd., Newtown Square, PZ 19073, USA. JCPDS file #00-0634-0863.
- C. E. Hughes, G. N. Manjunatha Reddy, S. Masiero, S. P. Brown, P. A. Wiliams and K. D. M. Harris, Determination of a complex crystal structure in the absence of single crystals: analysis of powder X-ray diffraction data, guided by solid-state NMR and periodic DFT calculations, reveals a new 20-deoxyguanosine structural motif, Chem. Sci., 2017, 8, 3971–3979 RSC.
- A. Alexzevalkink, https://wordpress.com/wpcontent/uploads/2017/04/me133652.pdfSmartLab, Guidance Reference Model, Rigaku Corporation Search PubMed.
- J. E. Samad, S. Hashim, S. Ma and J. R. Regalbuto, Determining surface composition of mixed oxides with pH, J. Colloid Interface Sci., 2014, 436, 204–210 CrossRef CAS PubMed.
- E. J. Teh, Y. K. Leong and V. S. J. Craig, Surface Forces and Rheology of Titanium Dioxide in the Presence of Dicarboxylic Acids: From Molecular Interactions to Yield Stress, Langmuir, 2017, 33(6), 1496–1506 CrossRef CAS PubMed.
- F. Amano, T. Yasumoto, O. O. P. Mahaney, S. Uchida, T. Shibayama, Y. Terada and B. Ohtani, Highly Active Titania Photocatalyst Particles of Controlled Crystal Phase, Size and Polyhedral Shapes, Top. Catal., 2010, 53, 455–461 CrossRef CAS.
- K. H. Ko, Y. C. Lee and Y. J. Jung, Enhanced efficiency of dye-sensitized TiO2 solar cells (DSSC) by doping of metal ions, J. Colloid Interface Sci., 2005, 283, 482–487 CrossRef CAS PubMed.
- E. M. B. Samsudin, Improved Titanium Dioxide Promoted Photocatalyst for Degradation on Pollutant in Water, PhD thesis, Institute of Graduate Studies, University of Malaya, Kualalumpur, 2016 Search PubMed.
- J. W. Lee, M. R. Othman, Y. Eom, T. G. Lee, W. S. Kim and J. Kim, The effects of thermally treated SiO2/TiO2 sperhical core-shell particles for photo-catalysis of methyl orange, Microporous Mesoporous Mater., 2008, 116, 561–568 CrossRef CAS.
- G. Jegadeesan, S. R. Al-Abed, V. Sundaram, H. Choi, K. G. Scheckel and D. D. Dionysious, Arsenic sorption of TiO2 nanoparticles: Size and crystallinity effects, Water Res., 2010, 44, 965–973 CrossRef CAS PubMed.
- N. Mandzy, E. Grulke and T. Druffel, Breakage of TiO2 agglomerates in electrostatically stabilized aqueous dispersion, Powder Technol., 2005, 160, 121–126 CrossRef CAS.
- M. Zeng, Influence of TiO2 Surface Properties on Water Pollution Treatment and Photocatalytic Activity, Bull. Korean Chem. Soc., 2013, 34(3), 953–956 CrossRef CAS.
- J. Jukic, T. Juracic and T. Begovic, Effects of polyion adsorption on surface properties of TiO2, Adsorption, 2024, 30, 251–264 CrossRef CAS.
- A. Tarafdar, R. Raliya, W. N. Wang, P. Biswas and J. C. Tarafdar, Green Synthesis of TiO2 Nanoparticle Using Aspergillus tubingensis, Adv. Sci., Eng. Med., 2013, 5, 1–7 CrossRef.
- M. Leffler, Chemistry Dept, University of Connecticut, Unpublished Results, 2004.
- C. S. Lim, Synthesis and characterization of TiO2-ZnO nanocomposite by a two-step chemical method, J. Ceram. Process. Res., 2010, 11(5), 631–635 Search PubMed.
- H. Lin, C. P. Huang, W. Li, C. Ni, S. Ismat Shah and Y. H. Tseng, Size dependency of nanocrystalline TiO2 on its optical property and photocatalytic reactivity exemplified by 2-chlorophenol, Appl. Catal., B, 2006, 68, 1–11 CrossRef CAS.
- K. P. O'Donnell and X. Chen, Temperature Dependence of Semiconductor Band Gap, Appl. Phys. Lett., 1991, 58(25), 2924–2926 CrossRef.
- W. Wei, S. Hong-Lie, J. Jia-Le, L. Jin-Ze and M. Yue, Effect of thermal pretreatment of metal precursor on the properties of Cu2ZnSnS4 films, Chin. Phys. B, 2015, 24(5), 1–5 Search PubMed.
- S. Dai, Y. Wu, T. Sakai, Z. Du, H. Sakai and M. Abe, Preparation of Highly Crystalline TiO2Nanostructures by Acid-assisted Hydrothermal Treatment of Hexagonal-structured Nanocrystalline Titania/Cetyltrimethyammonium Bromide Nanoskeleton, Nanoscale Res. Lett., 2010, 5(11), 1829–1835 CrossRef CAS PubMed.
- V. Stengl, V. Houskova, S. Bakardijeva and N. Murafa, Photocatalytic Activity of Boron-Modified Titania under UV and Visible-Light Illumination, ACS Appl. Mater. Interfaces, 2010, 2(2), 575–580 CrossRef CAS PubMed.
- H. Long, G. Yang, A. Chen, Y. Li and P. Lu, Femtosecond Z-scan measurement of third-order optical nonlinearities in anatase TiO2 thin films, Opt. Commun., 2009, 282, 1815–1818 CrossRef CAS.
- L. Kernazhitsky, V. Shymanovska, T. Gavrilko, V. Naumov, V. Kshnyakin and J. Ukr, Optical absorption of polydisperse TiO2: Effect of surface doping by transition metal cations, Phys. Opt., 2012, 14(1), 15–23 CrossRef PubMed.
- K. M. Reddy, S. V. Manorama and A. R. Reddy, Bandgap Studies on Anatase Titanium DiOxide Nanoparticles, Mater. Chem. Phys., 2002, 78, 239–245 CrossRef.
- N. Serpone, D. Lawless and R. J. Khairutdinov, Size Effects on the Photophysical Properties of Colloidal Anatase TiO2 Particles: Size Quantization of Direct Transitions in This Indirect Semiconductor, Phys. Chem., 1995, 99, 16646–16654 CrossRef CAS.
- L. Bedikyan, S. Zakhariev and M. Zakhariev, Titanium Dioxide Thin Films: Preparation and Optical Properties, J. Chem. Technol. Metall., 2013, 48(6), 555–558 CAS.
- I. Bal, M. C. Baykul and U. Sarac, The Effect of Solution Temperature on Chemically Manufactured CdS Samples, Chalcogenide Lett., 2021, 18, 1–10 CrossRef CAS.
- M. Szekeres and E. Tombacz, Surface charge characterization of metal oxides by potentiometric titration, revisited theory and experiment, Colloids Surf., A, 2012, 414, 302–313 CrossRef CAS.
- M. Tuckerman, E. Vitz, J. W. Moore, J. Shorb, X. Prat-Resina, T. Wendorff, A. Hahn, R. J. Lancashire and Contributors, Electronegativity and Dipole Moment, Physical Chemistry For The Biosciences, 2020, https://chem.libretexts.org/@go/page/41382 Search PubMed.
- H. J. Lee, A. C. Jamison and T. R. Lee, Surface Dipoles: A Growing Body of Evidence Supports Their impact and Importance, Acc. Chem. Res., 2015, 48, 3007–3015 CrossRef CAS PubMed.
- W. Yan, S. Li, Y. Zhang and Q. Yao, Effects of Dipole Moments and Temperature on the Interaction Dynamics of Titania Nanoparticles during Agglomeration, J. Phys. Chem. C, 2010, 114, 10755–10760 CrossRef CAS.
- C. Q. Sun, L. Li, B. K. Tay and H. Huang, An extended ‘quantum confinement’ theory: Surface-coordination imperfection modifies the entire band structure of a nanosolid, J. Phys. D: Appl. Phys., 2001, 34, 3470–3479 CrossRef CAS.
- L. Pauling, The Nature of the Chemical Bond, Cornell University Press, Ithaca New York, 3rd edn, 1960 Search PubMed.
- B. R. J. Bosco and B. G. Jeyaprakash, Melting points, mechanical properties of nanoparticles and Hall Petch relationship for nanostructured materials, NPTEL, pp. 1–18 Search PubMed.
- F. Font and T. G. Myers, Spherically symmetric nanoparticle melting with a variable phase change temperature, J. Nanopart. Res., 2013, 15, 2086–2099 CrossRef.
- W. Hu, S. Xiao, H. Deng, W. Luo and L. Deng, Thermodynamic properties of nano-silver and alloy particles, Department of Applied Physics, Hunan University, Changsha 410082, PR China, 2010, pp. 1–34.
- M. Jones, Ignition and Combustion Characteristics of Nanoscale Metal and Metal Oxide Additives in Biofuel (Ethanol) and Hydrocarbons, Ms thesis, The University of Toledo, 2011.
- Y. D. Qu, X. L. Liang, X. Q. Kong and W. J. Zhang, Size-dependent cohesive Energy, Melting Temperature, and Debye Temperature of Spherical metallic Nanoparticles, Phys. Met. Metallogr., 2017, 118(6), 528–534 CrossRef CAS.
- G. V. Gibbs, F. C. Hill, M. B. Boisen and R. T. Downs, Power law relationships between bond length, bond strength and electron density distributions, Phys. Chem. Miner., 1998, 25, 585–590 CrossRef CAS.
- D. T. Livey and P. Murray, Surface Energies of Solid Oxides and Carbides, J. Am. Ceram. Soc., 1956, 39(11), 363–372 CrossRef.
- P. M. Oliver, G. W. Watson, E. T. Kelsey and S. C. Parker, Atomistic simulation of the surface structure of the TiO2 polymorphs rutile and anatase, J. Mater. Chem., 1997, 7(3), 563–568 RSC.
- F. W. Sears, M. W. Zemansky and H. D. Young, University Physics, Fifth Edition, Addison-Wesley Publishing Company, Inc. Reading, Massachusetts, Menlo Park, California, London, Amsterdam, Don Mills, Ontario, Sydney, 1980.
- B. Smith, NOAH, 212 Rogers Ave, Milford, CT 06460, Personal Communication, 2016.
- M. Sunjuk, H. Arar, W. F. Mahmoud, M. Majdalawi, M. M. Krishan, Y. A. Salha and B. El-Eswed, Adsorption of cationic and anionic organic dyes of SiO2/CuO composite, Desalin. Water Treat., 2019, 169, 383–394 CrossRef CAS.
- W. N. Zhao and Z. P. Liu, Mechanism and active site of photocatalytic water splitting on titania in aqueous surroundings, Chem. Sci., 2014, 5, 2256–2264 RSC.
- B. Wei and M. Calatayud, Hydrogen activation on Anatase TiO2: Effect of surface termination, Catal. Today, 2022, 397–399, 113–120 CrossRef CAS.
- H. Eidsvag, S. Bentouba, P. Vajeeston, S. Yohi and V. Velauthapillai, TiO2 as a Photocatalyst for Water Splitting—An Experimental and Theoretical Review, Molecules, 2021, 26, 1687–1717 CrossRef PubMed.
- M. A. Brown, Z. Abbas, A. Kleibert, R. G. Green, A. Goel, S. May and T. M. Squires, Determination of Surface Potential and Electrical Double-Layer Structure at the Aqueous Electrolyte-Nanoparticle Interface, Phys. Rev. X, 2016, 6, 011007 Search PubMed.
| This journal is © The Royal Society of Chemistry 2024 |

