 Open Access Article
Visible light assisted photooxidative facile degradation of azo dyes in water using a green method†
Muhammad Yousifa,
Ahmad H. Ibrahim d,
Sawsan S. Al-Rawi
 e,
Adnan Majeed
 a,
Muhammad Adnan Iqbal
 *ab,
Muhammad Kashifc,
Zain Ul Abidina,
Muhammad Arbaza,
Shahzaib Alia,
Syed Arslan Hussaina,
Anam Shahzadia and
Mohammad Tauseef Haidera
aDepartment of Chemistry, University of Agriculture Faisalabad, Faisalabad-38000, Pakistan. E-mail: adnan.iqbal@uaf.edu.pk
bSynthetic Organometallic and Coordination Chemistry Laboratory, University of Agriculture Faisalabad, Faisalabad-38000, Pakistan
cDepartment of Mathematics and Statistics, University of Agriculture Faisalabad, Faisalabad-38000, Pakistan
dPharmacy Department, Faculty of Pharmacy, Tishk International University, 100 m St, Near Baz Intersection, Erbil, KRG, Iraq
eBiology Education Department, Faculty of Education, Tishk International University, 100 m St, Near Baz Intersection, Erbil, KRG, Iraq
First published on 20th May 2024
Abstract
In this study, the methyl orange (MO) dye has been degraded after screening several azo dyes due to its effective results and being toxic and carcinogenic to aquatic life and humans. An environmentally friendly, economical, and green method for water purification was used in this study using the photooxidative method. Several organic acids were screened for oxidative applications against various azo dyes but due to better results, methyl orange was selected for the whole study. Ascorbic acid, also known as vitamin C, was found to be best for photodegradation due to its high oxidative activity among various organic acids utilized. A newly developed photoreactor box has been used to conduct the photooxidation process. To evaluate the degradation efficiency of AsA, photooxidative activity was monitored periodically. When the dose of AsA was used at a contact time of 180 minutes, degradation efficiency was 96%. The analysis of degraded products was performed using HPLC and GC-MS. The nucleophilicity of HOMO–LUMO and MEPs was confirmed using density functional theory. For the optimization of the process, central composite design (CCD) in Response Surface Methodology (RSM) was utilized.
1 Introduction
In recent decades, the rapid growth in the textile manufacturing industry has resulted in severe water pollution.1 Extensive discharges of liquids from textile industries containing dyes, heavy metals, chlorine, and formaldehyde are the major sources of water pollution.2 Water is a great asset used for drinking, washing, and irrigation purposes. Chemicals like synthetic dyes are constantly introduced into natural water resources due to the lack of effective wastewater treatment.3,4 The textile industry uses dyes as coloring agents, and dye that is lost in manufacturing and distribution causes environmental problems such as serious health issues for humans and aquatic life.5,6 Approximately 10% of dyestuffs used in textile dyeing are released into the environment due to inadequate binding to fibers.7 Methyl Orange (MO), Methylene Blue (MB), Methyl Yellow (MY), Methyl Red (MR), Malachite Green (MG), and Congo Red (CR) are some familiar azo dyes used in the textile industry.8In this study, MO was selected for the degradation process owing to its environmental toxicity and effective degradation by Ascorbic Acid (AsA). It is also known as a sodium 4-[(4-dimethylamino) phenylazo] benzenesulfonate,9 it is one of the highest-consumed materials in the dye industry and is utilized as a dyeing agent for fabric, textiles, and in the leather industry.5,10 It is also used in printing,5 paper-making,11 pharmaceuticals,12 food-processing,5 and research lab industries.13 Due to its toxicity and carcinogenic effects, removal is necessary for water purity and environmental protection.14 As mentioned above, for these reasons, this dye was preferred for degradation in this study. Over the past years, different physical and chemical methods such as filtration,15 adsorption,16–18 coagulation,19 co-precipitation,20 and electrolysis21 have been used for the degradation of MO present in wastewater. Different metal-based nanoparticles, such as ZnO, TiO, Fe3O4, and NiO, were synthesized, along with their composites like GO/ZnO, MXene/NiO, and Activated-Carbon (AC)/TiO2, for the degradation of MO.22–24 Since nanoparticles are expensive to synthesize, these methods are limited in many ways, including low versatility, high cost, low efficiency, interference with other wastewater components, and secondary harmful emissions that require further processing, including poisonous fumes and sludge.14,25 In recent years, there has been a growing interest in advanced oxidation technologies for obtaining high yields of oxidation from organic compounds.26 The degradation of dyes in which use of small organic compounds may be used for degradation in the presence of light is known as organo-photooxidation.27 It has attracted the attention of scientists and gained considerable relevance due to its unique and fascinating qualities. The development of asymmetric organo-catalysis was honored with the 2021 Nobel Prize in Chemistry.28,29 As a result of its ability to remove residual dyes from effluents, this photooxidation system has become more and more popular among researchers to tackle issues related to the environment.30 Organo-photooxidation is an effective technique for the development of sustainable and efficient chemical transformations.31 Organo-photooxidation may minimize the use of hazardous reagents or solvents and reduce the generation of harmful byproducts during the degradation process.32 Organo-photo oxidative agents are usually feasible, inexpensive, eco-friendly, and may show high degradation efficiency.33
Several organic acids were evaluated as photocatalysts, including oxalic acid (OA), tartaric acid (TA), AsA (C6H8O6) also known as vitamin C, maleic acid (MA) and citric acid (CIA). However, AsA demonstrated the most effective degradation efficiency for the MO dye, making it the preferred choice for the entire study. It is a weak organic acid that has been used as an organo-photooxidative agent for the degradation of MO dye. AsA contains acidic hydroxyl groups34 which act as an electron donor compound and are highly soluble in water.35 Its chemical structure is shown in Fig. 1. Apart from these properties, AsA is non-toxic, feasible, eco-friendly, and cost-effective.36 Although several catalysts have been used in the past to break down MO, organo-photooxidation is perhaps the most efficient and eco-friendly technique. The utilization of organic molecules as oxidative agents, excluding inorganic elements, has emerged as a rapidly advancing area of chemical research. Implementing the organo-photooxidative approach for dye degradation not only enhances efficiency and sustainability but also diminishes the environmental impact of synthetic dyes.31 This method holds greater attention compared to other techniques due to its cost-effectiveness, utilization of renewable energy, and elimination of inorganic catalysts. The novelty of this study lies in the accessibility of acid catalysts, eliminating the need for preparation and saving time during the degradation process. In Response Surface Methodology (RSM), Central Composite Design (RSM-CCD) matrix has been applied to evaluate the photodegradation of MO using AsA in the presence of light. It also helps to recognize the most influential parameters and the effects of interactions between the parameters.37 Various characterization techniques such as HPLC, GC-MS, and FTIR analysis, have also been performed before and after the degradation process for the evaluation of final product identification. The DFT study has been done to determine the Molecular Electrostatic Potential (MEPs) and HOMO–LUMO structures to find their values and the chemical reactivity evaluation.
 | ||
| Fig. 1 Illustrates the schematic diagram of the solution preparation and organo-photooxidative activity. | ||
2 Materials and methods
MO was obtained from Sigma-Aldrich, and AsA, MA, and CIA were taken from the Chemical store of the University of Agriculture, Faisalabad-Pakistan. It should be noted that all of the chemicals were of analytical grade and were not further purified before use. All dye solutions were prepared using double-distilled water. A photoreactor box was developed for photodegradation activity.2.1 Photoreactor box
A Photoreactor box was established to enhance the photodegradation process by utilizing the tungsten bulb light to drive chemical reactions. This photoreactor box comprises a box with an inner wall coated with aluminum foil, a 100 W tungsten bulb was deployed as the light source from the upper side of the box for equal distribution of light to all test tubes, and a wire that connects it to a power source. The aluminum foil reflects light onto the reaction mixture, maximizing the utilization of light energy and enhancing the efficiency of photoreaction. To maintain the increasing temperature aeration and a small hole was used. This box has dimensions 13 × 12 × 14 inches. This system also allowed for real-time reaction progress monitoring by using a mirror. This photoreactor box is cost-effective, eco-friendly, and an efficient solution to explore and optimize a wide range of photo-induced reactions as shown in Fig. S1 (ESI File).†2.2 Sample preparation
Solutions with various concentrations such as 500, 700, and 900 ppm of MO were prepared using double-distilled water in measuring flasks. The prepared solutions were stirred at 1000 rpm for 5 minutes to ensure complete dissolution of MO in distilled water. Then, 10 mL of MO solution for each concentration was measured and placed in a separate test tube. Photooxidative agent AsA in various doses was weighed on a balance such as 0.005, 0.010, and 0.015 g, respectively. These doses of photooxidative agent were added to the respective test tubes containing the MO solutions. For further analysis, samples were prepared at higher concentrations to obtain powdered samples that resulted from dye degradation. For drying of the sample rotary evaporator was utilized for the evaporation of solvent to dry the degraded sample. Specifically, samples for FT-IR and GC-MS analyses were prepared at a concentration of 5000 ppm, while a concentrated solution containing 1000 ppm of the MO dye was prepared for HPLC analysis. Fig. 1 shows the schematic representation of solution preparation and organo-photooxidative activity.2.3 Experimental protocol
When all the solutions of MO dye were prepared, treated with each concentration of AsA in a separate test tube. After the addition of the AsA, visible light analyses were taken for the evaluation of photodegradation. Subsequently, the test tubes were introduced into a photoreactor system where a tungsten filament bulb of 100 W was used to initiate the photodegradation activity. The bulb was turned ON 10 minutes before the sample was placed in a photoreactor box to ensure steady light emission. Test tubes were placed five inches below the bulb. Samples of MO dye were collected at intervals of 60, 120, and 180 minutes, respectively. The absorbance of MO dye at each time interval was measured using a UV-visible spectrophotometer.This experimental setup was repeated three times for each concentration to ensure consistency and reliability of the results. The degradation efficiency was determined by eqn (1).
 | (1) |
The optimal conditions for this study were 900 ppm MO concentration and the dose of photooxidative compound 0.015 g at a contact time of 180 minutes.
2.4 Statistical methodology
Response surface methodology (RSM) is a statistical and mathematical technique commonly employed in experimental design to optimize complex systems. It is particularly useful when dealing with the response of a system changes with varying levels of input factors.38,39 The main objective of RSM is to develop an empirical model, often in the form of a mathematical equation, which approximates the relationship between the response variable (also known as the dependent variable) and the independent variables (factors). The CCD model was used for appropriate results. By fitting the model to experimental data, RSM allows researchers to analyze and optimize the system efficiently.40 A total of 108 values were run. Three levels were defined for dye concentration and catalyst dose, while four levels were defined for time. These values were designed by the −1, 0, and +1 codes. Table 1 shows the range of these factors.| Factor | Name | Units | Minimum | Maximum | Coded low | Coded high |
|---|---|---|---|---|---|---|
| A | Concentration of dye | ppm | 500.00 | 900.00 | −1 ↔ 500.00 | +1 ↔ 900.00 |
| B | Dose of photooxidative compound | g | 0.0050 | 0.0150 | −1 ↔ 0.005 | +1 ↔ 0.015 |
| C | Time | minute | 0.0000 | 180.00 | −1 ↔ 0.00 | +1 ↔ 180.00 |
The general form of the quadratic model is shown as follows in eqn (2).
 | (2) |
| % (η) = 47.30 + (4.58)X1 + (2.45)X2 + (34.15)X3 (−2.90)X1X2 + (3.26)X1X3 + (0.743)X2X3 + (4.96)X12 + (0.30)X22 + (−10.0)X32 | (3) |
It appears that the predicted R2 of 0.92 and the adjusted R2 of 0.93 are reasonably consistent. In other words, there is less than 0.2 difference between the two. According to. The signal-to-noise ratio is used to measure precision. It is desirable to have a ratio greater than 4. You have an adequate signal with a ratio of 41.36. The design space can be navigated using this model.
2.5 Computational study
The computational calculation based on density functional theory (DFT) was conducted with the Gaussian 09 program package. The B3LYP method with 6-31G (d, p) basis set level was used for geometry optimization of MO molecular structure. The optimized structures were calculated from log files and the HOMO–LUMO values from CHK files.423 Results and discussion
3.1 UV-visible analysis
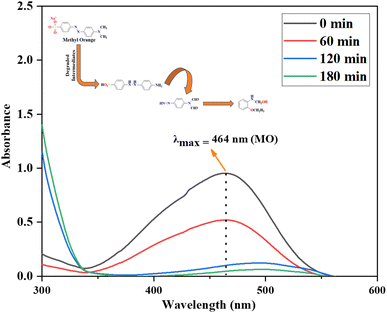
The MO dye's photooxidation experiments were conducted within the photooxidative system as previously discussed. For UV analysis, the solutions were placed in 2 mL cuvettes and analyzed using a double-beam spectrophotometer model BMS-1100 against a blank dye solution. The photooxidation activity was assessed under the UV-visible spectrophotometer at its lambda max value of 464 nm43 shown in Fig. 2. The time was recorded as soon as the samples were positioned within the photo redox system. After the addition of AsA into the MO solution under visible light, photodegradation of MO started and the photodegradation process was evaluated every 60 minutes. The MO color change and absorption value decrease as time passes, due to the presence of chromophore resulting the breakdown of N![[double bond, length as m-dash]](https://www.rsc.org/images/entities/char_e001.gif) N,31 indicating the photodegradation process. After 180 minutes, the peak intensity close to zero indicated that MO fully degraded into its fragments. The results showed 96% MO photodegradation efficiency using AsA as an organo-photooxidative agent. However in case of Methylene blue degradation AsA showed 95% efficiency.31
N,31 indicating the photodegradation process. After 180 minutes, the peak intensity close to zero indicated that MO fully degraded into its fragments. The results showed 96% MO photodegradation efficiency using AsA as an organo-photooxidative agent. However in case of Methylene blue degradation AsA showed 95% efficiency.31
3.2 Statistical analysis
| Source | Sum of squares | Df | Mean square | F-value | p-value | |
|---|---|---|---|---|---|---|
| Model | 75![[thin space (1/6-em)]](https://www.rsc.org/images/entities/char_2009.gif) 528.90 528.90 |
9 | 8392.10 | 164.97 | <0.0001 | Significant |
| A-Concentration of dye | 1511.68 | 1 | 1511.68 | 29.72 | <0.0001 | |
| B-Dose of photooxidative compound | 434.73 | 1 | 434.73 | 8.55 | 0.0043 | |
| C-Time | 70![[thin space (1/6-em)]](https://www.rsc.org/images/entities/char_2009.gif) 001.58 001.58 |
1 | 70![[thin space (1/6-em)]](https://www.rsc.org/images/entities/char_2009.gif) 001.58 001.58 |
1376.09 | <0.0001 | |
| AB | 404.84 | 1 | 404.84 | 7.96 | 0.0058 | |
| AC | 425.43 | 1 | 425.43 | 8.36 | 0.0047 | |
| BC | 22.09 | 1 | 22.09 | 0.4343 | 0.5114 | |
| A2 | 592.66 | 1 | 592.66 | 11.65 | 0.0009 | |
| B2 | 2.20 | 1 | 2.20 | 0.0433 | 0.8355 | |
| C2 | 2133.69 | 1 | 2133.69 | 41.94 | <0.0001 | |
| Residual | 4985.25 | 98 | 50.87 | |||
| Cor total | 80![[thin space (1/6-em)]](https://www.rsc.org/images/entities/char_2009.gif) 514.15 514.15 |
107 |
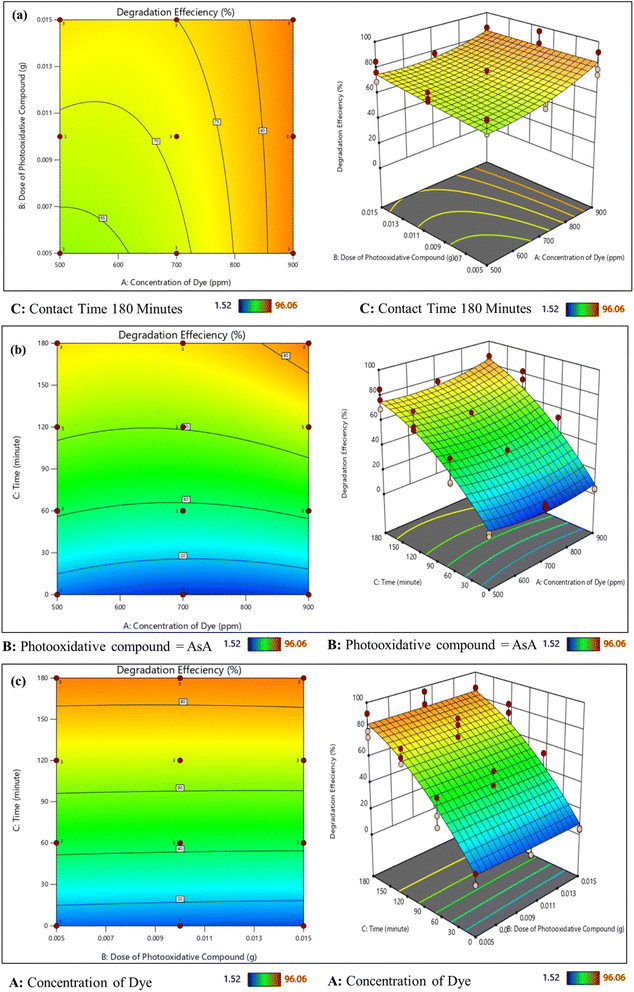
Fig. 3a shows the effect of the concentration of dye and dose of the photooxidative compound on dye degradation by AsA at a contact time of 180 minutes. It was observed that increasing the concentration of the dose of photooxidative compound efficiency of dye degradation increased such as when the dye concentration of dye was 900 ppm and the dose of AsA 0.005 g resulted in percentage photodegradation noticeable to 92% which was the highest efficiency by increasing the dose of photooxidative compound more active sites creation for the photodegradation of dye.41
Fig. 3b shows the combined effect of dye concentration and contact time when the dose of AsA was 0.015 the degradation efficiency was improved when the concentration of dye was highest and the contact time of 180 min which is the maximum. But as the dose of AsA was constant efficiency increased from 39% to 83%. But when the AsA dosage exceeds the limit turbidity of the solution rises which reduces light penetration.44
Fig. 3c shows the effect of the dose of photooxidative compound and time at a constant concentration of dye. When the reaction started the photodegradation efficiency was less as shown in Fig. 3c but after increasing the irradiation time to 180 min better response was achieved in the range of 0.05–0.01 g, at shorter irradiation time stable intermediates formed that may resist further degradation but by increasing the dosage of AsA concerning irradiation time more radicals formed which attack MO molecules or intermediates that further degrade to smaller fragments and the efficiency increased from 56 to 96%.45
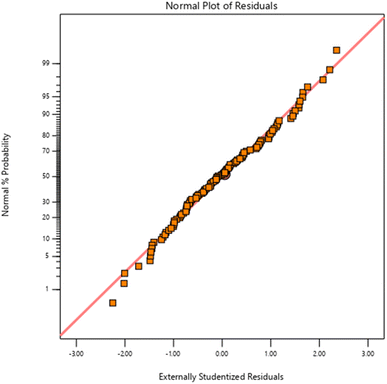
An illustration of residuals versus normal probability for MO photodegradation is shown in Fig. 4. The detailed plot shows a linear relationship between the obtained data and residuals, which indicates that the residuals are distributed normally. This implies that the quadratic model developed for parameterizing MO degradation is satisfactory for predicting the experimental results.
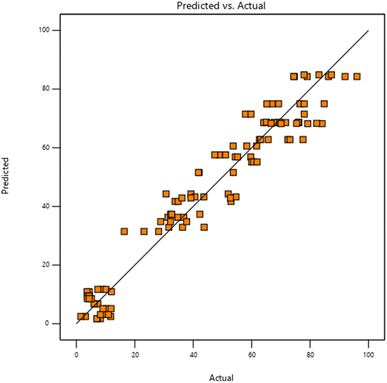
According to Fig. 5, MO photodegrades by organo-photooxidation as a result of the experimental and projected values. The present model of dye degradation well fits the experimental data, and both experimental and predicted values were higher than expected. In the investigational range of variables, the model was able to calculate dye degradation.
3.3 FT-IR analysis
FTIR spectra were taken for the confirmation of functional groups by thermo scientific FT-IR spectrometer (spectrum 100) in the range of 4000 to 650 cm−1. An attenuated total reflection (ATR) attachment with a microgermanium (Ge) crystal was used. Samples were mixed with spectroscopically pure KBr in a ratio of 5![[thin space (1/6-em)]](https://www.rsc.org/images/entities/char_2009.gif) :
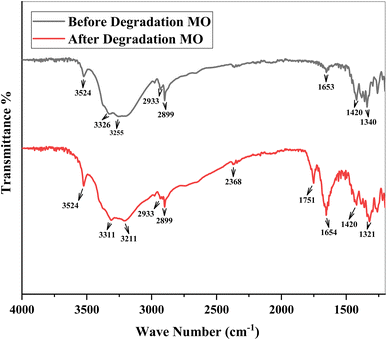
:![[thin space (1/6-em)]](https://www.rsc.org/images/entities/char_2009.gif) 95, pellets were fixed in sample holders, and analyses were conducted.46 IR spectra of MO were obtained before and after photodegradation shown in Fig. 6. Spectra observed various peaks at 3524, 3326, 3255, 2933, 2899, 1653, and 1420 cm−1 before degradation of MO dye. The spectra having broad peaks at 3524 cm−1, 3326 cm−1, and 3255 cm−1 between (3600cm−1–3200 cm−1) region indicates the O–H stretching vibrations due to hydrogen bonding and water molecules.47–50 The absorption peaks at 2933 cm−1 present in both before and after the degradation of MO due to the C–H stretching51 and there is no shift at 2899 cm−1 was assigned to aliphatic C–H stretching vibration in before and after the degradation of MO.52 An absorption peak observed at 1653 cm−1 before degradation which is not present after degradation indicates the amino group (N–H).53 An absorption peak was observed before degradation at 1420 cm−1 and absent after degradation due to C–C aromatic skeleton vibrations.54 The absorption peak at 1340 cm−1 was observed before degradation and after degradation peak was observed at 1321 cm−1 so the wavenumber decreased indicating that the blue shift occurred due to a stretching vibrational band of C–N functionality.55 After degradation there were various peaks observed in degraded samples at 3524, 3311, 3211, 2899, 2368, 1751, 1716, 1654, 1321cm−1shown in Fig. 6. The absorption bands after degradation obtained the same in the range of 3200–3600 cm−1 as before degradation but there is a little bit of difference such as intense peaks were observed in degraded samples as compared to non-degraded sample, and the blue shift occurred from (3326 cm−1 to 3311 cm−1) and (3255 cm−1 to 3211 cm−1). These absorption bands were observed due to a broad characteristic O–H bonding of hydrogen bonding and interlinked water molecules.56 A new absorption band appeared in the region (2300–2400 cm−1) may be due to CO2 trapped from air.57,58 The absorption band at 1751 cm−1 was observed, which is a more intense, and blue shift that occurred from 1653 to 1751 cm−1 in degraded sample due to C
95, pellets were fixed in sample holders, and analyses were conducted.46 IR spectra of MO were obtained before and after photodegradation shown in Fig. 6. Spectra observed various peaks at 3524, 3326, 3255, 2933, 2899, 1653, and 1420 cm−1 before degradation of MO dye. The spectra having broad peaks at 3524 cm−1, 3326 cm−1, and 3255 cm−1 between (3600cm−1–3200 cm−1) region indicates the O–H stretching vibrations due to hydrogen bonding and water molecules.47–50 The absorption peaks at 2933 cm−1 present in both before and after the degradation of MO due to the C–H stretching51 and there is no shift at 2899 cm−1 was assigned to aliphatic C–H stretching vibration in before and after the degradation of MO.52 An absorption peak observed at 1653 cm−1 before degradation which is not present after degradation indicates the amino group (N–H).53 An absorption peak was observed before degradation at 1420 cm−1 and absent after degradation due to C–C aromatic skeleton vibrations.54 The absorption peak at 1340 cm−1 was observed before degradation and after degradation peak was observed at 1321 cm−1 so the wavenumber decreased indicating that the blue shift occurred due to a stretching vibrational band of C–N functionality.55 After degradation there were various peaks observed in degraded samples at 3524, 3311, 3211, 2899, 2368, 1751, 1716, 1654, 1321cm−1shown in Fig. 6. The absorption bands after degradation obtained the same in the range of 3200–3600 cm−1 as before degradation but there is a little bit of difference such as intense peaks were observed in degraded samples as compared to non-degraded sample, and the blue shift occurred from (3326 cm−1 to 3311 cm−1) and (3255 cm−1 to 3211 cm−1). These absorption bands were observed due to a broad characteristic O–H bonding of hydrogen bonding and interlinked water molecules.56 A new absorption band appeared in the region (2300–2400 cm−1) may be due to CO2 trapped from air.57,58 The absorption band at 1751 cm−1 was observed, which is a more intense, and blue shift that occurred from 1653 to 1751 cm−1 in degraded sample due to C![[double bond, length as m-dash]](https://www.rsc.org/images/entities/char_e001.gif) O stretching.59 A highly intense peak observed after degradation at 1654 cm−1 was identified as amide.60 The absorption peak observed at 1321 cm−1 and the wavenumber shifted from 1340–1321 cm−1 shows a red shift due to the asymmetric and symmetric stretching vibration of the sulfone groups.61
O stretching.59 A highly intense peak observed after degradation at 1654 cm−1 was identified as amide.60 The absorption peak observed at 1321 cm−1 and the wavenumber shifted from 1340–1321 cm−1 shows a red shift due to the asymmetric and symmetric stretching vibration of the sulfone groups.61
3.4 HPLC analysis
The HPLC chromatogram of 1000 ppm MO reference dye and photodegraded MO dye at 100 W of light for 3 h, was observed at 464 nm as shown in Fig. 7. Peak A, shown at 3 minutes, represents the MO before degradation. After irradiation for 180 minutes, a peak was observed at 244 nm with a retention time of 2 minutes. The general observation can be made that degradation is a consequence of a transformation of the molecular structure of the dye chromophore.62 This retention time is shorter than that of the reference dye solution indicating the photodegradation of MO into its smaller fragments. These chromatographic variations support the organo-photooxidative degradation of MO into aromatic amines such as the 4-(2-(4-aminophenyl)hydrazineyl)benzenesulfonic acid, the peak observed at 244 nm in the HPLC chromatogram63 as shown in Fig. 7. The GC-MS analysis conducted to identify the degradation products of MO revealed several peaks on the gas chromatograph resulting below.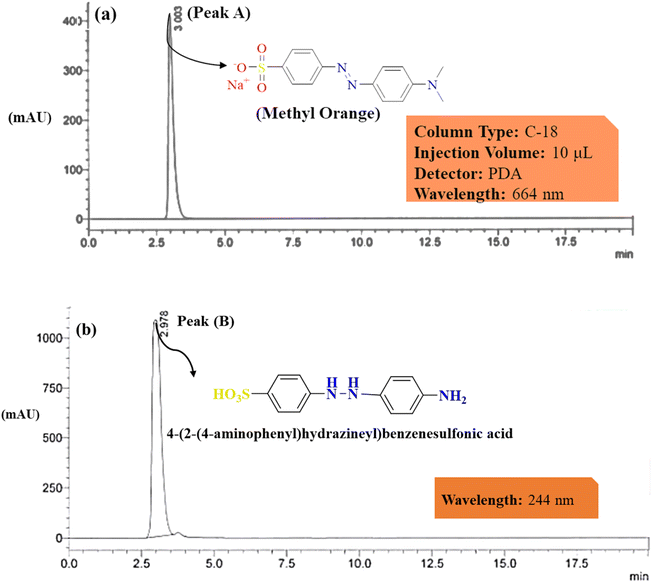 | ||
| Fig. 7 Illustrates the HPLC spectra of (a) MO before and (b) after photodegradation showing by products peaks. | ||
3.5 GC-MS analysis
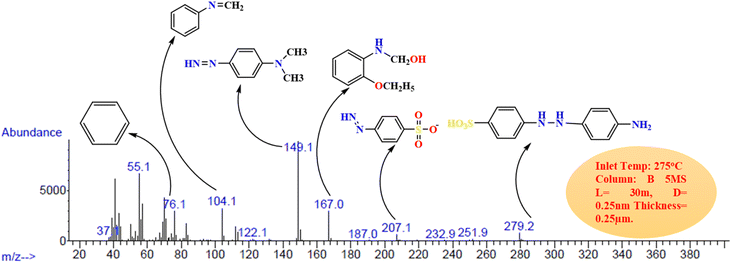
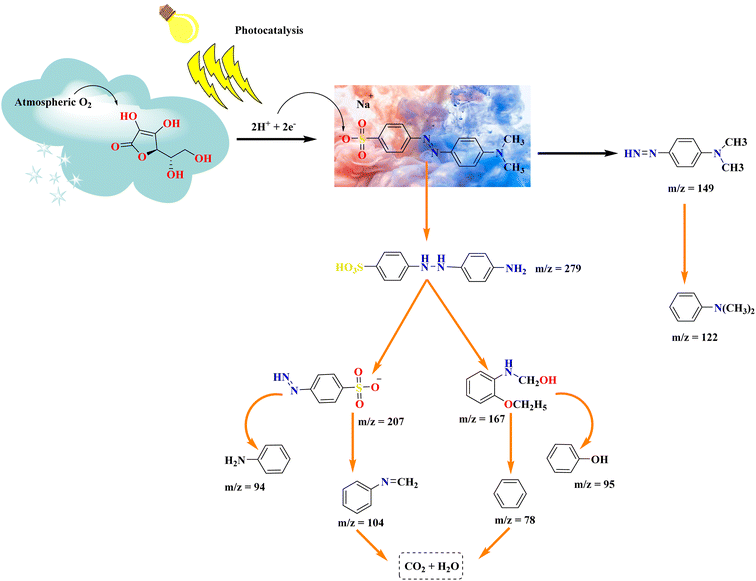
GC-MS is a useful tool for detecting organic volatile molecules in a mixture.64 To detect photodegradation intermediates and identify a degradation pathway for MO, GC-Mass analysis was performed45 using GC-7890A and MS-5977A spectrometry (Agilent, USA) model. Following the photodegradation process, the GC chromatogram of MO solutions is shown in Fig. 8, which confirms the degradation of MO molecules to smaller fragments. Different degraded products were determined at the 18.12 min of elution time. A mechanism for the degradation of MO molecules in the applied conditions was proposed based on the m/z values of the resulting intermediates as shown in Fig. 9. In this AsA first oxidized due to atmospheric oxygen as it is good reducing agent, so it attacked the nucleophilic portion of MO. Electrons were transferred from AsA to MO. Which lead to the formation of 4-(2-(4-aminophenyl)hydrazineyl)benzenesulfonic acid (m/z = 279) a crucial intermediate in MO degradation activity.63 It was further elucidated by following intermediates formation such as 4-diazenyl-N, N-dimethylaniline, N,N-dimethylaniline with m/z = 149, 122 respectively occurred asymmetric cleavage due to lower bond energy of –C–N– (305 kJ mol−1) than N![[double bond, length as m-dash]](https://www.rsc.org/images/entities/char_e001.gif) N (418 kJ mol−1) and this intermediate was detected.65 The fragmentation pattern of degraded product with m/z 279 shows at m/z 207 and by loss of phosphate group further degrade to give m/z 104.66 During the photodegradation of the dye molecule, the photogenerated holes and hydroxyl radicals exhibit a preference for attacking the chromophore center. This leads to cleavage of the amino group, saturation of hydrogen radicals.67 The C–N bonds between the aromatic ring are easily broken, implying that during the photodegradation process, resulted in ring-opening and formation of short linear aliphatic carboxylic acids, inorganic ions, CO2, and H2O.66 A summary of the main intermediates is shown in Table 3, based on the mass spectral m/z values.
N (418 kJ mol−1) and this intermediate was detected.65 The fragmentation pattern of degraded product with m/z 279 shows at m/z 207 and by loss of phosphate group further degrade to give m/z 104.66 During the photodegradation of the dye molecule, the photogenerated holes and hydroxyl radicals exhibit a preference for attacking the chromophore center. This leads to cleavage of the amino group, saturation of hydrogen radicals.67 The C–N bonds between the aromatic ring are easily broken, implying that during the photodegradation process, resulted in ring-opening and formation of short linear aliphatic carboxylic acids, inorganic ions, CO2, and H2O.66 A summary of the main intermediates is shown in Table 3, based on the mass spectral m/z values.
3.6 Computational details
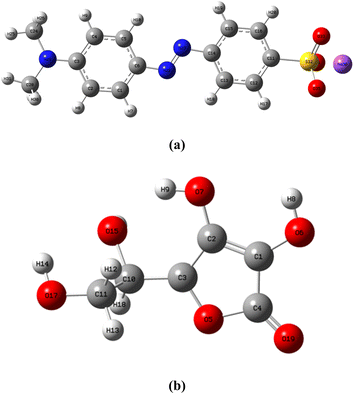
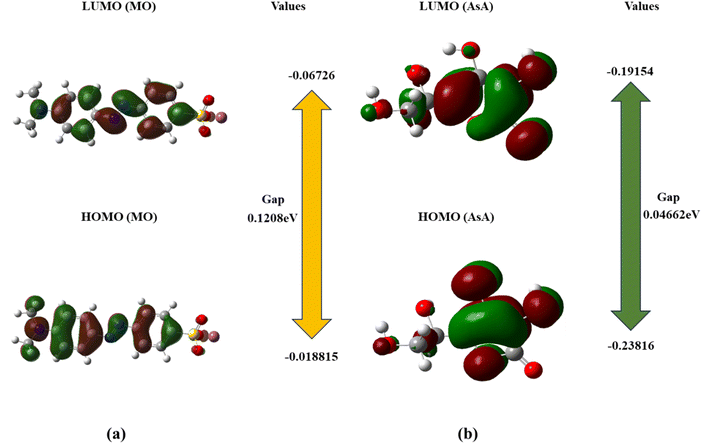
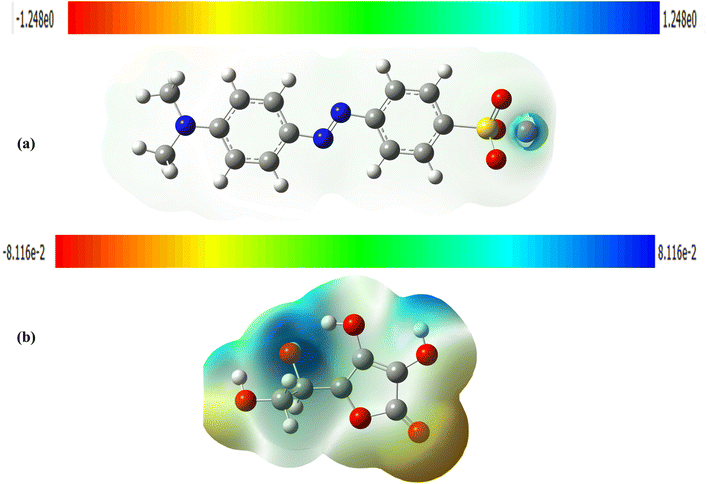
The DFT study provides support to the proposed mechanism of MO degradation. For supporting the GCMS The optimized geometric structures and atoms labels of MO and AsA are shown in Fig. 10. The HOMO–LUMO bandgap energy and the MEPs were calculated using a B3LYP/631 G (d,p) level basis set.39,68| Compounds | EHOMO (eV) | ELUMO (eV) | μ (eV) |
|---|---|---|---|
| MO | −0.18815 | −0.06726 | −0.12089 |
| AsA | −0.23816 | −0.19154 | −0.04662 |
4 Conclusion
This research focused on eliminating the toxic particles present in water using green photooxidative compounds under visible light. In this study photooxidation potential of AsA for the photodegradation of azo dye (MO) was assessed as having higher oxidation efficiency than all other organic acids such as OA, CIA, TA, etc. Additionally, this method is useful for the photodegradation of various azo dyes such as methylene blue, reactive red, reactive blue, and eriochrome black-T for water purification. However, residual AsA may persist in the water post-degradation, which is generally deemed safe for consumption and may not present health risks. It seems that AsA offers a more cost-effective and eco-friendly alternative compared to nanoparticles, H2O2, and NaBH4. Additionally, AsA exhibits enhanced photodegradation capabilities, crucial for addressing chemically stable synthetic dyes that conventional treatments struggle to degrade without incurring high costs. As the photooxidative agent concentration increases, so does energy consumption. Therefore, photooxidation proves to be a more efficient and promising approach compared to other physical and chemical methods. The response surface methodology and CCD modeling were used to evaluate the individual effects of three independent parameters: concentration of the dye, dose of photooxidative compounds, and time on degradation efficiency. The maximum photodegradation efficiency was 96% under the following optimal conditions: photooxidative compound dosage = 0.015, contact time = 180 min, and concentration of MO = 900 ppm which is more than from methylene blue degradation by Majeed et al.31 The degraded product obtained from MO was 4-(2-(4-aminophenyl) hydrazineyl) benzenesulfonic acid confirmed by HPLC and GCMS analysis. The DFT study was done to support the results of various techniques such as GCMS and HPLC in the degradation mechanism. The primary objective of this research was not only to degrade the MO dye but also to demonstrate, through practical wastewater treatment applications, that a suitable photooxidative system can effectively eliminate dye contaminants from wastewater.Author contributions
Muhammad Yousif: writing – original draft. Ahmad H. Ibrahim: resources. Sawsan S. Al-Rawi: validation. Adnan Majeed: software, writing – review & editing. Muhammad Adnan Iqbal: conceptualization, resources, supervision. Muhammad Kashif: data curation, visualization. Zain Ul Abidin: formal analysis. Muhammad Arbaz: data curation. Shahzaib Ali: validation. Syed Arslan Hussain: visualization. Anam Shahzadi: review and editing. Mohammad Tauseef Haider: formal analysis.Conflicts of interest
The authors declare no conflict of interest.Acknowledgements
The authors are thankful to the Pakistan Science Foundation (PSF) for awarding the research grant PSF/CRP/Consr-676.References
- N. Kumar, U. Jung, B. Jung, J. Park and M. Naushad, Environ. Pollut., 2023, 316, 120353 CrossRef CAS PubMed.
- N. Bi, H. Zheng, Y. Zhu, W. Jiang and B. Liang, J. Environ. Chem. Eng., 2018, 6, 3150–3160 CrossRef CAS.
- R. H. Waghchaure, V. A. Adole and B. S. Jagdale, Inorg. Chem. Commun., 2022, 143, 109764 CrossRef CAS.
- M. Ge, Chin. J. Catal., 2014, 35, 1410–1417 CrossRef CAS.
- M. F. Hanafi and N. Sapawe, Mater. Today: Proc., 2020, 31, A141–A150 Search PubMed.
- M. Abdellah, S. Nosier, A. El-Shazly and A. Mubarak, Alexandria Eng. J., 2018, 57, 3727–3735 CrossRef.
- K. Singh, P. Kumar and R. Srivastava, Pollut. Res., 2017, 36, 790–797 Search PubMed.
- O. Moradi, A. Pudineh and S. Sedaghat, Food Chem. Toxicol., 2022, 169, 113412 CrossRef CAS PubMed.
- S. Schlichter, A. S. Diez, M. C. Zenobi, M. Dennehy and M. Alvarez, Clean: Soil, Air, Water, 2016, 44, 1652–1660 CAS.
- R. Kumar, G. Kumar and A. Umar, Mater. Lett., 2013, 97, 100–103 CrossRef CAS.
- A. C. Lacuesta, M. U. Herrera, R. Manalo and M. D. L. Balela, Surf. Coat. Technol., 2018, 350, 971–976 CrossRef CAS.
- E. O. Fagbohun, Q. Wang, L. Spessato, Y. Zheng, W. Li, A. G. Olatoye and Y. Cui, Surf. Interfaces, 2022, 29, 101696 CrossRef CAS.
- A. Debnath, K. Deb, K. K. Chattopadhyay and B. Saha, Desalin. Water Treat., 2016, 57, 13549–13560 CrossRef CAS.
- L. Bai, S. Wang, Z. Wang, E. Hong, Y. Wang, C. Xia and B. Wang, Environ. Pollut., 2019, 248, 516–525 CrossRef CAS PubMed.
- M. K. Uddin and U. Baig, J. Cleaner Prod., 2019, 211, 1141–1153 CrossRef CAS.
- X. Liu, Z. Chen, W. Du, P. Liu, L. Zhang and F. Shi, J. Environ. Manage., 2022, 311, 114775 CrossRef CAS PubMed.
- J. P. Guin, Y. Bhardwaj and L. Varshney, Appl. Radiat. Isot., 2017, 122, 153–157 CrossRef PubMed.
- N. Mohammadi, H. Khani, V. K. Gupta, E. Amereh and S. Agarwal, J. Colloid Interface Sci., 2011, 362, 457–462 CrossRef CAS PubMed.
- Y. Liu, Y. Xiang, H. Xu and H. Li, Sep. Purif. Technol., 2022, 282, 120152 CrossRef CAS.
- H. Jiang, H. Dai, X. Meng, L. Zhang, J. Deng and K. Ji, Chin. J. Catal., 2011, 32, 939–949 CrossRef CAS.
- P. Li, Z. Liu, X. Wang, Y. Guo and L. Wang, Chemosphere, 2017, 180, 100–107 CrossRef CAS PubMed.
- B. Regraguy, M. Rahmani, J. Mabrouki, F. Drhimer, I. Ellouzi, C. Mahmou, A. Dahchour, M. E. Mrabet and S. E. Hajjaji, Nanotechnol. Environ. Eng., 2022, 7, 157–171 CrossRef CAS.
- J. Kaur and S. Singhal, Ceram. Int., 2014, 40, 7417–7424 CrossRef CAS.
- A. A. Barzinjy, S. M. Hamad, S. Aydın, M. H. Ahmed and F. H. Hussain, J. Mater. Sci.: Mater. Electron., 2020, 31, 11303–11316 CrossRef CAS.
- S. Shilpa and R. Shikha, Int. Res. J. Environ. Sci., 2015, 4, 44–53 CAS.
- N. Daneshvar, A. Aleboyeh and A. R. Khataee, Chemosphere, 2005, 59, 761–767 CrossRef CAS PubMed.
- K. Nagai, Y. Yasuda, T. Iyoda and T. Abe, ACS Sustain. Chem. Eng., 2013, 1, 1033–1039 CrossRef CAS.
- I. Hargittai, Struct. Chem., 2022, 33, 303–305 CrossRef CAS.
- A. J. Burke, Expert Opin. Drug Discovery, 2023, 18, 37–46 CrossRef CAS PubMed.
- J. Rashid, S. Saleem, S. U. Awan, A. Iqbal, R. Kumar, M. Barakat, M. Arshad, M. Zaheer, M. Rafique and M. Awad, RSC Adv., 2018, 8, 11935–11945 RSC.
- A. Majeed, A. H. Ibrahim, S. S. Al-Rawi, M. A. Iqbal, M. Kashif, M. Yousif, Z. U. Abidin, S. Ali, M. Arbaz and S. A. Hussain, ACS Omega, 2024, 9, 12069–12083 CrossRef CAS PubMed.
- A. Vega-Peñaloza, J. Mateos, X. Companyó, M. Escudero-Casao and L. Dell'Amico, Angew. Chem., Int. Ed., 2021, 60, 1082–1097 CrossRef PubMed.
- M. Umar and H. A. Aziz, Organic Pollutants-Monitoring, Risk and Treatment, 2013, vol. 8, pp. 196–197 Search PubMed.
- R. A. Jutkus, N. Li, L. S. Taylor and L. J. Mauer, Int. J. Food Prop., 2015, 18, 862–879 CrossRef CAS.
- S. J. Padayatty, A. Katz, Y. Wang, P. Eck, O. Kwon, J.-H. Lee, S. Chen, C. Corpe, A. Dutta and S. K. Dutta, J. Am. Coll. Nutr., 2003, 22, 18–35 CrossRef CAS PubMed.
- S. K. Das, P. Bhattacharjee and U. Bora, ChemistrySelect, 2018, 3, 2131–2134 CrossRef CAS.
- B. S. Kaith, U. Shanker, B. Gupta and J. K. Bhatia, React. Funct. Polym., 2018, 131, 107–122 CrossRef.
- A. Aleboyeh, N. Daneshvar and M. Kasiri, Chem. Eng. Process., 2008, 47, 827–832 CrossRef CAS.
- Z. U. Abidin, A. Majeed, M. A. Iqbal, M. Kashif, T. Fatima, M. Yousif, M. Arbaz, S. A. Hussain and M. Sajid, Clean Technol. Environ. Policy, 2024, 1–15, DOI:10.1007/s10098-024-02842-x.
- E. Ghiasi and A. Malekzadeh, J. Inorg. Organomet. Polym. Mater., 2020, 30, 2789–2804 CrossRef CAS.
- K. Salehi, H. Daraei, P. Teymouri and A. Maleki, J. Adv. Environ. Health Res., 2014, 2, 101–109 Search PubMed.
- L. Zhang, C. Xiao, Z. Li, J. Guo, G. Du, X. Cheng and Y. Jia, Appl. Surf. Sci., 2023, 618, 156595 CrossRef CAS.
- G. Khade, M. Suwarnkar, N. Gavade and K. Garadkar, J. Mater. Sci.: Mater. Electron., 2016, 27, 6425–6432 CrossRef CAS.
- K. M. Reza, A. Kurny and F. Gulshan, Appl. Water Sci., 2017, 7, 1569–1578 CrossRef CAS.
- S. Ghattavi and A. Nezamzadeh-Ejhieh, Int. J. Hydrogen Energy, 2020, 45, 24636–24656 CrossRef CAS.
- G. K. Parshetti, A. A. Telke, D. C. Kalyani and S. P. Govindwar, J. Hazard. Mater., 2010, 176, 503–509 CrossRef CAS PubMed.
- F. Ling, L. Fang, Y. Lu, J. Gao, F. Wu, M. Zhou and B. Hu, Microporous Mesoporous Mater., 2016, 234, 230–238 CrossRef CAS.
- Q. Zhao, X. Zhu and B. Chen, Chem. Eng. J., 2018, 334, 1119–1127 CrossRef CAS.
- A. El Amri, L. Kadiri, R. Hsissou, A. Lebkiri, Z. Wardighi, E. H. Rifi and A. Lebkiri, J. Mol. Struct., 2023, 1272, 134098 CrossRef CAS.
- Y. Cao, J. Zhang, J. Li, P. Zhou and B. Liu, Russ. J. Phys. Chem. A, 2022, 96, 2992–2999 CrossRef CAS.
- P. Kriplani, K. Guarve and U. S. Baghael, Chin. Herb. Med., 2021, 13, 274–285 Search PubMed.
- R. Lafi, L. Abdellaoui, I. Montasser and A. Hafiane, Int. J. Environ. Anal. Chem., 2022, 102, 8124–8140 CrossRef CAS.
- A. H. Jawad, N. H. Mamat, B. Hameed and K. Ismail, J. Environ. Chem. Eng., 2019, 7, 102965 CrossRef CAS.
- Z. Zhu, M. Xiang, P. Li, L. Shan and P. Zhang, J. Solid State Chem., 2020, 288, 121448 CrossRef CAS.
- Q. M. Al-Bataineh, A. D. Telfah, A. A. Ahmad, A. A. Bani-Salameh, R. Abu-Zurayk and R. Hergenröder, J. Appl. Polym. Sci., 2022, 139, e53138 CrossRef CAS.
- M. Zhang, Y. Niu and Y. Xu, J. Colloid Interface Sci., 2020, 579, 269–281 CrossRef CAS PubMed.
- Y. L. Pang and A. Z. Abdullah, Ultrason. Sonochem., 2012, 19, 642–651 CrossRef CAS PubMed.
- A. Zaghloul, R. Benhiti, A. Soudani, M. Chiban, M. Zerbet and F. Sinan, Mediterr. J. Chem., 2019, 9, 155–163 CrossRef CAS.
- I. Gautam, T. Grady and H. Fernando, Green Chem. Lett. Rev., 2023, 16, 2174818 CrossRef.
- I. A. Radini, N. Hasan, M. A. Malik and Z. Khan, J. Photochem. Photobiol., B, 2018, 183, 154–163 CrossRef CAS PubMed.
- F. Lian, M. Zheng, M. Chen, Y. Zhu, L. Zhang and B. Zheng, Int. J. Biol. Macromol., 2020, 165, 2442–2450 CrossRef CAS PubMed.
- D. C. Kalyani, A. A. Telke, S. P. Govindwar and J. P. Jadhav, Water Environ. Res., 2009, 81, 298–307 CrossRef CAS PubMed.
- D. R. Eddy, D. Nursyamsiah, M. D. Permana, Solihudin, A. R. Noviyanti and I. Rahayu, Materials, 2022, 15, 332 CrossRef CAS PubMed.
- M. Ghiaci, R. Kalbasi and H. Aghaei, Catal. Commun., 2007, 8, 1843–1850 CrossRef CAS.
- N. Gupta and B. Pal, J. Mol. Catal. A: Chem., 2014, 391, 158–167 CrossRef CAS.
- P. Kaur and D. Sud, J. Mol. Catal. A: Chem., 2012, 365, 32–38 CrossRef CAS.
- K. Barick, P. Sharma, A. Mukhija, J. Sainis, A. Gupta and P. Hassan, J. Environ. Chem. Eng., 2015, 3, 1346–1355 CrossRef CAS.
- Amanullah, U. Ali, M. Ans, J. Iqbal, M. A. Iqbal and M. Shoaib, J. Mol. Model., 2019, 25, 223 CrossRef CAS PubMed.
- Ghiasuddin, M. Akram, M. Adeel, M. Khalid, M. N. Tahir, M. U. Khan, M. A. Asghar, M. A. Ullah and M. Iqbal, J. Mol. Struct., 2018, 1160, 129–141 CrossRef CAS.
- M. Muhammad Asif Iqbal, M. Yasir Mehboob, R. Hussain, M. Adnan and Z. Irshad, Comput. Theor. Chem., 2021, 1202, 113335 CrossRef CAS.
- R. Hussain, F. Hassan, M. U. Khan, M. Y. Mehboob, R. Fatima, M. Khalid, K. Mahmood, C. J. Tariq and M. N. Akhtar, Opt. Quantum Electron., 2020, 52, 1–20 CrossRef.
Footnote |
| † Electronic supplementary information (ESI) available. See DOI: https://doi.org/10.1039/d4ra01202j |
| This journal is © The Royal Society of Chemistry 2024 |

