 Open Access Article
Tribological behaviors of an attapulgite–graphene nanocomposite as an additive for mineral lubricating oil
Dong Wanga,
Xianfeng Zengbcd and
Feng Nan *bcd
*bcd
aCollege of Mechanical Engineering, Zhijiang College of Zhejiang University of Technology, Shaoxing 312030, China
bHubei Provincial Key Laboratory of Chemical Equipment Intensification and Intrinsic Safety, School of Mechanical and Electrical Engineering, Wuhan Institute of Technology, Wuhan 430205, China. E-mail: nanfeng2005@126.com
cHubei Provincial Engineering Technology Research Center of Green Chemical Equipment, School of Mechanical and Electrical Engineering, Wuhan Institute of Technology, Wuhan 430205, China
dSchool of Mechanical and Electrical Engineering, Wuhan Institute of Technology, Wuhan 430205, China
First published on 21st May 2024
Abstract
In this work, an attapulgite–graphene nanocomposite was prepared. The tribological properties of the prepared attapulgite–graphene nanocomposite as an additive for 200SN mineral lubricating oil were investigated using an SRV-IV tribometer through ball-on-disk contact mode for the first time. The characterization of the prepared nanocomposite indicated that attapulgite nanofibers are enveloped by the graphene nanosheets and present fine combination. The tribological test results show that the friction-reducing and antiwear properties of 200SN were obviously improved by adding the attapulgite–graphene nanocomposite. Through the characterization and analysis of the worn surface and cross-section, it was found that a tribofilm composed of Fe, Fe3O4, FeO, Fe2O3, FeOOH, graphite, graphene, SiO2 and organic compounds was formed on the worn surface. Furthermore, the bonding between the tribofilm and steel matrix is tight. The tribofilm and lubricating oil achieve a solid–liquid coupling lubrication effect, which is responsible for the improvement of the friction-reducing and antiwear properties.
1. Introduction
Lubricating oil is widely used in mechanical components to reduce friction and wear. However, due to the limited bearing capacity of the lubricating oil film, the lubrication effect of lubricating oil is not ideal. In recent years, it has been found that various types of nanomaterials such as metals, metal oxides, metal sulfides, metal borates and carbon nanomaterials can improve the tribological properties of lubricating oil.1–7 Owing to the small size and excellent physiochemical properties, nanomaterials can remarkably improve the tribological properties of lubricating oil. Different nanomaterials have different characteristics, thus improving the lubricity of lubricating oil through different methods.In recent years, it has been discovered that a silicate material, attapulgite, can achieve friction reducing and anti-wear function when used as lubricant additives. It is found that the addition of a small amount of attapulgite can remarkably improve the friction reducing and antiwear properties of 150SN mineral lubricating oil for a steel–steel friction pair, especially under high load and low frequency.8 Yu et al.9 systematically investigated the effects of the load, frequency, duration and concentration on the tribological properties of the attapulgite additive by an SRV reciprocating wear tester. Both research results indicated that a tribolayer mainly composed of oxides, ceramics and silicates was generated on the steel rubbing surface lubricated with the oil-added attapulgite additive. In addition, the friction reducing and antiwear properties of attapulgite can be further improved by combining with metal and rare earth oxide nanoparticles.10,11 Besides the steel–steel friction pair, the attapulgite additive can also obviously improve the friction-reducing and antiwear properties of the 150SN lubricating oil on the electric-brush plated Ni coating. The formation of the tribofilm mainly consisting of Ni, NiO, SiO2, Al2O3, graphite, and organic compounds was responsible for the reduction of friction and wear.12 Attapulgite is a natural nanomaterial with abundant mineral resources and is environmentally friendly. Accordingly, it has great application prospects in the field of tribology.
Graphene, as a type of two-dimensional material that is tightly packed together by carbon atoms through sp2 hybrid connection, exhibits excellent optical, electrical, and mechanical properties, which make it highly attractive in materials science, micro/nano processing, energy, biomedical, and drug delivery. Graphene has also received widespread attention in tribology. There are a lot of reports concerning pristine graphene and reduced graphene oxide as lubrication additives.13–16 It was found that the tribological behaviors of several kinds of lubricating oil and greases can be improved with graphene as additives. In addition, in order to regulate the frictional and wear-resistant behaviors of graphene, many reports have had graphene functionalized and then systematically investigated their tribological behaviors.17–19 Researchers also combined graphene and other nanomaterials as lubricating additives for further improvement of the tribological behaviors. Graphene can achieve better lubrication and wear-resistance performance when combined with these nanoparticles as additives for oil-based or water-based lubricants.20–22
In the previous work, we prepared grease by using PAO40 as a base oil and attapulgite as a thickener, and systematically investigated the tribological performances of the attapulgite grease-added graphene additive. The results show that the addition of graphene in moderation can improve the friction-reducing and antiwear properties of the attapulgite base grease.23 However, due to the poor fluidity of the lubricating grease and simple mixing of attapulgite and graphene, the graphene exhibited poor dispersion in the lubricating grease, thus causing the strengthening effect of graphene to not be fully utilized. Moreover, the improvement mechanism of graphene has not been thoroughly revealed.
Therefore, in the present work, the attapulgite–graphene nanocomposite was synthesized, and the tribological behaviors of the prepared attapulgite–graphene nanocomposite as an additive for mineral oil were investigated for the first time. The worn surface and cross-section were characterized to analyze the microstructure, composition and chemical states of the formed tribofilm. Moreover, the friction-reducing and antiwear mechanisms of the attapulgite–graphene nanocomposite were discussed on the basis of the above experimental results and analysis.
2. Experimental details
2.1. Materials
The attapulgite powder (ATP) used in the work was purchased from Xuyi, Jiangsu Province of China. Impurities such as quartz, feldspar, authigenic opal and dolomite were removed by the supplier through refining treatments. Graphene oxide (GO) was obtained from Jiangsu Xianfeng Nanometer Material Science and Technology Co., Ltd, of China. Oleic acid and N2H4·H2O were purchased from Sinopharm Chemical Reagent Co., Ltd, of China.The ATP–G nanocomposite was prepared using a procedure described previously.24 The preparation process is shown in Fig. 1. The ATP was firstly vacuum heated at 100 °C for 4 h to improve its activity and adsorption capacity. Subsequently, the desired amounts of ATP and GO were dissolved in 200 ml deionized water and uniformly mixed to prepare ATP–GO nanocomposites with different proportions. The ATP–GO nanocomposite was reduced with N2H4·H2O in a 90 °C water bath for 2 h to obtain a homogeneous black dispersion. The dispersion was filtered and then vacuum-dried at 60 °C for 24 h. Finally, the nanocomposite was successfully prepared. There are numerous hydroxyl groups on the attapulgite and graphene nanoparticle surfaces; thus, hydrogen bonds can form between them. In addition, the heat-treated attapulgite possesses excellent adsorption performance to adsorb graphene. Moreover, graphene (G) was also prepared through the reduction of GO by N2H4·H2O.
Fig. 2 shows the TEM images of the attapulgite, graphene and ATP–G nanocomposite. The attapulgite nanoparticles are fibrous with a diameter of about 50 nm. The sheet-like graphene nanoparticles present a typical layer and transparent texture. Meanwhile, for the prepared ATP–G nanocomposite, the attapulgite nanofibers are enveloped by the graphene nanosheets, and present a fine combination between them.
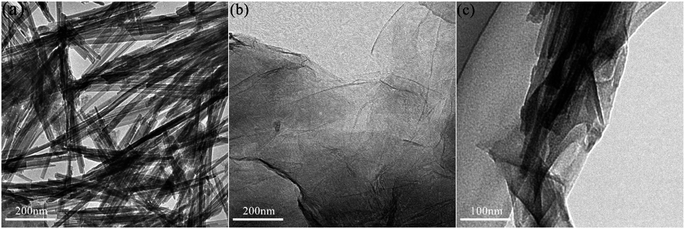 | ||
| Fig. 2 TEM morphology of (a) the attapulgite nanofibers; (b) the graphene nanoparticles; (c) ATP–G nanocomposite. | ||
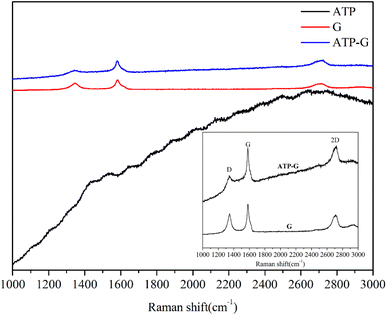
The Raman spectra of ATP, G and ATP–G nanocomposite are displayed in Fig. 3. There is no obvious peak for ATP. Meanwhile, for graphene, obvious D, G and 2D peaks at 1345 cm−1, 1582 cm−1 and 2715 cm−1, respectively, indicated the successful preparation of the few layers graphene.25 As for the ATP–G nanocomposite, obvious D, G and 2D peaks can also be detected. In addition, the intensity ratio of the D peak to G peak (ID/IG) for ATP–G is lower than that of graphene, indicating the defects reduction of graphene.26
The mineral lubricating oil 200SN was used as a base oil. Required amounts of mineral lubricating oil, additives and modifier (oleic acid) were stirred evenly through a ball mill at a speed of 250 rpm for a duration of 8 h. Finally, the oils used for the tribological test listed in Table 1 were prepared. The oils can be suspended stably after natural placement for more than four months. In addition, it can be seen from Table 2 that there is basically no change in the typical physicochemical properties of the base oil with the addition of the ATP–G nanocomposite.
| 200SN concentration (%) | Additives | Modifier (OA) concentration (%) | ||
|---|---|---|---|---|
| Composition | Concentration (%) | |||
| 200SN | 100 | — | — | — |
| ATP | 99 | ATP | 0.5 | 0.5 |
| G | 99 | G | 0.1 | 0.5 |
ATP![[thin space (1/6-em)]](https://www.rsc.org/images/entities/char_2009.gif) : :![[thin space (1/6-em)]](https://www.rsc.org/images/entities/char_2009.gif) G = 10 G = 10![[thin space (1/6-em)]](https://www.rsc.org/images/entities/char_2009.gif) : :![[thin space (1/6-em)]](https://www.rsc.org/images/entities/char_2009.gif) 1 1 |
99 | ATP–G | 0.5 | 0.5 |
ATP![[thin space (1/6-em)]](https://www.rsc.org/images/entities/char_2009.gif) : :![[thin space (1/6-em)]](https://www.rsc.org/images/entities/char_2009.gif) G = 8 G = 8![[thin space (1/6-em)]](https://www.rsc.org/images/entities/char_2009.gif) : :![[thin space (1/6-em)]](https://www.rsc.org/images/entities/char_2009.gif) 1 1 |
99 | ATP–G | 0.5 | 0.5 |
ATP![[thin space (1/6-em)]](https://www.rsc.org/images/entities/char_2009.gif) : :![[thin space (1/6-em)]](https://www.rsc.org/images/entities/char_2009.gif) G = 6 G = 6![[thin space (1/6-em)]](https://www.rsc.org/images/entities/char_2009.gif) : :![[thin space (1/6-em)]](https://www.rsc.org/images/entities/char_2009.gif) 1 1 |
99 | ATP–G | 0.5 | 0.5 |
ATP![[thin space (1/6-em)]](https://www.rsc.org/images/entities/char_2009.gif) : :![[thin space (1/6-em)]](https://www.rsc.org/images/entities/char_2009.gif) G = 4 G = 4![[thin space (1/6-em)]](https://www.rsc.org/images/entities/char_2009.gif) : :![[thin space (1/6-em)]](https://www.rsc.org/images/entities/char_2009.gif) 1 1 |
99 | ATP–G | 0.5 | 0.5 |
ATP![[thin space (1/6-em)]](https://www.rsc.org/images/entities/char_2009.gif) : :![[thin space (1/6-em)]](https://www.rsc.org/images/entities/char_2009.gif) G = 2 G = 2![[thin space (1/6-em)]](https://www.rsc.org/images/entities/char_2009.gif) : :![[thin space (1/6-em)]](https://www.rsc.org/images/entities/char_2009.gif) 1 1 |
99 | ATP–G | 0.5 | 0.5 |
| Item value (ASTM) | |||||
|---|---|---|---|---|---|
| Density (g cm−3) | Kinematic viscosity (mm2 s−1) | Viscosity index | Pour point (°C) | Flash point (°C) | |
| 200SN | 0.881 | 41.2 (40 °C)/21.5 (100 °C) | 100 | −9 | 210 |
200SN + ATP–G nanocomposite (ATP![[thin space (1/6-em)]](https://www.rsc.org/images/entities/char_2009.gif) : :![[thin space (1/6-em)]](https://www.rsc.org/images/entities/char_2009.gif) G = 8 G = 8![[thin space (1/6-em)]](https://www.rsc.org/images/entities/char_2009.gif) : :![[thin space (1/6-em)]](https://www.rsc.org/images/entities/char_2009.gif) 1) 1) |
0.884 | 41.5 (40 °C)/21.7 (100 °C) | 102 | −8.5 | 206 |
2.2. Tribological test
The tribological tests were carried out on an optimal SRV-IV friction and wear tester. The upper specimen is an AISI 52100 steel ball (Φ 10 mm, 59–62 HRC, Ra = 0.1 μm), and the lower specimen is an AISI 1045 steel disc (Φ 24 mm × 8 mm, 27–30 HRC, Ra = 0.3 μm). During the tribological tests, the upper steel ball slides reciprocally against the fixed disc. The amplitude is 1 mm, the temperature is 50 °C, and the test duration is 30 min. At first, the tribological properties of the oils listed in Table 1 were studied at the load of 50 N and frequency of 30 Hz. Each tribological test was repeated at least 3 times. Both the friction coefficient and average resistance between the frictional pairs were measured in real time and recorded by the SRV tester. The average friction coefficient was calculated during the steady friction state. The resistance average can directly reflect the conductivity between the friction pair.9 The wear volume of the worn surface on the disc was measured by a MicroXAM surface mapping pro-filometer for at least three times, and the average value was calculated. Moreover, the effect of the applied load and oscillating frequency on the tribological properties of ATP and ATP–G was also studied.2.3. Worn surface analysis
SEM (Nova Nano 650) equipped with EDS was utilized to analyze the morphologies and elemental contents of the worn surfaces on the disks. XPS (ESCALAB 250Xi) was utilized to characterize the chemical state of typical elements on the worn surfaces of the disks. The XPS data were fitted by the XPSPEAK 4.1 software. The binding energy resolution is about ±0.2 eV.3. Results
3.1. Results and analysis of tribological tests
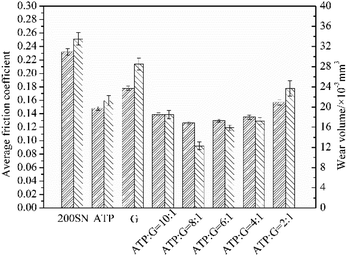
The average friction coefficient and wear volume of the lubricating oils listed in Table 1 are displayed in Fig. 4. The average friction coefficient and wear volume of 200SN is 0.232 and 33.5 × 10⁻³ mm3, respectively. After adding ATP and G, the average friction coefficient and wear volume of 200SN are significantly reduced. Furthermore, the ATP–G nanocomposite exhibits a lower average friction coefficient and wear volume than the single ATP or G additives. When the ratio of ATP and G for the ATP–G nanocomposite is 8![[thin space (1/6-em)]](https://www.rsc.org/images/entities/char_2009.gif) :
:![[thin space (1/6-em)]](https://www.rsc.org/images/entities/char_2009.gif) 1, the average friction coefficient and wear volume is the lowest, which is 0.126 and 12.3 × 10⁻³ mm3, respectively. This suggests that the appropriate ratio of ATP and G can give full play to their synergistic effect. It was found that the optimal ratio of ATP and G is 8
1, the average friction coefficient and wear volume is the lowest, which is 0.126 and 12.3 × 10⁻³ mm3, respectively. This suggests that the appropriate ratio of ATP and G can give full play to their synergistic effect. It was found that the optimal ratio of ATP and G is 8![[thin space (1/6-em)]](https://www.rsc.org/images/entities/char_2009.gif) :
:![[thin space (1/6-em)]](https://www.rsc.org/images/entities/char_2009.gif) 1; this may be related to the competitive adsorption of graphene and attapulgite in the worn area. When the content of graphene is low, the graphene cannot fully deposit on the worn surface to form a protective film. On the contrary, while the content of graphene is high, the tribochemical reaction between attapulgite and the matrix is inhibited.
1; this may be related to the competitive adsorption of graphene and attapulgite in the worn area. When the content of graphene is low, the graphene cannot fully deposit on the worn surface to form a protective film. On the contrary, while the content of graphene is high, the tribochemical reaction between attapulgite and the matrix is inhibited.
The variations of the friction coefficient and average resistance with the sliding time are shown in Fig. 5. The friction coefficient of 200SN is observed to slowly increase to 0.25 in the early stages. It stabilizes to an average value of 0.25 from 400 s to 1200 s. Subsequently, the friction coefficient continued to increase to 0.40 until the end. With the addition of ATP, the friction coefficient of 200SN is significantly reduced. Furthermore, the friction coefficient of ATP is more stable and shows no obvious fluctuations throughout the test. It can achieve stability in the early stage to about 0.15. As for graphene, its addition can also reduce the friction coefficient of 200SN. The friction coefficient or G remains stable at around 0.18 throughout the test. As for the ATP–G nanocomposite, the friction coefficient is more stable and lower than that of the single ATP or G additives. The friction coefficient remains stable at about 0.12 during the entire test. It can be seen from previous research that a tribofilm can be formed on the worn surface under the lubrication of oil-added ATP. Therefore, the average resistances were recorded to monitor the formation process of the tribofilm in real-time. Under the lubrication of 200SN and G, the resistances are about zero during the friction procedure, indicating the possible direct contact of the tribopairs. In comparison, the resistance for the specimens lubricated with the ATP and ATP–G nanocomposite fluctuate at around 0.4, which could be attributed to the formation of a tribofilm with poor electrical conductivity. In addition, the resistance value for the specimen lubricated with the ATP is higher than that with the ATP–G nanocomposite. This may be related to the doping of graphene into the tribofilm to improve its electrical conductivity.
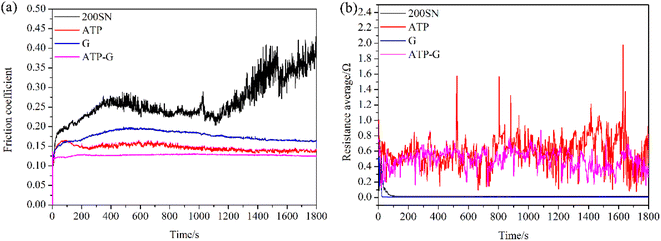 | ||
| Fig. 5 Variation of the (a) friction coefficient and (b) average resistance on the sliding time for 200SN, ATP, graphene and the ATP–G nanocomposite (50 N, 30 Hz, 50 °C, 30 min). | ||
3.2. Microstructure and composition of the worn surface
SEM and EDS was performed to analyze the microstructure and chemical composition of the worn disc surfaces. Fig. 6 displays the morphologies of the worn surfaces lubricated with 200SN, ATP, graphene and the ATP–G nanocomposite. A large number of pits and large area spalling of the material are found on the worn surface lubricated with 200SN, indicating serious fatigue wear. With the lubrication of oil-added ATP, the worn surface is noticeably smoother. A small number of pits and furrows, and a small area spalling of material exist on the worn surface. Meanwhile, for the oil-added graphene, the worn surface also became smoother with some pits and obvious spalling of material. Therefore, ATP and graphene can both remarkably improve the lubricity of 200SN. When the ATP–G nanocomposite was used as an additive for 200SN, the worn surface became smoother. Only light furrows can be seen on the worn surface. The SEM analysis further confirms the superior friction-reducing and antiwear performance of the ATP–G nanocomposite.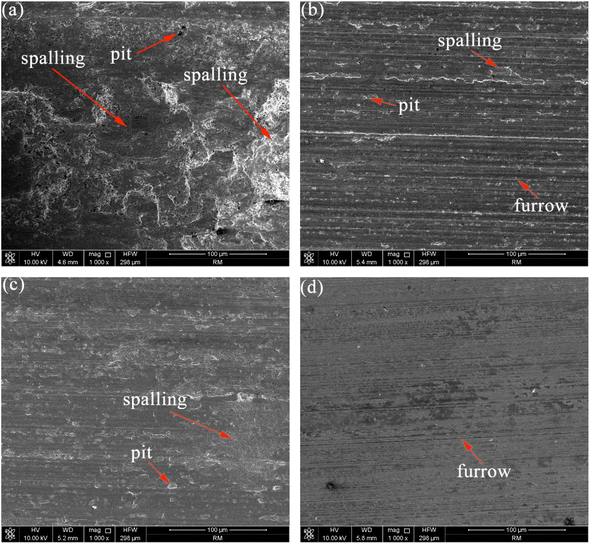 | ||
Fig. 6 SEM images of the worn surfaces lubricated with (a) 200SN; (b) ATP; (c) graphene; (d) ATP–G nanocomposite (ATP![[thin space (1/6-em)]](https://www.rsc.org/images/entities/char_2009.gif) : :![[thin space (1/6-em)]](https://www.rsc.org/images/entities/char_2009.gif) G = 8 G = 8![[thin space (1/6-em)]](https://www.rsc.org/images/entities/char_2009.gif) : :![[thin space (1/6-em)]](https://www.rsc.org/images/entities/char_2009.gif) 1). 1). | ||
Fig. 7 shows the corresponding EDS patterns of the worn surfaces shown in Fig. 6. Table 3 displays the semiquantitative analysis results. Under the lubrication of the base oil and oil-added graphene, only the elements of Fe and C were found on the worn surfaces. By comparison, the content of C on the worn surface lubricated with oil-added graphene is higher, indicating the physical adsorption of graphene. For the oil-added ATP and ATP–G nanocomposite, the elements of Fe, C, O and Si can be detected on the worn surfaces. In addition, in comparison with the oil-added ATP, the content of O on the worn surface lubricated with oil-added ATP–G nanocomposite is lower. It can be indicated from the above results that tribofilms consisting of Fe, C, O and Si were formed on the worn surfaces under the lubrication of oil-added ATP and ATP–G nanocomposite. The tribofilms can repair the pits and spalling of materials. Thus, the worn surfaces became smoother owing to the effect of ATP and the ATP–G nanocomposite.
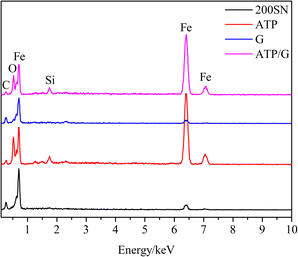 | ||
Fig. 7 EDS pattern of the worn surfaces lubricated with 200SN, ATP, graphene and ATP–G nanocomposite (ATP![[thin space (1/6-em)]](https://www.rsc.org/images/entities/char_2009.gif) : :![[thin space (1/6-em)]](https://www.rsc.org/images/entities/char_2009.gif) G = 8 G = 8![[thin space (1/6-em)]](https://www.rsc.org/images/entities/char_2009.gif) : :![[thin space (1/6-em)]](https://www.rsc.org/images/entities/char_2009.gif) 1). 1). | ||
![[thin space (1/6-em)]](https://www.rsc.org/images/entities/char_2009.gif) :
:![[thin space (1/6-em)]](https://www.rsc.org/images/entities/char_2009.gif) G = 8
G = 8![[thin space (1/6-em)]](https://www.rsc.org/images/entities/char_2009.gif) :
:![[thin space (1/6-em)]](https://www.rsc.org/images/entities/char_2009.gif) 1)
1)
| Element composition (at%) | ||||
|---|---|---|---|---|
| Fe | C | O | Si | |
| 200SN | 68.55 | 31.45 | ||
| ATP | 44.41 | 20.96 | 32.47 | 2.16 |
| G | 61.10 | 38.90 | ||
| ATP–G | 46.28 | 22.41 | 28.74 | 2.57 |
In order to further explore the friction-reduction and antiwear mechanism of the ATP–G nanocomposite, XPS was utilized to determine the composition of the tribofilm formed on the worn surface lubricated with oil containing ATP and the ATP–G nanocomposite. The analysis results are shown in Fig. 8 and 9. For ATP, the fitting of the Fe 2p2/3 spectra indicated that Fe (707.1 eV), Fe3O4 (708.9 eV), FeO (710.1 eV), Fe2O3 (711.2 eV) and FeOOH (712.0 eV) exist in the tribofilm.27,28 The C 1s spectra could be fitted into graphite (285.3 eV) and organic compounds (286.5 eV).27,29 The O 1s spectra could be fitted into four subpeaks at 530.2 eV, 531.3 eV, 532.4 eV and 533.6 eV, corresponding to Fe–O, FeOOH, SiO2 and organic compounds, respectively.27,30 The Si 2p peak at 103.6 eV corresponded to SiO2.27,31 As for the ATP–G nanocomposite, the fitting results of Fe 2p2/3, C 1s, O 1s and Si 2p indicated that the tribofilm was composed of Fe, Fe3O4, FeO, Fe2O3, FeOOH, graphite, SiO2 and organic compounds. In addition, the C–C peak (285 eV) in the C 1s spectra indicated the physical adsorption of graphene in the tribofilm.
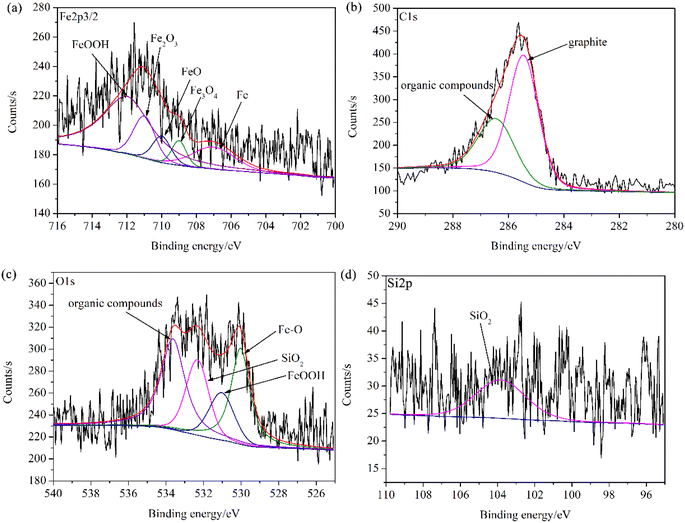 | ||
| Fig. 8 XPS patterns of the worn surface lubricated with oil containing ATP: (a) Fe 2p2/3, (b) C 1s, (c) O 1s, (d) Si 2p. | ||
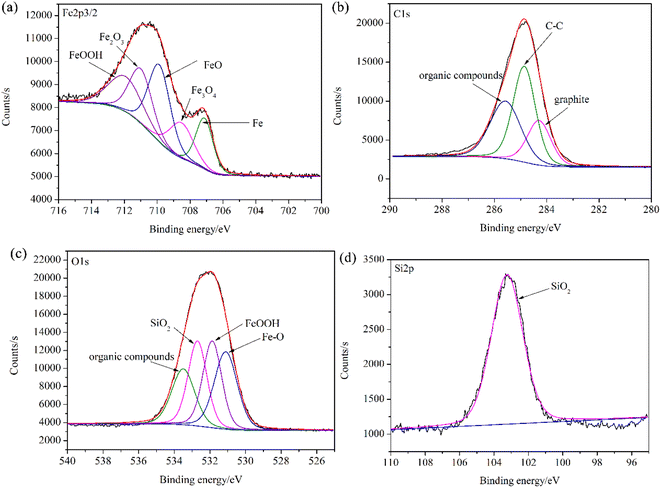 | ||
Fig. 9 XPS patterns of the worn surface lubricated with the ATP–G nanocomposite (ATP![[thin space (1/6-em)]](https://www.rsc.org/images/entities/char_2009.gif) : :![[thin space (1/6-em)]](https://www.rsc.org/images/entities/char_2009.gif) G = 8 G = 8![[thin space (1/6-em)]](https://www.rsc.org/images/entities/char_2009.gif) : :![[thin space (1/6-em)]](https://www.rsc.org/images/entities/char_2009.gif) 1): (a) Fe 2p2/3, (b) C 1s, (c) O 1s, (d) Si 2p. 1): (a) Fe 2p2/3, (b) C 1s, (c) O 1s, (d) Si 2p. | ||
The cross-section SEM morphology and corresponding local area element contents on the worn surface lubricated with the ATP–G nanocomposite are displayed in Fig. 10 and Table 4. The steel matrix is composed of martensite (region A) and ferrite (region B). It can be clearly observed that a white tribofilm was formed on the steel matrix. Furthermore, the tribofilm and steel matrix are tightly bonded together. The elements of Fe, C and O can be detected in the steel matrix. As for the formed tribofilm, Fe, C, O, Si, Mg and Al were found in it.
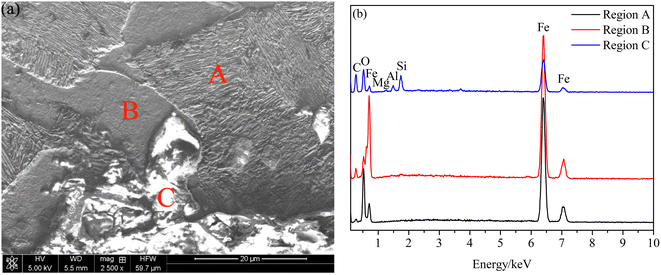 | ||
Fig. 10 The (a) cross-sectional SEM images and (b) EDS pattern of the selected region on the worn surface lubricated with the ATP–G nanocomposite (ATP![[thin space (1/6-em)]](https://www.rsc.org/images/entities/char_2009.gif) : :![[thin space (1/6-em)]](https://www.rsc.org/images/entities/char_2009.gif) G = 8 G = 8![[thin space (1/6-em)]](https://www.rsc.org/images/entities/char_2009.gif) : :![[thin space (1/6-em)]](https://www.rsc.org/images/entities/char_2009.gif) 1). 1). | ||
| Element composition (at%) | ||||||
|---|---|---|---|---|---|---|
| Fe | C | O | Si | Mg | Al | |
| Region A | 47.39 | 12.57 | 40.04 | |||
| Region B | 49.63 | 34.26 | 16.11 | |||
| Region C | 12.45 | 54.45 | 29.03 | 2.71 | 0.35 | 1.00 |
4. Discussion
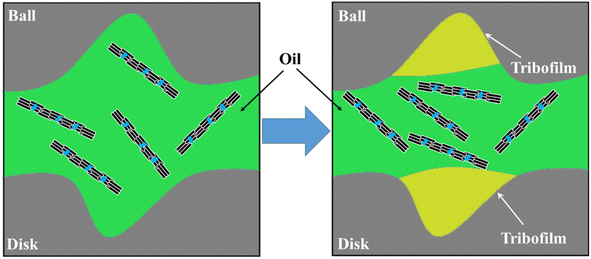
It can be indicated from the systematic experiments that the prepared attapulgite–graphene nanocomposite can significantly improve the friction-reducing and antiwear properties of the 200SN mineral lubricating oil. The improvement effect is better than the single attapulgite and graphene nanomaterials. Under the lubrication of oil containing attapulgite–graphene nanocomposite, lubricating oil molecules were spread onto the worn surface to form an oil film. Meanwhile, the attapulgite–graphene nanoparticles were uniformly transported to the worn areas. Under the squeezing and shearing effects of the friction pair, structural instability of attapulgite occurred, releasing extensive active oxygen atoms, Si–O and –OH.8,9 Under the energy provided by friction, tribochemical reactions among the substances released from attapulgite, iron filings, lubricating oil and attapulgite–graphene nanocomposite occurred. Consequently, a tribofilm composed of Fe, Fe3O4, FeO, Fe2O3, FeOOH, graphite, graphene, SiO2 and organic compounds was formed on the worn surface. The tribofilm can repair the worn areas, thus reducing the friction coefficient and wear loss. The tribofilm and lubricating oil can achieve the solid–liquid coupling lubrication effect (Fig. 11). It is interesting that the attapulgite–graphene nanocomposite exhibits better friction-reducing and antiwear properties than attapulgite and graphene. This result may be ascribed to the following factors: (1) under the combined action of pressure and shear force, graphene can rearrange in the direction parallel to the sliding boundary, thus forming a layered thin film. (2) The doping of graphene nanosheets into the tribofilm can improve its hardness and self-lubricating properties.Furthermore, the effects of the load and frequency on the tribological properties of oil-added attapulgite and attapulgite–graphene nanocomposite were investigated. The results are shown in Tables 5 and 6. It can be seen from Table 5 that the attapulgite–graphene nanocomposite possesses better friction-reduction and antiwear properties than attapulgite under all loads. The most significant improvement in the friction-reduction property is achieved at 100 N, and at 50 N for the antiwear property. Meanwhile, the attapulgite–graphene nanocomposite possesses better friction-reduction and antiwear properties than attapulgite under all frequencies. The most significant improvement in the friction-reduction property is achieved at 30 Hz. In the antiwear property, the most significant improvement is achieved at 40 Hz. Different loads and frequencies can bring different energies for the tribochemical reaction, thus making the difference of the composition, microstructure and thickness of the tribofilm formed on the worn surface. Meanwhile, different loads and frequencies can cause varying degrees of abrasion for the tribofilm. Hence the attapulgite–graphene nanocomposite exhibits different tribological behaviors under different loads and frequencies. The revelation of this phenomenon requires further in-depth research, such as online real-time monitoring of the lubrication process.
| Friction coefficient | Wear volume/×10−3 mm3 | |||||||||
|---|---|---|---|---|---|---|---|---|---|---|
| 10 N | 20 N | 50 N | 100 N | 200 N | 10 N | 20 N | 50 N | 100 N | 200 N | |
| ATP | 0.125 | 0.132 | 0.148 | 0.156 | 0.164 | 10.8 | 15.2 | 21.3 | 33.9 | 51.4 |
| ATP–G | 0.111 | 0.115 | 0.126 | 0.129 | 0.142 | 8.4 | 9.6 | 12.3 | 22.9 | 36.7 |
| Friction coefficient | Wear volume/×10−3 mm3 | |||||||||
|---|---|---|---|---|---|---|---|---|---|---|
| 10 Hz | 20 Hz | 30 Hz | 40 Hz | 50 Hz | 10 Hz | 20 Hz | 30 Hz | 40 Hz | 50 Hz | |
| ATP | 0.168 | 0.156 | 0.148 | 0.132 | 0.120 | 12.8 | 18.5 | 21.3 | 30.7 | 38.9 |
| ATP–G | 0.147 | 0.136 | 0.126 | 0.114 | 0.105 | 8.4 | 11.4 | 12.3 | 16.7 | 24.7 |
In the future, we will continue to optimize the friction-reduction and antiwear properties of the ATP–G nanocomposite, such as optimizing the preparation process of the nanocomposite, and improving the dispersion stability of the nanocomposite in lubricating oil. In addition, we will conduct a more in-depth and systematic analysis of the composition and structure of the formed tribofilm to explore the tribological mechanism of the ATP–G nanocomposite.
5. Conclusions
The ATP–G nanocomposites were prepared through a simple process. It was found that the attapulgite nanofibers are enveloped by the graphene nanosheets, and present fine combination. The prepared attapulgite–graphene nanocomposite can significantly improve the friction-reducing and antiwear properties of the 200SN mineral lubricating oil. Superior tribological performance can be achieved when the ratio of ATP and G is 8![[thin space (1/6-em)]](https://www.rsc.org/images/entities/char_2009.gif) :
:![[thin space (1/6-em)]](https://www.rsc.org/images/entities/char_2009.gif) 1. During the friction procedure, tribochemical reactions occurred on the worn surface, forming a tribofilm composed of Fe, Fe3O4, FeO, Fe2O3, FeOOH, graphite, graphene, SiO2 and organic compounds. The formed tribofilm and steel matrix are tightly bonded together. The tribofilm and lubricating oil can achieve the solid–liquid coupling lubrication effect, thus reducing the friction and wear. The attapulgite–graphene nanocomposite exhibits different tribological behaviors under different loads and frequencies. However, the tribological behaviors under different loads and frequencies were not be elaborated in detail.
1. During the friction procedure, tribochemical reactions occurred on the worn surface, forming a tribofilm composed of Fe, Fe3O4, FeO, Fe2O3, FeOOH, graphite, graphene, SiO2 and organic compounds. The formed tribofilm and steel matrix are tightly bonded together. The tribofilm and lubricating oil can achieve the solid–liquid coupling lubrication effect, thus reducing the friction and wear. The attapulgite–graphene nanocomposite exhibits different tribological behaviors under different loads and frequencies. However, the tribological behaviors under different loads and frequencies were not be elaborated in detail.
Conflicts of interest
There are no conflicts to declare.Acknowledgements
The authors would like to acknowledge the financial support from the National Natural Science Foundation of China (51705511).References
- G. Liu, X. Li, B. Qin, D. Xing and Y. Guo, Investigation of the mending effect and mechanism of copper nano-particles on a tribologically stressed surface, Tribol. Int., 2004, 17, 961–966 CAS.
- A. H. Battez, R. Gonzalez and J. L. Viesca, CuO, ZrO2 and ZnO nanoparticles as antiwear additive in oil lubricants, Wear, 2008, 265, 422–428 CrossRef.
- S. Chen, W. Liu and L. Yu, Preparation of DDP-coated PbS nanoparticles and investigation of the antiwear ability of the prepared nanoparticles as additive in liquid paraffin, Wear, 1998, 218, 153–158 CrossRef CAS.
- L. Rapoport, Y. Feldman, M. Homyonfer, H. Cohen, J. Sloan, J. L. Hutchison and R. Tenne, Inorganic fullerene-like material as additives to lubricants: Structure–function relationship, Wear, 1999, 225–229, 975–982 CrossRef CAS.
- H. D. Huang, J. P. Tu, L. P. Gan and C. Z. Li, An investigation on tribological properties of graphite nanosheets as oil additive, Wear, 2006, 261, 140–144 CrossRef CAS.
- V. B. Kumar, A. K. Sahu and K. B. S. Rao, Development of Doped Carbon Quantum Dot-Based Nanomaterials for Lubricant Additive Applications, Lubricants, 2022, 10, 144 CrossRef CAS.
- A. Senatore, H. Hong, V. D'Urso and H. Younes, Tribological Behavior of Novel CNTs-Based Lubricant Grease in Steady-State and Fretting Sliding Conditions, Lubricants, 2021, 9, 107 CrossRef CAS.
- F. Nan, Y. Xu, B. S. Xu, F. Gao, Y. X. Wu and X. H. Tang, Effect of natural attapulgite powders as lubrication additive on the friction and wear performance of a steel tribo-pair, Appl. Surf. Sci., 2014, 307, 86–91 CrossRef CAS.
- H. L. Yu, H. M. Wang, Y. L. Yin, Z. Y. Song, X. Y. Zhou, X. C. Ji, M. Wei, P. J. Shi, Z. M. Bai and W. Zhang, Tribological behaviors of natural attapulgite nanofibers as an additive for mineral oil investigated by orthogonal test method, Tribol. Int., 2021, 153, 106562 CrossRef CAS.
- F. Nan, Y. Xu, B. S. Xu, F. Gao, Y. X. Wu and Z. G. Li, Tribological Performance of Attapulgite Nano-fiber/Spherical Nano-Ni as Lubricant Additive, Tribol. Int., 2014, 56, 531–541 CAS.
- F. Nan, K. H. Zhou, S. Liu, J. B. Pu, Y. H. Fang and W. X. Ding, Tribological properties of attapulgite/La2O3 nanocomposite as lubricant additive for a steel/steel contact, RSC Adv., 2018, 8, 16947 RSC.
- F. Nan and D. Wang, Tribological Properties of Attapulgite Nanofiber as Lubricant Additive for Electric-Brush Plated Ni Coating, Lubricants, 2023, 11, 204 CrossRef CAS.
- V. Eswaraiah, V. Sankaranarayanan and S. Ramaprabhu, Graphene-Based Engine Oil Nanofluids for Tribological Applications, ACS Appl. Mater. Interfaces, 2011, 3, 4221–4227 CrossRef CAS PubMed.
- Y. B. Guo and S. W. Zhang, The Tribological Properties of Multi-Layered Graphene as Additives of PAO2 Oil in Steel–Steel Contacts, Lubricants, 2016, 4, 30 CrossRef.
- Z. B. Cai, L. Zhao, X. Zhang, W. Yue and M. H. Zhu, Combined Effect of Textured Patterns and Graphene Flake Additives on Tribological Behavior under Boundary Lubrication, PLoS One, 2016, 11, e0152143 CrossRef PubMed.
- J. Sanes, M. D. Avilés, N. Saurín, T. Espinosa, F. J. Carrión and M. D. Bermúdez, Synergy between graphene and ionic liquid lubricant additives, Tribol. Int., 2017, 116, 371–382 CrossRef CAS.
- G. Paul, S. Shit, H. Hirani, T. Kuila and N. C. Murmu, Tribological behavior of dodecylamine functionalized graphene nanosheets dispersed engine oil nanolubricants, Tribol. Int., 2019, 131, 605–619 CrossRef CAS.
- X. Li, C. Gan, Z. Han, H. Yan, D. Chen, W. Li, H. Li, X. Fan, D. Li and M. Zhu, High dispersivity and excellent tribological performance of titanate coupling agent modified graphene oxide in hydraulic oil, Carbon, 2020, 165, 238–250 CrossRef CAS.
- H. Fu, X. Fan, W. Li, M. Zhu, J. Peng and H. Li, In situ modified multilayer graphene toward high-performance lubricating additive, RSC Adv., 2017, 7, 24399–24409 RSC.
- D. Zheng, Y. P. Wu, Z. Y. Li and Z. B. Cai, Tribological properties of WS2/graphene nanocomposites as lubricating oil additives, RSC Adv., 2017, 7, 14060–14068 RSC.
- F. Su, G. Chen and P. Huang, Lubricating performances of graphene oxide and onion-like carbon as water-based lubricant additives for smooth and sand-blasted steel discs, Friction, 2020, 8, 47–57 CrossRef CAS.
- Y. Meng, F. Su and Y. Chen, Au/Graphene Oxide Nanocomposite Synthesized in Supercritical CO2 Fluid as Energy Efficient Lubricant Additive, ACS Appl. Mater. Interfaces, 2017, 9, 39549–39559 CrossRef CAS PubMed.
- F. Nan and Y. Yin, Improving of the tribological properties of attapulgite base grease with graphene, Lubr. Sci., 2021, 33, 380–393 CrossRef CAS.
- Y. F. Li and F. Nan, Achieving long term anti-corrosion waterborne epoxy coating by attapulgite loaded octadecylamine/graphene nanocomposite, Polym. Test., 2023, 129, 108290 CrossRef CAS.
- A. Ferrari and D. Basko, Raman spectroscopy as a versatile tool for studying the properties of graphene, Nat. Nanotechnol., 2013, 4, 8 Search PubMed.
- Y. W. Hu, Y. X. Wang, Z. X. Zeng, H. C. Zhao, J. L. Li, X. W. Ge, L. P. Wang, Q. J. Xue, C. L. Mao and S. J. Chen, BLG-RGO: A novel nanoadditive for water-based lubricant, Tribol. Int., 2019, 135, 277–286 CrossRef CAS.
- C. D. Wagner, W. M. Riggs, L. E. Davis, J. F. Moulder and G. E. Muilenberg, Handbook of X-Ray Photoelectron Spectroscopy, Perkin-Elmer Corporation, Eden Prairie, MN, 1979 Search PubMed.
- N. S. McIntyre and D. G. Zetaruk, X-ray photoelectron spectroscopic studies of iron oxides, Anal. Chem., 1997, 49, 1521–1529 CrossRef.
- S. N. Du, J. L. Sun and P. Wu, Preparation, characterization and lubrication performances of graphene oxide-TiO2 nanofluid in rolling strips, Carbon, 2018, 140, 338–351 CrossRef CAS.
- Y. Chen, X. H. Li, P. L. Wu, W. Li and X. Y. Zhang, Enhancement of structural stability of nano-sized amorphous Fe2O3 powders by surface modification, Mater. Lett., 2007, 61, 1223–1226 CrossRef CAS.
- B. Lamontagne, F. Semond and D. Roy, X-ray photoelectron spectroscopic study of Si (111) oxidation promoted by potassium multilayers under low O2 pressures, J. Electron Spectrosc. Relat. Phenom., 1995, 73, 81–88 CrossRef CAS.
| This journal is © The Royal Society of Chemistry 2024 |


