 Open Access Article
Agri-waste derived electroactive carbon–iron oxide nanocomposite for oxygen reduction reaction: an experimental and theoretical study†
Pallavi B. Jagdale a,
Sai Rashmi Manippady
 *ab,
Rohit Anand
 c,
Geunsik Lee
 c,
Akshaya Kumar Samal
 a,
Ziyauddin Khan
 d and
Manav Saxena
 *a
*a
aCentre for Nano and Material Sciences, Jain (Deemed-to-be University), Bengaluru, Karnataka-562112, India. E-mail: sairashmi1994@gmail.com; s.manav@jainuniversity.ac.in; manavsaxena19@gmail.com
bFaculty of Chemistry, University of Warsaw, Pasteura 1, 02-093 Warsaw, Poland
cCenter for Superfunctional Materials, Department of Chemistry, Ulsan National Institute of Science and Technology (UNIST), 50 UNIST-gil, Ulsan, 44919, South Korea
dLaboratory of Organic Electronics Department of Science and Technology, Linköping University, Norrköping, SE-60174, Sweden
First published on 16th April 2024
Abstract
Herein, we have utilized agri-waste and amalgamating low Fe3+, to develop an economic iron oxide–carbon hybrid-based electrocatalyst for oxygen reduction reaction (ORR) with water as a main product following close to 4e− transfer process. The electrocatalytic activity is justified by electrochemical active surface area, synergetic effect, and density functional theory calculations.
1 Introduction
In academia and industry, advanced techniques for sustainable energy storage and conversion have received a lot of attention due to the faster depletion of fossil fuels and accompanying pollution. For cleaner power generation, fuel cells and metal rechargeable air batteries are next-generation devices. However, the cathodic oxygen reduction reaction (ORR) in these devices is sluggish due to an exceptionally strong O![[double bond, length as m-dash]](https://www.rsc.org/images/entities/char_e001.gif) O bond energy of 498 kJ mol−1.1 To lower the energy barrier, it is necessary to use electrocatalysts for bond activation and cleavage. Pt-based catalysts are used commercially which is roughly one-third of the device costs and are usually susceptible to fuel crossover and suffer from poor stability, thus tremendously limiting the massive applications.2,3 Consequently, for large-scale applications, it is of the utmost importance to develop highly active, stable, and cost-effective ORR electrocatalysts. Specific surface area, and number of active sites are the important factors which affect ORR activity. Also, ORR activity is determined by the overall activity of the catalyst and the exposed active sites.4
O bond energy of 498 kJ mol−1.1 To lower the energy barrier, it is necessary to use electrocatalysts for bond activation and cleavage. Pt-based catalysts are used commercially which is roughly one-third of the device costs and are usually susceptible to fuel crossover and suffer from poor stability, thus tremendously limiting the massive applications.2,3 Consequently, for large-scale applications, it is of the utmost importance to develop highly active, stable, and cost-effective ORR electrocatalysts. Specific surface area, and number of active sites are the important factors which affect ORR activity. Also, ORR activity is determined by the overall activity of the catalyst and the exposed active sites.4
The non-precious (Mn, Fe, Co, and Ni-based),5–8 metal–nitrogen–carbon,9 hetero-atoms doped carbon materials,10,11-based electrocatalysts have gained attention due to sufficient active sites, close to 4e− reduction pathway, and long-term durability.12 Further, lignin-rich biomass-derived carbon has attracted attention to developing greener, economic biomass-based electrocatalysts due to low-cost, high, and stable electrocatalytic activity.10,13,14 The cost-effective iron/nitrogen co-doped carbon catalysts show good conductivity with higher catalytic activity.15 In a recent report, Ahmed et al. represented Fe NPs inside metal–organic frameworks showing good ORR performance and highly stable catalyst.16 J. Ren et al. synthesized zeolitic-imidazolate-framework-derived Fe–NC catalysts with good ORR activity.4 Among biomass, bagasse is one of the vital agri-waste due to easy availability, cheap, cellulose, hemicellulose, and lignin-rich.17,18 To reach out the demands of ORR electrocatalysts by tapping into the potential of biomass-derived precursors, mainly bagasse. We target to synthesise ORR catalysis by using biomass-derived precursors and a simple innovative synthesis technique. In addition to experimentation and electrochemical analysis, we also discussed the theoretical aspects using density functional theory (DFT) calculations to understand the mechanistic part.
Herein, we report an economical carbon–iron oxide composite material using bagasse as a carbon source with optimized Fe3+ concentration ions via the carbonization process without any additional activation step. The only chemical used in our synthesis is Fe3+ precursor, which is significantly cheap, abundant, and non-toxic. We have rationally designed the composite to use the coordinating ability of oxygen groups of cellulose, sugar, and lignin moieties with Fe3+ ions. The interaction of Fe3+ ions with oxygen functional groups results homogeneously dispersed iron oxide nanoparticles in the carbon matrix upon carbonization at 900 °C (10 °C min−1) in N2 gas flow. We have synthesized nanocomposites by varying Fe percentage, which is termed as CFe-0 (control), CFe-1, CFe-2, and CFe-3 (carbon–iron oxide nanoparticles composites) and electrochemical studies had been performed to check their ORR activity.
2 Materials & methods
2.1 Experiment
A known amount of fine powdered biowaste (Saccharum officinarum) was soaked in Fe(NO3)3·9H2O aq. solution with different concentration of Fe3+ for 24 h in 1![[thin space (1/6-em)]](https://www.rsc.org/images/entities/char_2009.gif) :
:![[thin space (1/6-em)]](https://www.rsc.org/images/entities/char_2009.gif) 4 (g mL−1). Three samples were prepared by choosing 1, 2 and 8% (wt%) of Fe3+ concentration (w.r.t. bio-waste weight). The prepared samples were dried at 60 °C (12 h) followed by carbonization at 900 °C (temperature required for graphitization in presence of transition metal) under controlled heating (10 °C min−1) under N2 flow (20 mL min−1) at 1 atm pressure. After an hour, the furnace was allowed to cool to RT under N2 flow. The control sample CFe-0 was synthesized without Fe3+-precursor under identical reaction condition. The iron-treated samples were referred as CFe-1, CFe-2, and CFe-3, which represents the 1, 2 and 8% (wt%, wrt initial bio-waste weight) of iron content respectively.
4 (g mL−1). Three samples were prepared by choosing 1, 2 and 8% (wt%) of Fe3+ concentration (w.r.t. bio-waste weight). The prepared samples were dried at 60 °C (12 h) followed by carbonization at 900 °C (temperature required for graphitization in presence of transition metal) under controlled heating (10 °C min−1) under N2 flow (20 mL min−1) at 1 atm pressure. After an hour, the furnace was allowed to cool to RT under N2 flow. The control sample CFe-0 was synthesized without Fe3+-precursor under identical reaction condition. The iron-treated samples were referred as CFe-1, CFe-2, and CFe-3, which represents the 1, 2 and 8% (wt%, wrt initial bio-waste weight) of iron content respectively.
2.2 Characterization
![[thin space (1/6-em)]](https://www.rsc.org/images/entities/char_2009.gif) :
:![[thin space (1/6-em)]](https://www.rsc.org/images/entities/char_2009.gif) 1 w/w) in the solvent mixture of water and isopropanol (200 μl each). Next, 6 μl of Nafion (5 wt% in IPA) was added to the mixture followed by sonication for 30 minutes to get fine dispersion. Now, 4 μl of freshly prepared electrocatalytic ink was drop casted over the GC electrode (working electrode, diameter 3 mm) and allowed to dry for 30 min at ambient condition. This GC electrode coated with electrocatalyst was used for electrochemical studies.
1 w/w) in the solvent mixture of water and isopropanol (200 μl each). Next, 6 μl of Nafion (5 wt% in IPA) was added to the mixture followed by sonication for 30 minutes to get fine dispersion. Now, 4 μl of freshly prepared electrocatalytic ink was drop casted over the GC electrode (working electrode, diameter 3 mm) and allowed to dry for 30 min at ambient condition. This GC electrode coated with electrocatalyst was used for electrochemical studies.The ORR experiment was performed in a three-electrode system using rotating ring disc electrode (RRDE) in an aqueous solution of 0.1 M KOH. Glassy carbon (GC) electrode was used as working electrode, whereas platinum (Pt) electrode and Hg/HgO electrodes were served as counter and reference electrode, respectively. All potentials were converted with respect to reversible hydrogen electrode (RHE). All the electrochemical experiments were performed at the scan rate of 5 mV s−1. Cyclic voltammetry (CV) experiments were done at static conditions whereas, linear sweep voltammetry (LSV) was performed at different rotation speeds in continuous flow of O2. The EIS measurements were carried out at potential of −0.5 V vs. RHE under continuous O2 flow over the electrolyte at and rotating speed of 1600 rpm. The EIS spectra were recorded in the frequency range of 0.1 to 105 Hz with an amplitude of 5 mV. The long-term stability for ORR catalysis was evaluated by chronoamperometry, performed in 0.1 M KOH solution at a static potential of 0.25 V. To avoid accumulation of gas bubbles on the electrode surface, the electrode was maintained at a fixed rotation during the experiment. The number of electrons were calculated using K–L plot. Rotating ring disk electrode (RRDE) voltammetry was used to calculate the number of electrons and the amount of H2O2 formed during ORR is based on the ratio of the disk and the ring current.
2.3 Number of electrons calculation
| B = 0.62nFC0(D0)2/3ν−1/6 |
| jK = nFkC0 |
![[thin space (1/6-em)]](https://www.rsc.org/images/entities/char_2009.gif) 485 C mol−1), D0 is the diffusion coefficient of O2 in the electrolyte (1.93 × 10⁻⁵ cm2 s−1), ν is the kinetic viscosity of the electrolyte (1.01 × 10⁻² cm2 s−1), C0 is the concentration of O2 in the electrolyte (1.26 × 10⁻³ mol l−1) and k is electron transfer rate constant.
485 C mol−1), D0 is the diffusion coefficient of O2 in the electrolyte (1.93 × 10⁻⁵ cm2 s−1), ν is the kinetic viscosity of the electrolyte (1.01 × 10⁻² cm2 s−1), C0 is the concentration of O2 in the electrolyte (1.26 × 10⁻³ mol l−1) and k is electron transfer rate constant.where, N = 0.2678 is the collection efficiency, ID is the faradaic disk current, and IR is the faradaic ring current.
3 Results and discussion
3.1 Morphology characterization
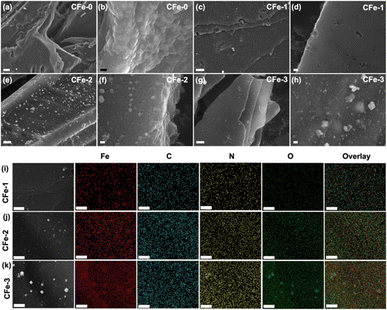
FESEM analysis was carried out to study the surface morphology of the composites. FESEM of CFe-0 shows irregular sheet morphology (Fig. 1a and b). The FESEM image of iron doped composites, CFe-1, CFe-2, and CFe-3 are shown in Fig. 1c–h. The high magnification FESEM images of CFe-1, CFe-2, and CFe-3 confirm sheet type morphology with embedded nanoparticles. To confirm the elemental distribution, elemental mapping has been performed for CFe-1, CFe-2 and CFe-3 and shown in respective columns (Fig. 1i–k). The FESEM image taken during elemental mapping suggested the particles are distributed on the surface. The Fe density in the elemental mapping has gradually increased from CFe-1 to CFe-3 as Fe percentage increases in the composite. The O element concentration has also increased as suggested by elemental mapping from CFe-1, CFe-2, and CFe-3. The particles shown in the SEM image (first column) are clearly visible in Fe and O mapping confirms them as iron oxides nanoparticles which are in corroboration with PXRD analysis, discussed later. Further, the electrochemical performance of these synthesized composite materials has been analysed in alkaline medium (0.1 M KOH).The surface area and the pore size distribution of materials had characterized using N2 adsorption–desorption at 77 K to know the surface area and pore size. The adsorption–desorption curves of CF-2 were ascribed to typical type IV profile (Fig. S1e†). The surface area of CFe-2 is ∼930 m2 g−1 which is ∼25% higher compared to that of CFe-0 (∼740 m2 g−1). The pore size distribution (PSD) for CFe-2 revealed pore diameters in the range of 0.4–1.7 nm (Fig. S1f†). The porous structure is advantageous because of its large surface area and easy accessibility of surface-active sites. The N2 adsorption–desorption, pore-size distribution plots and textural properties for CFe-0, CFe-1, CFe-2 and CFe-3 are tabulated (Table 1 and Fig. S1†). It is noteworthy here that, electrochemical property of any material is also dependent upon the electrochemically active surface area (ECSA) rather than only physical surface area which is explained further.
| Textural properties | CFe-0 | CFe-1 | CFe-2 | CFe-3 |
|---|---|---|---|---|
| Surface area (m2 g−1) | 740 | 623 | 930 | 462 |
| Total pore volume (cm3 g−1) | 0.33 | 0.32 | 0.53 | 0.50 |
Further, PXRD analysis was performed to determine crystallographic structure. CFe-0 shows broad peaks for (002) and (100) for amorphous carbon (Fig. 2a). The sharp peaks in PXRD of CFe-1, CFe-2 and CFe-3 confirm the crystalline nature of the samples (Fig. 2b–d). The sharp peaks in PXRD are marked for the corresponding planes of carbon and Fe3O4. For instance, CFe-2 PXRD shows the sharp peaks at 2θ = 25.6°, 44.6°, and 57.2° corresponding to the (002), (101), and (004) planes of graphite (Fig. 2c).26 The lattice spacing calculated for the (002) plane is 3.5 Å which is very close to the lattice spacing observed by HRTEM (3.7 Å). The peaks at 2θ = 37.6° and 43.1° corresponds to the (112) and (121) plane of Fe3C (ref. code 01-085-0871). The peaks at 2θ = 30.2°, 35.6°, 45.7°, 53.6°, 62.7° corresponds to the (022), (131), (242), and (044) crystal planes of Fe3O4 (ref. code 96-900-5839). The presence of graphitic structure, Fe3O4, and Fe3C as a hybrid structure is also supported through HRTEM analysis. Fe3C synthesis and graphitization process in CFe-2 is fascinating and explained further.
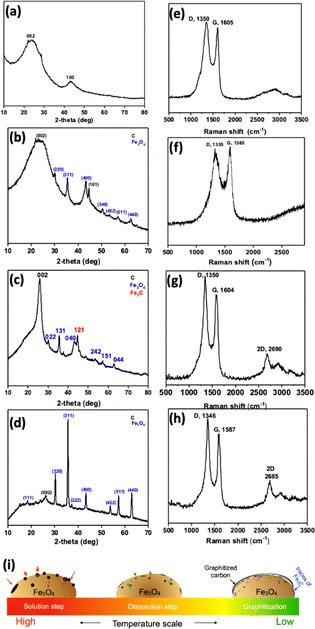 | ||
| Fig. 2 PXRD and Raman of (a and e) CFe-0, (b and f) CFe-1, (c and g) CFe-2 and (d and h) CFe-3, (i) graphitization scheme. | ||
Further Raman spectroscopy was performed to investigate the carbon structure. Raman spectra of all the samples show D and G band corresponding to disorder and sp2 hybridized carbon (Fig. 2e–h). The D- and G-bands are positioned at an average value of 1343 and 1590 cm−1, respectively. The presence of graphitized structure is confirmed by the appearance of a new band at 2685 cm−1 corresponds to the 2D band that appears in CFe-1, CFe-2, and CFe-3. The D- and G-bands are well separated as Fe-content is increased from CFe-1 to CFe-3, suggesting increase in graphitized nature of the sample. Fe is a well-known catalyst for multi-walled carbon nanotubes, graphene growth at 900 °C or higher temperature.27–30 The growth mechanism of MWCNT and graphene could be explained based upon the “solution-dissolution” mechanism based on the temperature-dependent carbon diffusion in iron (Fig. 2i). A considerable number of O atoms lead to the nucleation of Fe3+ ions and further formation of Fe3O4 particles at a higher temperature. At a high temperature, the carbon diffuses into the Fe3O4 particles and, upon cooling, carbon precipitates out as a disordered graphitized structure due to its catalytic activity and temperature-dependent solubility. The presence of graphitized carbon is noteworthy that might be expected to enhance the stability of the ORR catalysts.31 The traces of iron carbide are also formed due to the soluble carbon, which couldn't precipitate out upon cooling.
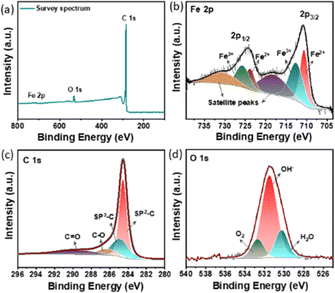
X-ray photoelectron spectroscopy (XPS) was employed to investigate the surface chemical composition of CFe-2. The survey spectrum clearly shows the presence of Fe, C, and O in synthesized material (Fig. 3a). The intensity of the Fe 2p peak is rather low compared to the peak intensity of C 1s ascribed to the minimal amount of Fe3O4 nanoparticle decoration on carbon support. The high-resolution Fe 2p spectrum of CFe-2 shows two broad peaks at 710.6 and 725.5 eV which are separated by split spin–orbit components of 14.9 eV (Fig. 3). The spectrum is deconvoluted into six peaks. It is well known that an increased valence state leads to an increment in the binding energy of the element. The intense peaks at 710.6 eV and 723.8 eV correspond to bivalent iron (Fe2+) of 2p3/2 and 2p1/2, respectively while peaks at 712.8 and 725.8 eV are ascribed to trivalent iron (Fe3+) of 2p3/2 and 2p1/2. The remaining two peaks are located at 718.1 and 725.6 could be attributed to satellite peaks. The high-resolution C 1s and O 1s spectra are shown in Fig. 3c and d. The high intense peak at 284.5 eV corresponds to graphitic carbon and the small peak at 286.3 eV corresponds to singly bonded C–O (Fig. 3c). The O 1s spectral band is further deconvoluted into three peaks at a binding energy of 530.8 eV, 532.1 eV, and 533.4 eV as shown in Fig. 3d. These peaks respectively correspond to surface-adsorbed H2O, hydroxide (OH−), and oxygen anion (O2−) in Fe3O4.
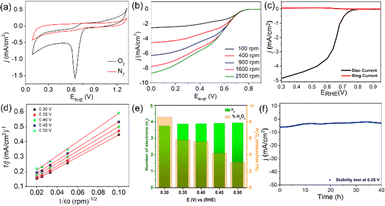
The CFe-2 cyclic voltammogram recorded in the O2 saturated electrolyte shows a reduction peak at 0.61 V vs. RHE (Fig. 5a), which is absent in the N2-atmosphere, unambiguously suggests CFe-2 potential to catalyse ORR. Further, LSV of CFe-2 was performed at 100–2500 rpm rotation speeds that didn't reach to limiting current with increasing rotation speed (Fig. 5b) and LSV of ring and disc current is given as Fig. 5c. This increasing trend in LSV suggests that the ORR process is still under mixed kinetics and diffusion despite the large overpotentials applied. It could be related to prepared carbon composite's intrinsic catalytic activity and porosity.34 The maximum current density at the highest rotation speed might be due to the abundant O2 dissolution and diffusion in the electrolyte by the continuous flow of O2.35
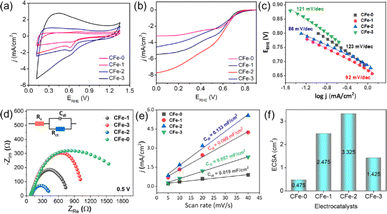
Importantly, the onset potential (Eonset, the potential at which the current density reaches to −0.1 mA cm−2) and half wave potential (E1/2, the potential corresponding to half of the maximum current density value) to catalyze ORR is 0.82 V vs. RHE and 0.65 V vs. RHE respectively for the CFe-2 compared with the literature (Table S1†). The higher activity of CFe-2 is due to the synergistic effect of Fe3O4 and Fe3C nanoparticles with carbon matrix, which is further proven by comparative LSV analysis of Fe3O4 and carbon layer separately. Note that the formation of Fe3C was in a trace quantity, so its role in electrocatalytic behaviour is not very clear at the present stage. The maximum current density obtained for CFe-0 (only carbon) and Fe3O4 (Sigma Aldrich, India) are −3.2 mA cm−2 (Fig. 4b) and −1.8 mA cm−2 (Fig. S2†), respectively, which are less than that of CFe-2. The highest current density of CFe-2 compared to its single components confirms that the CFe-2 ORR performance is due to the synergistic effect of Fe3O4 and the carbon layer.
Further, the linearity of the K–L plot between j−1 and ω−1/2 indicates the first-order reaction kinetics (Fig. 5d). Typically, the benchmark electrocatalyst for ORR, such as Pt/C, utilized a direct 4e− pathway which does not proceed via the formation of peroxide intermediate.34 This has been further validated by the RRDE experiment. The number of electrons calculated between the potential range 0.3–0.5 V through the RRDE experiment was found to be 3.7–3.9 (Fig. 5e), which is in good agreement with K–L plot. The K–L and RRDE plots indicated that the ORR process catalyzed by CFe-2 is a close 4e− process; therefore, water is the primary product in the ORR process. As estimated, H2O2 formed during ORR was found to be 3.1–8.6% in the potential range of 0.3–0.5 V (Fig. 5f). Mechanistically, the O2 molecule in transition metal oxides gets adsorbed (eqn (2)), followed by a reduction step (eqn (3)). Then it forms HO2− (eqn (4)), which further reduces into OH− (eqn (5)).36,37 So the overall reaction follows 4 e− pathways. The mechanism for ORR can be explained based on the following steps. Further, the catalytic stability test was performed up to 40 h at the static potential of 0.25 V vs. RHE at 1600 rpm (Fig. 5f). The CFe-2 demonstrates good catalytic stability even after 40 h during the ORR process.
| Fe3+ + e− ↔ Fe2+ | (1) |
| O2 → O2,ads | (2) |
| Fe2+ + O2,ads → Fe3+O2,ads− | (3) |
| O2,ads− + H2O + e− → HO2− + OH− | (4) |
| HO2− + H2O + 2e− → 3OH− | (5) |
Overall reaction O2 + 2H2O + 4e− → 4OH−
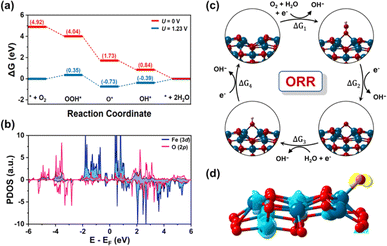
To gain a deeper understanding of the extraordinary catalytic performance of CFe-2, the active sites and four-electron pathway mechanism of ORR is studied through theoretical calculations based on density functional theory (DFT) (Fig. S3 and S4†). Herein, we investigated the mechanism for ORR under alkaline conditions, as shown in Fig. 6c. The calculated reaction free energy diagram at 0 V depicts that each electron transfer step maintains the downhill direction, indicating a spontaneous ORR reaction. The fourth elementary step, which involves the desorption of OH* is identified as the potential limiting step, corresponding to an overpotential of 0.39 V (Fig. 6a). The results demonstrate that ORR catalytic activity is limited due to the strong binding of OH on Fe center. As the oxygen adsorption on the surface is significantly influenced by the electronic structure and density of states of the catalyst, we calculated the projected density of states (PDOS), for O-adsorbed CFe-2 (Fig. 6b). The presence of occupied d-electrons near the Fermi level facilitates the transfer of charge from partially filled d-orbitals to the π2p* orbital of O atom. To determine the charge transfer between the active Fe site and adsorbed O atom, Bader charge and charge density difference (CDD) analysis are carried out (Fig. 6d). It is observed that the active Fe site loses approximately 0.96|e|, while the adsorbed oxygen gains approximately 0.79|e|. Consistent with Bader charge analysis, the CDD also indicates that electrons are transferred from Fe to the O atom (ESI†).
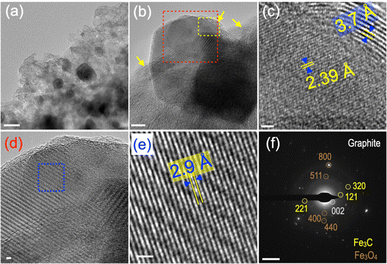
As CFe-2 shows the best activity, we have performed the detailed surface morphology characterization of CFe-2 using low and high-magnification TEM (Fig. 7a–e). Fig. 7a suggests that Fe3O4 nanoparticles (high contrast) are embedded homogeneously in the thin layer carbon matrix. The dense contrast area is Fe3O4, whereas yellow arrows indicate the graphitized carbon layers in the CFe-2 (Fig. 7b). The yellow and red colored dotted area in Fig. 7b is magnified further in Fig. 6c and d, respectively. The two different types of lattice-spacing, 2.39 Å and 3.7 Å could be seen at the near edge and edges of CFe-2 (Fig. 7c). The lattice spacing of 2.39 Å corresponds to the (121) plane of Fe3C (ref code 96-901-6232). The graphitic layers can be easily seen at the top-right corner adjacent to Fe3C (Fig. 7c). The 3.7 Å lattice spacing corresponds to the (002) graphite plane, further corroborated by PXRD and Raman. The lattice spacing is slightly higher than the standard 3.4 Å, suggesting the formation of disordered graphitic layers in CFe-2. Fe3C and graphitic layer together confirm the “solution-dissolution” growth mechanism and are schematically represented in Fig. 7c. The blue color marked area in Fig. 7d is further magnified in Fig. 7e, where lattice fringes could be visible, suggesting the high crystallinity of the particle. The lattice spacing of 2.9 Å corresponds to the (022) plane of Fe3O4 (ref. code 96-900-5839). The SAED pattern of CFe-2 exhibits characteristic diffraction spots for different planes of Fe3O4, Fe3C, and graphitized carbon (Fig. 7f). Energy-dispersive X-ray spectroscopy (EDS) analysis was performed to quantify the C, N, O, and Fe content in CFe-2. (Fig. S5 and Table S2†). The iron content in CFe-2 is 1.3% (at%), which agrees with XPS data. However, EDS is a short-range analysis, while XPS is surface-sensitive. To quantify the total iron content in CFe-2, ICP-OES analysis has been performed as per standard protocol. The total iron content in CFe-2 is 8.41 at%. Element analysis has been performed to quantify the carbon, nitrogen, and hydrogen in CFe-0, CFe-1, CFe-2, and CFe-3 samples (Table S2†).
4 Conclusions
In brief, we have synthesized an iron oxide–carbon composite using agri-waste as a carbon precursor. Moreover, no activation step is involved in the composite synthesis process, which helps reduce synthesis costs. Electrochemically active surface area (ECSA = 3.325 cm2), double layer capacitance (Cdl = 0.133 mF cm−2), and Tafel slope (86 mV dec−1) reveal the good ORR activity of the catalyst. The near to 4 electron transfer process and H2O as primary product suggests that the synthesized electrocatalyst will impact efficient electrocatalyst designing for ORR in alkaline solution.Author contributions
M. S. conceived the idea. S. R. M., P.·B. J. performed experiments, characterizations, analysis, writing manuscript. R. A., G. L. has performed the theoretical calculations. AKS, Z. K. assisted in microscopic and electrochemical data analysis.Conflicts of interest
There are no conflicts to declare.Acknowledgements
MS thanks research funding from SERB New Delhi, India (EMR/2017/003368). PBJ acknowledges SARTHI Pune for the CSMNRF-2021 research fellowship (CSMNRF-2021/2021-22/896) for financial support.Notes and references
- M. M. Fernández, E. M. Periñán, S. Royuela, J. Martínez, F. Zamora, L. Encarnacion and J. Segura, Appl. Mater. Today, 2022, 26, 101384 CrossRef.
- M. Al-Dhaifallah, M. A. Abdelkareem, H. Rezk, H. Alhumade, A. M. Nassef and A. G. Olabi, Int. J. Energy Res., 2021, 45, 1587–1598 CrossRef CAS.
- Q. Ma, H. Jin, J. Zhu, Z. Li, H. Xu, B. Liu, Z. Zhang, J. Ma and S. Mu, Adv. Sci., 2021, 8, 2102209 CrossRef CAS PubMed.
- J. Ren, Z. Shi and Y. Huang, Int. J. Hydrogen Energy, 2023, 48, 12333–12341 CrossRef CAS.
- Z. Ahmed and V. Bagchi, New J. Chem., 2021, 45, 22012–22033 RSC.
- B. Chang, S. Wu, Y. Wang, T. Sun and Z. Cheng, Nanoscale Horiz., 2022, 7, 1340–1387 RSC.
- X. Huang, C. Wang and Y. Hou, Chem. Commun., 2022, 58, 8884–8899 RSC.
- S. Nagappan, M. Duraivel, S. A. Hira, K. Prabakar, C.-S. Ha, S. H. Joo, K. M. Nam and K. H. Park, J. Mater. Chem. A, 2022, 10, 987–1021 RSC.
- J. Ma, W. Zhang, F. Yang, Y. Zhang, X. Xu, G. Liu, H. Xu, G. Liu, Z. Wang and S. Pei, RSC Adv., 2024, 14, 4607–4613 RSC.
- Z. Zhang, S. Yang, H. Li, Y. Zan, X. Li, Y. Zhu, M. Dou and F. Wang, Adv. Mater., 2019, 31, 1805718 CrossRef PubMed.
- J. Woo, J. S. Lim, J. H. Kim and S. H. Joo, Chem. Commun., 2021, 57, 7350–7361 RSC.
- W. Gu, L. Hu, J. Li and E. Wang, Electroanalysis, 2018, 30, 1217–1228 CrossRef CAS.
- S. Pérez-Rodríguez, D. Sebastián, C. Alegre, T. Tsoncheva, N. Petrov, D. Paneva and M. J. Lázaro, Electrochim. Acta, 2021, 387, 138490 CrossRef.
- J. Barrio, A. Pedersen, S. Favero, H. Luo, M. Wang, S. C. Sarma, J. Feng, L. T. T. Ngoc, S. Kellner, A. Y. Li, A. B. J. Sobrido and M.-M. Titirici, Chem. Rev., 2023, 123, 2311–2348 CrossRef CAS PubMed.
- W. Zhong, Z. Xiao, Y. Luo, D. Zhang, X. Chen and J. Bai, RSC Adv., 2023, 13, 36424–36429 RSC.
- M. S. Ahmed, H. Begum and Y.-B. Kim, J. Power Sources, 2020, 451, 227733 CrossRef CAS.
- S. R. Manippady, A. Singh, C. S. Rout, A. K. Samal and M. Saxena, ChemElectroChem, 2020, 7, 1928–1934 CrossRef CAS.
- S. Haghdan, S. Renneckar and G. D. Smith, in Lignin in Polymer Composites, ed. O. Faruk and M. Sain, William Andrew Publishing, 2016, pp. 1–11, DOI:10.1016/B978-0-323-35565-0.00001-1.
- H.-m. Kim, B.-c. Cha and D.-w. Kim, RSC Adv., 2023, 13, 26918–26924 RSC.
- G. Kresse and J. Furthmüller, Comput. Mater. Sci., 1996, 6, 15–50 CrossRef CAS.
- R. Li, L. Zhang, Y. Wang, J. Bai, X. Li and C. Zhang, RSC Adv., 2023, 13, 27705–27713 RSC.
- B. Hammer, L. B. Hansen and J. K. Nørskov, Phys. Rev. B: Condens. Matter Mater. Phys., 1999, 59, 7413–7421 CrossRef.
- A. Tkatchenko and M. Scheffler, Phys. Rev. Lett., 2009, 102, 073005 CrossRef PubMed.
- P. E. Blöchl, Phys. Rev. B: Condens. Matter Mater. Phys., 1994, 50, 17953–17979 CrossRef PubMed.
- K. Mathew, R. Sundararaman, K. Letchworth-Weaver, T. A. Arias and R. G. Hennig, J. Chem. Phys., 2014, 140, 084106 CrossRef PubMed.
- Z. Q. Li, C. J. Lu, Z. P. Xia, Y. Zhou and Z. Luo, Carbon, 2007, 45, 1686–1695 CrossRef CAS.
- Y. J. Jung, B. Wei, R. Vajtai, P. M. Ajayan, Y. Homma, K. Prabhakaran and T. Ogino, Nano Lett., 2003, 3, 561–564 CrossRef CAS.
- C. Mattevi, C. T. Wirth, S. Hofmann, R. Blume, M. Cantoro, C. Ducati, C. Cepek, A. Knop-Gericke, S. Milne and C. Castellarin-Cudia, J. Phys. Chem. C, 2008, 112, 12207–12213 CrossRef CAS.
- S. T. Neeli and H. Ramsurn, Carbon, 2018, 134, 480–490 CrossRef CAS.
- I. Kholmanov, E. Cavaliere, C. Cepek and L. Gavioli, Carbon, 2010, 48, 1619–1625 CrossRef CAS.
- H. Meng, Y. Liu, H. Liu, S. Pei, X. Yuan, H. Li and Y. Zhang, ACS Appl. Mater. Interfaces, 2020, 12, 41580–41589 CrossRef CAS PubMed.
- G. Cheng, T. Kou, J. Zhang, C. Si, H. Gao and Z. Zhang, Nano Energy, 2017, 38, 155–166 CrossRef CAS.
- J. Mohanta, B. Dey and S. Dey, J. Chem. Eng. Data, 2020, 65, 2819–2829 CrossRef CAS.
- Z. Khan, S. O. Park, J. Yang, S. Park, R. Shanker, H.-K. Song, Y. Kim, S. K. Kwak and H. Ko, J. Mater. Chem. A, 2018, 6, 24459–24467 RSC.
- G. Zhong, S. Xu, L. Liu, C. Z. Zheng, J. Dou, F. Wang, X. Fu, W. Liao and H. Wang, ChemElectroChem, 2020, 7, 1107–1114 CrossRef CAS.
- X. Ge, A. Sumboja, D. Wuu, T. An, B. Li, F. T. Goh, T. A. Hor, Y. Zong and Z. Liu, ACS Catal., 2015, 5, 4643–4667 CrossRef CAS.
- N. Parveen, Z. Khan, S. A. Ansari, S. Park, S. Senthilkumar, Y. Kim, H. Ko and M. H. Cho, Chem. Eng. J., 2019, 360, 415–422 CrossRef CAS.
Footnote |
| † Electronic supplementary information (ESI) available: LSV of Fe3O4, literature comparison, BET, EDS, elemental analysis, theoretical study. See DOI: https://doi.org/10.1039/d4ra01264j |
| This journal is © The Royal Society of Chemistry 2024 |


