 Open Access Article
Acid-assisted self-assembly of pyrene-capped tyrosine ruptures lysosomes to induce cancer cell apoptosis†
Jing Liab,
Jiaqi Songc,
Liang Shaoc,
Xianpeng Zhang c,
Ziyi Wangab,
Guanying Li
 *c,
Jiansheng Wang*ab and
Jia Zhang*b
aThe Second Clinical Medical School, Shaanxi University of Chinese Medicine, Xianyang Shaanxi, China. E-mail: wangjsh@xjtu.edu.cn
bThe Department of Thoracic Surgery, The First Affiliated Hospital of Xi'an Jiaotong University, Xi'an Jiaotong University, Xi'an Shaanxi, China. E-mail: zhangjiaxjtu@xjtu.edu.cn
cDepartment of Biophysics, School of Basic Medical Sciences, Xi'an Jiaotong University, Xi'an Shaanxi, China. E-mail: guanyingli@xjtu.edu.cn
First published on 15th May 2024
Abstract
Induced lysosomal membrane permeabilization (LMP) by peptide self-assembly has emerged as an effective platform for lysosome-targeted cancer therapy. In this study, we shift this strategical paradigm and present an innovative approach to LMP induction through amino acid-based self-assembly. Pyrene-capped tyrosine (Py-Tyr), as a proof-of-concept molecule, is designed with acidity-responsive self-assembly. Under acidic conditions (pH 4), Py-Tyr is protonated with reduced charge repulsion, and self-assembles into micrometer-scaled aggregates, which exceed the biological size of lysosomes. Cell experiments showed that Py-Tyr specifically accumulates in lysosomes and induces lysosome rupture, leading to the release of cathepsin B into the cytoplasm for subsequent apoptosis activation in cancer cells. This study capitalizes on the concept of amino acid assembly for efficient LMP induction, providing a simple and versatile platform for precise and effective therapeutic interventions in cancer therapy.
Introduction
In cancer cells, lysosomes undergo several alterations,1 such as enhanced lysosomal biogenesis, increased lysosomal enzyme activity, and altered lysosomal pH. These alterations on lysosomal function have profound effects on cancer cell survival, invasion, and resistance to therapy. On the other hand, they also present a unique vulnerability that can be exploited for therapeutic intervention.2,3 Targeting lysosomal membrane permeability and integrity has been demonstrated as one of the efficient strategies in lysosome-targeting therapy.4,5 Specifically, lysosomal membrane permeabilization (LMP) occurs under stress conditions, and leads to the leakage of lysosomal contents into the cytosol, triggering amplified stress response and cell death. For example, destabilization of the constitutive protein of lysosomal membrane, LAMP-2, could induce LMP.6 A synthetic platform could provide a simple and effective method for LMP induction, offering promising alternatives for lysosome-targeting therapy.Molecular self-assembly is a bottom-up building process to obtain large size structures. Oligopeptide-based building blocks such as diphenylalanine have been widely used for constructing self-assembled nanostructures, and developed as functional materials.7 By regulating the self-assembly processes or stimuli, peptide assembly can occur specifically on the pericellular space,8 on the cell membrane,9,10 or in the cytosol,11,12 generating subcellular organelle-targeting bio-nanointerfaces to interfere with specific targets or cause stress response leading to cell death. Recently, lysosome-targeting peptide self-assemblies have also been successfully developed.13–17 Although this approach has paved the way in lysosome targeted therapy, it faces challenges in achieving optimal specificity and control over lysosomal dynamics.
In this study we present a paradigm shift in strategy by designing amino acid-based self-assembly. Tyrosine (Tyr) as an essential aromatic amino acid in the nature, can self-assemble into well-organized nanostructure.18,19 However, at acidic pH, Tyr is positively charged and could not self-assemble. To actively utilize the self-assembly of Tyr and explore its capability for LMP induction, we incorporate a pyrene moiety on its N-terminal to obtain the designed molecule pyrene-1-butanoyl tyrosine (Py-Tyr, as shown in Scheme 1). Py-Tyr introduces a novel synthetic platform advancing the self-assembling capabilities of tyrosine for efficient LMP induction. This controlled assembly process, responding specifically to lysosomal acidity, ensures precise targeting and optimized functionality for LMP-mediated cancer therapy.
Results and discussions
Molecular design
Py-Tyr possesses several unique features tailored for efficient LMP induction: (1) N-capping of tyrosine blocks the protonation at acidic condition and reduces its charge repulsion; (2) the addition of pyrene ring offering extensional π–π stacking facilities the self-assembly; (3) self-assembly of Py-Tyr results in a higher apparent pKa than the theoretical pKa (3.5),20 aligning strategically with the acidic environment of lysosomes; (4) the presence of pyrene moiety enables the monitoring of Py-Tyr's self-assembly and cellular location through excimer emission.21 (5) low molecular weight of Py-Pyr compared to self-assembling peptides enhances cellular uptake and specificity of lysosome-targeting. Therefore, Py-Tyr emerges as a lead molecule capitalized on the amino acid self-assembly for targeting the distinct vulnerabilities of cancer cell lysosomes.pH-dependent self-assembly of Py-Tyr
Py-Tyr was synthesized by solid phase synthesis and characterized by mass spectrum and 1H NMR (Fig. S1 and 2†). Molecular geometries of Py-Tyr and its deprotonated form (Py-Tyr−) were optimized using Gaussian-09 software.22 The results showed that deprotonated Py-Tyr− exhibited a compact molecular conformation, where the pyrene ring and the phenol ring of Tyr residue were almost parallel (Fig. 1a). Under acidic condition, however, the conformation of Py-Tyr was extended, where the pyrene ring was intersecting against the phenol ring with a dihedral angle of 100° (Fig. 1b). The conformational difference illustrated that Py-Tyr under acidic condition has an extra direction of intermolecular interactions. A bimolecular geometry was also optimized and demonstrated that [Py-Tyr]2 dimer exhibited a tail-to-tail packing mode. The planar distance between two adjacent pyrene planes of 4.97 Å (Fig. 1c), indicating strong intermolecular interaction for emitting excimer fluorescence. | ||
| Fig. 1 Optimized geometries of deprotonated Py-Tyr− (a) protonated Py-Tyr (b) and its dimer [Py-Tyr]2 (c). Arrows indicate potential π–π interactions for self-assembly. | ||
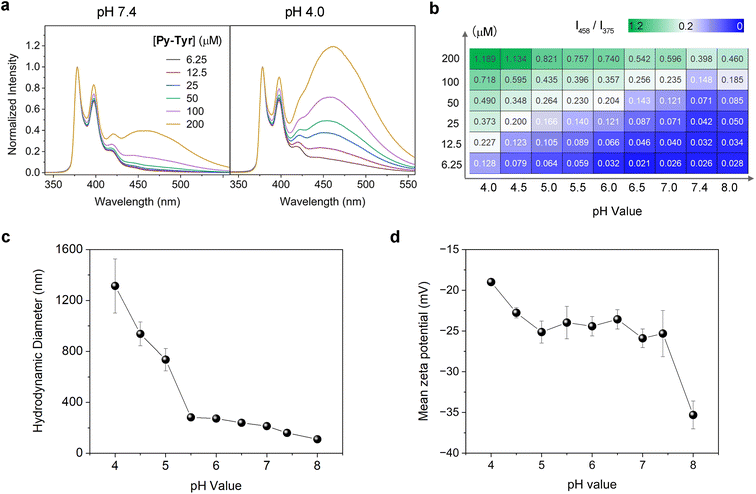
Therefore, we explored the pH-dependent self-assembly of Py-Tyr using emission spectroscopy. Concentration-dependent emission spectra of Py-Tyr at different pH conditions were recorded (Fig. S3†) and normalized based on the intensity of monomer fluorescent at 375 nm (Fig. S4†). Py-Tyr exhibited concentration-dependent excimer emission at 458 nm, which is not surprising. As shown in Fig. 2a, at physiological pH (7.4), Py-Tyr only emitted excimer fluorescence at high concentration (200 μM). At pH 4.0, however, excimer fluorescence could be observed at 25 μM, indicating strong intermolecular interaction of Py-Tyr at acidic condition. The intensity ratio between excimer fluorescence and monomer fluorescence of Py-Tyr was summarized and visualized using a heatmap (Fig. 2b). The higher ratio of I458/I375, the stronger self-assembly of Py-Tyr. At each pH value, the I458/I375 ratio of Py-Tyr increased when increasing its concentration. Under the same concentration, the I458/I375 ratio also increased when the media tuned acidic. The results clearly demonstrated a pH-dependent and concentration-dependent manner of Py-Tyr self-assembly. The UV-vis spectra of Py-Tyr at different pH values were also measured (Fig. S5†) and suggested that Py-Tyr could self-assemble when pH was lower than 5.
We then measured the hydrodynamic diameters of self-assembled structures of Py-Tyr at different pH values using dynamic light scattering (DLS). The results (Fig. 2c) showed that 100 μM of Py-Tyr could form nanoscale aggregates with an average diameter of 110 nm at pH 8.0. The hydrodynamic diameters of self-assembled structures slowly increased when the pH values varied from 8.0 to 5.5. At pH 5.0, the hydrodynamic diameter sharply increased to 736 nm. Micro-scaled aggregates could be observed under pH 4.0, as indicated by the hydrodynamic diameter at pH 4.0, probably because it was lower than the apparent pKa value. Zeta potential measurements (Fig. 2d) indicated that Py-Tyr carried negative charge, displaying a surface potential of −35.3 mV at pH 8.0. However, at pH 4.0, the surface potential significantly increases to −18.9 mV. These findings implied that the self-assembly behavior of Py-Tyr is influenced by pH values.
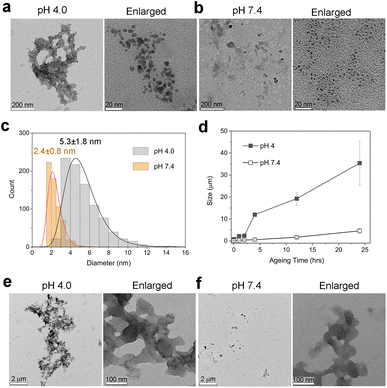
The morphologies of Py-Tyr self-assembled structures were examined using transmission electron microscopy (TEM). Under pH 4.0 Py-Tyr formed nanoparticles (Fig. 3a) with an average diameter of 5.3 ± 1.8 nm (Fig. 3c), which further clustered into large aggregates. Small particles of Py-Tyr also aggregated into large cluster under lysosomal lumen pH 4.5 (Fig. S6†). In contrast, Py-Tyr formed relatively small nanoparticles in PBS buffer (pH 7.4) with an average diameter of 2.4 ± 0.8 nm, and no large particle clusters could be observed (Fig. 3b). The size difference of single particle under pH 4 and under pH 7.4 could be attributed to their molecular conformations (Fig. 1).
Time-dependent self-assembly of Py-Tyr
After ageing under pH 4.0, the nanoparticles continuously self-assembled to form large aggregates. The growing sizes were monitored. As shown in Fig. 3d, the size of Py-Tyr self-assembled particles under pH 4.0 significantly increased over 10 μm after 4 h, and exceeded 30 μm after 24 h. However, at pH 7.4, the size of Py-Tyr self-assembled particles remained relatively stable, and no significant aggregation was observed even with extended time (Fig. 3d). This growing size of Py-Tyr self-assembled particles under pH 4.0 was further confirmed by TEM observation (Fig. 3e). In contrast, TEM images of Py-Tyr self-assembled particles under pH 7.4 showed small particle cluster (Fig. 3f). To simulate the self-assembly Py-Tyr under lysosomal environment, we monitored the ageing of Py-Tyr under pH 4.5 that is closed to the lysosomal acidity. Under pH 4.5, compact aggregates of Py-Tyr assemblies could be observed after 2 h, which continued growing to form large aggregates. Contrary, Py-Tyr slowly aggregated into particle clusters under pH physiological pH 7.4 (Fig. S7†). These findings confirmed the acid-assist enlargement of Py-Tyr aggregates, inspiring us to further investigate its LMP induction in cancer cells.Lysosome accumulation of Py-Tyr self-assembly
To assess the feasibility of Py-Tyr-induced LMP, we first tested the cytotoxicity of Py-Tyr assemblies against cancer cells, including lung cancer A549 cells, liver cancer HepG2 cells and osteosarcoma Saos2 cells using CCK-8 assay. Fig. 4 showed a concentration-dependent cytotoxic effect of Py-Tyr against these cancer cells. At 100 μM, Py-Tyr exhibited completely cancer killing ability against these cancer cells. This phenomenon was in line with the concentration-dependent self-assembling behaviors (Fig. 2a and b), implying potential LMP induction of Py-Tyr assemblies in cancer cells. Among these cancer cells, Py-Tyr showed the highest cytotoxicity against A549 cells with an IC50 value at 71 μM, which was chosen as the model cell line for studying the LMP induction of Py-Tyr assemblies.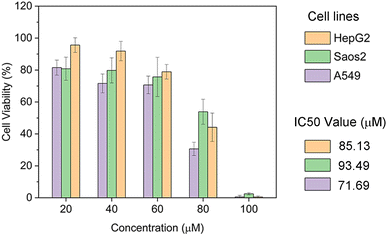 | ||
| Fig. 4 Cell viability of HepG2, Saos2 and A549 cells treated with 20, 40, 60, 80, 100 μM Py-Tyr for 48 h, mean ± SD, n = 5. | ||
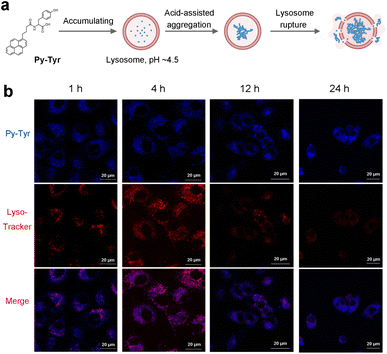
Freshly prepared Py-Tyr formed small particles under pH 7.4 (Fig. 2c and 3b), which could be internalized through endocytic pathways.23,24 During maturation of endosomes, the acidification increases and reaches pH 4.5–5.0 in the lysosomes. Considering self-assembly of Py-Tyr is pH-dependent, it is reasonable to hypothesize that during the endo/lysosomal internalization pathway, increasing acidification triggers the aggregation of Py-Tyr self-assemblies into large and micrometre-scaled assemblies, eventually trapping them in the lysosomes (Fig. 5a). Benefitting from the intrinsic fluorescence of pyrene fluorophore, we managed to monitor the process of targeting and accumulation of Py-Tyr assemblies within the lysosome by confocal laser scanning microscope (CLSM). As shown in Fig. 5b, A549 cells were treated with Py-Tyr for desired time and then co-stained with a commercial lysosome-specific dye Lyso-Tracker Red DND-99. After 20 min treatment of Py-Tyr, fluorescence signal appearing on the cell membrane was detected (Fig. S8†); meanwhile, fluorescence signal non-specifically locating in the cytosols was also detected, indicating cellular uptake of Py-Tyr. As the incubation time extended to 1 h (Fig. 5b) and 2 h (Fig. S8†), A549 cells showed bright intracellular fluorescence partially co-localizing with lysosomes, suggesting internalization of Py-Tyr. After 4 h incubation, the fluorescence of Py-Tyr dominantly colocalized with the Lyso-Tracker, revealing that specific lysosomal accumulation of Py-Tyr at 4 h.
A long incubation time was performed to investigate the alteration of Py-Tyr assemblies on lysosomes. At 12 h, CLSM images (Fig. 5b) showed that condensed spots of Py-Tyr fluorescence in bright intensity remained in the lysosomes, while the rest appeared in the cytosols, suggesting Py-Tyr assemblies escaped from the lysosomes. It should also be noted that intensity of Lyso-Tracker significantly decreased, implying the disturbance of Py-Tyr on the lysosomal environment. At 24 h, however, Lyso-Tracker fluorescence vanished, accompanied with the highly condensed fluorescence of Py-Tyr in micrometer-scaled spots which exceeded the biological sizes of lysosomes. These results revealed that acid milieu of lysosomes facilitated the continuous assembly of Py-Tyr into large-scaled assembled structures, eventually leading to LMP induction and lysosome rupture.
Lysosomes rupture induces cancer cell apoptosis
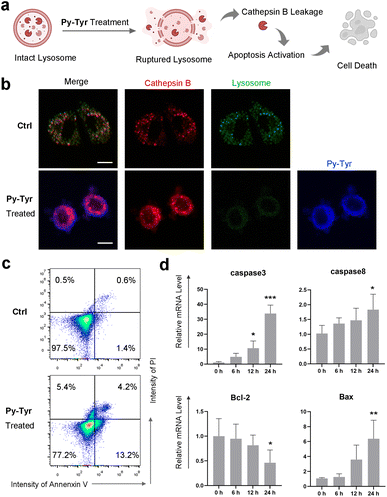
Lysosomes contain about 50 different hydrolases. Lysosomes rupture induced by Py-Tyr assemblies under acid stimuli potentially releases these hydrolases into the cytoplasm. The massive and uncontrolled leakage of lysosomal contents triggers the activation of apoptotic signalling cascades,25,26 contributing to irreversible cell damage (Fig. 6a). To verify, we fluorescently stained cathepsin B, one of the main hydrolases in lysosomes,27 and tracked its cellular localization in A549 cells. As shown in Fig. 6b, cathepsin B was restricted in the lysosomes without Py-Tyr treatment. Upon the treatment with Py-Tyr for 24 h, decreased intensity of LysoTrakcer implied the lysosome damages induced by Py-Tyr. Cathepsin B staining revealed non-specific localization in the lysosome of cathepsin B. Increasing fluorescence intensity of cathepsin B in the cytoplasm could also be observed, indicating the leakage of cathepsin B from lysosomes into the cytoplasm. Flow cytometry results (Fig. 6c) also confirmed the induction of cell apoptosis after Py-Tyr treatment.The apoptosis mechanism was further investigated by qRT-PCR. A549 cells were treated with Py-Tyr for 6, 12 and 24 h and then the RNA expressions of apoptosis executors (Caspase-8 and Caspase-3) and regulator genes (Bcl2 and Bax) were quantified. As shown in Fig. 6d, the RNA expression of the up-stream apoptosis gene Caspase-8, as the initiator of lysosome-associated cell death,28 and the down-stream apoptosis gene Caspase-3 genes was significantly upregulated upon Py-Tyr treatment, while Caspase-3 exhibited a higher level of elevation of expression than Caspase-8. After 24 h's treatment with Py-Tyr, the expression of regulator Bax gene was also elevated, while the oncosuppressor gene Bcl2 exhibited downregulation, suggesting a promoting effect on the induced apoptosis. Overall, these results demonstrated that Py-Tyr induced lysosome rupture, eventually activating cancer cell apoptosis.
Conclusions
In summary, this study introduces pyrene-capped tyrosine (Py-Tyr) as a proof-of-concept molecule in navigating amino acid-based self-assembly for LMP induction and lysosome-targeted cancer therapy. Py-Tyr exhibited pH-dependent self-assembling behavior. Under physiological pH, Py-Tyr self-assembled into nanoparticles; under acid milieu, Py-Tyr was protonated with reduced charge repulsion and these assemblies conglomerated to form micrometer-scaled aggregates. This controlled assembly process, responding specifically to lysosomal acidity, ensured enhanced targeting toward lysosome and effective LMP. Cell experiments results suggested that Py-Tyr specifically accumulated in lysosome and caused lysosome rupture, releasing lysosomal contents such as cathepsin B into the cytoplasm. The leakage of cathepsin B eventually activated cell apoptosis, underscoring the therapeutic efficacy of Py-Tyr in lysosome-targeted cancer therapy. This study demonstrates amino acid-based self-assembly as a unique and versatile platform for inducing LMP. Further investigations on the screening of amino acids will gain values in realizing its full therapeutic impact.Materials and methods
Chemicals and instructments
All the solvents and chemicals were commercially available and used as received without further purification. Human lung cancer cell line A549, human liver cancer cell line HepG2, human osteosarcoma cell line Saos2 were purchased from the American Type Culture Collection (ATCC). Dulbecco's modified Eagle medium (DMEM), fetal bovine serum (FBS), and penicillin-streptomycin liquid (100×) were purchased from Gibco (American). Cell Counting Kit-8 (CCK-8) was purchased from Boster Biological Technology Co., Ltd (American). Lysosome-specific staining dyes Lyso-Tracker Red DND-99 and Lyso-Tracker Green DND-26 were purchased from Thermofisher. Cathepsin B Assay Kit (Magic Red) was purchased from Abcam. FTIC-Annexin V/PI Cell apoptosis detection kit was purchased from UElandy.Mass spectrum was measured by Agilent-6125B mass spectrometer (ESI). 1H spectrum was acquired on a 400 MHz JEOL spectrometer. The 1H NMR chemical shifts (δ) are given in parts per million referring to internal standard tetramethylsilane (TMS). UV-vis spectra were measured on an Ultraviolet-visible Spectrophotometer (YOKE L6). The fluorescence emission spectra were measured on a fluorescence spectrometer (HIACHI F-4700). TEM images were obtained using a Talos L120C transmission electron microscope. The DLS data were obtained using an Anton Paar Litesizer 500, and analysed through OriginPro 2021 Software Student Version (Originlab, Northampton, MA, USA). Fluorescent images were acquired using an LSM FV3000 confocal laser scanning microscope (Olympus, Japan). Cells were analyzed on a Fortessa flow cytometer (BD Biosciences) or on an Aurora spectral cytometer (Cytek). Data were analysed with FlowJo software (Tree Star). qRT-PCR was performed on a QuantGene 9600 real-time PCR (Bioer, Hangzhou, China).
Synthesis of Py-Tyr
Py-Tyr was synthesized by solid phase synthesis on 2-chlorotritylchloride resin (Scheme S1†). Yield 79.8%. ESI-MS (m/z) calcd. for C29H25NO4, 451.1784, found [M − H]− 450.1161, [M − 2H]2− 248.9437, and [2M − H]− 901.2345. 1H NMR (400 MHz, methanol-d4) δ 8.25 (d, J = 9.3 Hz, 1H), 8.14 (t, J = 6.8 Hz, 2H), 8.11–8.06 (m, 2H), 8.03–7.99 (m, 2H), 7.95 (t, J = 7.7 Hz, 1H), 7.79 (d, J = 7.8 Hz, 1H), 7.09–7.02 (m, 2H), 6.64 (d, J = 8.5 Hz, 2H), 4.60 (dd, J = 8.9, 4.8 Hz, 1H), 3.27–3.17 (m, 2H), 3.13 (dd, J = 14.0, 4.8 Hz, 1H), 2.92–2.78 (m, 1H), 2.31 (td, J = 7.1, 2.0 Hz, 2H), 2.15–1.92 (m, 2H).UV-vis absorption and fluorescence emission spectroscopy
A stock solution of 20 mM Py-Tyr in DMSO was prepared. Prior to the spectral measurement, citrate-phosphate buffer was prepared at different pH values ranging from 4.0 to 8.0. Py-Tyr was diluted in citrate-phosphate buffer under different pH values and placed in a quartz cuvette with 1.0 cm path length. UV-vis absorption was measured using a YOKE L6 spectrophotometer. Emission spectra were collected with excitation wavelength of 342 nm. Acquisition settings of 1 nm step size, 0.1 s integration time, and a 350–550 nm scan range were used. The background signal was recorded from blank quartz cuvette and subtracted to obtain each spectrum.Geometric optimization
The molecular geometry of Py-Tyr was optimized using density functional theory (DFT) calculations. The calculation was performed with the GAUSSIAN-09 software package (Gaussian, Inc.), utilizing the B3LYP function.Dynamic light scattering measurements
Prior to DLS measurement, citrate-phosphate buffer was prepared at different pH values ranging from 4.0 to 8.0. Py-Tyr was added to the buffer at a concentration of 100 μM at each pH and placed in standard test tubes. The DLS data and zeta-potentials were recorded.Transmission electron microscopy
A drop of 5 μL Py-Tyr sample was added on the discharged copper grids coated with thin carbon film for about 60 s. After removing the excess solution with filter paper, the grids were washed with pure water and stained with 1% uranyl acetate for 30 s. The grid was allowed to dry at room temperature and ready for TEM imaging.Cell culture
HepG2 cells were cultured in ATCC-formulated Eagle's Minimum Essential Medium. Saos2 cells were cultured in ATCC-formulated McCoy's 5a Medium. A549 cells were cultured in ATCC-formulated F-12K Medium. All cells were supplemented with 10% fetal bovine serum (FBS) and 1% penicillin–streptomycin, under a temperature condition of 37 °C. The culture medium is replaced every two days. Cells were maintained in a fully humidified incubator containing 5% CO2 at 37 °C.Cell staining
The co-localization of Py-Tyr and lysosomes was achieved using confocal laser scanning microscopy. A549 cells were cultured in confocal culture dishes for 24 hours. After the treatment with Py-Tyr for 1, 2, 4, 12 and 24 hours, cells were co-stained with Lysotracker to visualize the lysosomes. After staining, the cells were imaged using confocal laser scanning microscopy. Cathepsin B activity was observed using the Magic Red cathepsin B detection kit. Initially, A549 cells were treated with 70 μM Py-Tyr for 24 h and co-stained with Magic Red Cathepsin B. Lysosomes were also stained with LysoTracker® Green DND-26 to visualize the localization of cathepsin B. λex: 405 nm, λem: 410−450 nm for Py-Tyr, λex: 561 nm, λem: 570−610 nm for LysoTracker® Red DND-99, and λex: 488 nm, λem: 490−530 nm for LysoTracker® Green DND-26, λex: 561 nm, λem: 580−640 nm for cathepsin B, respectively.Flow cytometry
The apoptosis of A549 cells after Py-Tyr treatment was determined using flow cytometry with the FITC-Annexin V/PI cell apoptosis detection kit. A549 cells were treated with Py-Tyr at a concentration of 70 μM for 24 hours. After incubation, the cells were resuspended in 400 μL of 1× Annexin V binding buffer and immediately analysed using flow cytometry. FITC-Annexin V was excited by a 488 nm laser, and the fluorescence emission spectrum was detected at 530 nm (FITC channel), while the PI channel emitted fluorescence at approximately 617 nm. In the scatter plot of the bivariate flow cytometer, the lower left quadrant represents live cells (FITC-Annexin V−/PI−); the lower right quadrant represents early apoptotic cells (FITC-Annexin V+/PI−); the upper right quadrant represents necrotic and late apoptotic cells (FITC-Annexin V+/PI+); and the upper left quadrant represents dead cells with disrupted membranes (FITC-Annexin V−/PI+).qRT-PCR
A549 cells were seeded in a 6-well plate at a density of 2 × 10⁵ cells per well. The cells were allowed to adhere by incubating at 37 °C with 5% CO2 for 12 h. After the incubation with 70 μM Py-Tyr for 6, 12, and 24 h, cells were harvested and total RNA was extracted using an RNA Purification Kit (SparkJade, China) following the manufacture's instruction. cDNA was obtained from 500 ng of total RNA using the Reverse Transcription Kit (SparkJade). qRT-PCR was performed using SYBR Green qPCR Master Mix (SparkJade). A two-step method is then used to complete the PCR cycle: Initial denaturation at 94 °C for 2–3 minutes; denaturation at 94 °C for 5–10 seconds; annealing at 55–60 °C for 10–20 seconds; extension at 72 °C for 20–30 seconds. Relative gene expression was calculated using the 2 − ΔΔCT method, and β-actin was used as a reference for normalization. The primers were purchased from BioTNT, and primer sequences for Caspase-3, Caspase-8, Bcl2, Bax and β-actin were used as follows:Caspase-3: 5′-GGAAGCGAATCAATGGACTCTGG-3′(F), 5′-GCATCGACATCTGTACCAGACC-3′(R);
Caspase-8: 5′-TTTCTGCCTACAGGGTCATGC-3′(F), 5′-TGTCCAACTTTCCTTCTCCCA-3′(R);
Bcl2: 5′-ATCGCCCTGTGGATGACTGAGT-3′(F), 5′-GCCAGGAGAAATCAAACAGAGGC-3′(R);
Bax: 5′-TCAGGATGCGTCCACCAAGAAG-3′(F), 5′-TGTGTCCACGGCGGCAATCATC-3′(R);
β-Actin: 5′-CACCATTGGCAATGAGCGGTTC-3′(F), 5′-AGGTCTTTGCGGATGTCCACGT-3′(R)
Statical analysis
The results are presented as mean and standard deviation, and were obtained from 3–6 independent experiments. Statistical analysis of the data was performed using GraphPad Prism software. When p > 0.05, differences were considered non-significant (ns); when p < 0.05, differences were considered to be significant (*p < 0.05, **p < 0.01, ***p < 0.001, ****p < 0.0001, respectively).Conflicts of interest
There are no conflicts to declare.Acknowledgements
This research was funded by the “Yong Talent Support Plan” of Xi'an Jiaotong University (No. YX6J024).References
- T. Tang, Z.-y. Yang, D. Wang, X.-y. Yang, J. Wang, L. Li, Q. Wen, L. Gao, X.-w. Bian and S.-c. Yu, Cell Biosci., 2020, 10, 131 CrossRef PubMed.
- S. R. Bonam, F. Wang and S. Muller, Nat. Rev. Drug Discov., 2019, 18(12), 923–948 CrossRef CAS PubMed.
- W. Trybus, E. Trybus and T. Król, Int. J. Mol. Sci., 2023, 24(3), 2176 CrossRef CAS PubMed.
- M. Cao, X. Luo, K. Wu and X. He, Signal Transduct. Targeted Ther., 2021, 6(1), 379 CrossRef CAS PubMed.
- M. Borkowska, M. Siek, D. V. Kolygina, Y. I. Sobolev, S. Lach, S. Kumar, Y.-K. Cho, K. Kandere-Grzybowska and B. A. Grzybowski, Nat. Nanotechnol., 2020, 15(4), 331–341 CrossRef CAS PubMed.
- C. A. F. Oliveira, L. Ivanova, A. Solhaug and C. K. Fæste, Mycotoxin Res., 2020, 36(1), 23–30 CrossRef CAS PubMed.
- N. J. Sinha, M. G. Langenstein, D. J. Pochan, C. J. Kloxin and J. G. Saven, Chem. Rev., 2021, 121(22), 13915–13935 CrossRef CAS PubMed.
- J. S. Li, K. Shi, Z. F. Sabet, W. Fu, H. Zhou, S. Xu, T. Liu, M. You, M. Cao, M. Xu, X. Cui, B. Hu, Y. Liu and C. Chen, Sci. Adv., 2019, 5(9), eaax0937 CrossRef CAS PubMed.
- G. Li, X. Hu, P. Nie, D. Mang, S. Jiao, S. Zhang, S. R. Roy, S. Yukawa, S. Asahina, H. Sugasawa, W. Cortes, Z. Zhou and Y. Zhang, Nano Lett., 2021, 21(1), 747–755 CrossRef CAS PubMed.
- J. Song, Q. Zhang, G. Li and Y. Zhang, Langmuir, 2022, 38(29), 8733–8747 CrossRef CAS PubMed.
- G. Li, X. Hu, X. Wu and Y. Zhang, Nano Lett., 2021, 21(7), 3052–3059 CrossRef CAS PubMed.
- M. T. Jeena, L. Palanikumar, E. M. Go, I. Kim, M. G. Kang, S. Lee, S. Park, H. Choi, C. Kim, S.-M. Jin, S. C. Bae, H. W. Rhee, E. Lee, S. K. Kwak and J.-H. Ryu, Nat. Commun., 2017, 8(1), 26 CrossRef CAS PubMed.
- B. Jana, S. Jin, E. M. Go, Y. Cho, D. Kim, S. Kim, S. K. Kwak and J.-H. Ryu, J. Am. Chem. Soc., 2023, 145(33), 18414–18431 CrossRef CAS PubMed.
- D. Kim, S. Kim, G. Park, H. Choi and J.-H. Ryu, JACS Au, 2022, 2(11), 2539–2547 CrossRef CAS PubMed.
- J. Wang, L. Hu, H. Zhang, Y. Fang, T. Wang and H. Wang, Adv. Mater., 2022, 34(1), 2104704 CrossRef CAS PubMed.
- C. Wu, C. Wang, T. Zhang, G. Gao, M. Wei, Y. Chen, X. Li, F. Wang and G. Liang, Adv. Healthcare Mater., 2022, 11(1), 2101346 CrossRef CAS PubMed.
- S. J. Bird and J. B. Lloyd, Cell Biochem. Funct., 1995, 13(2), 79–83 CrossRef CAS PubMed.
- C. Ménard-Moyon, V. Venkatesh, K. V. Krishna, F. Bonachera, S. Verma and A. Bianco, Chem.–Eur. J., 2015, 21(33), 11681–11686 CrossRef PubMed.
- D. Zaguri, T. Kreiser, S. Shaham-Niv and E. Gazit, Molecules, 2018, 23(6), 1273 CrossRef PubMed.
- C. Tang, A. M. Smith, R. F. Collins, R. V. Ulijn and A. Saiani, Langmuir, 2009, 25(16), 9447–9453 CrossRef CAS PubMed.
- J. Wang, Q. Dang, Y. Gong, Q. Liao, G. Song, Q. Li and Z. Li, CCS Chem., 2021, 3(12), 274–286 CrossRef CAS.
- M. J. Frisch, G. W. Trucks, H. B. Schlegel, G. E. Scuseria, M. A. Robb, J. R. Cheeseman, G. Scalmani, V. Barone, B. Men-nucci, G. A. Petersson, H. Nakatsuji, M. Caricato, X. Li, H. P. Hratchian, A. F. Izmaylov, J. Bloino, G. Zheng, J. L. Sonnen-berg, M. Hada, M. Ehara, K. Toyota, R. Fukuda, J. Hasega-wa, M. Ishida, T. Nakajima, Y. Honda, O. Kitao, H. Nakai, T. Vreven, J. A. Montgomery Jr, J. E. Peralta, F. Ogliaro, M. Bearpark, J. J. Heyd, E. Brothers, K. N. Kudin, V. N. Staroverov, T. Keith, R. Kobayashi, J. Normand, K. Raghavachari, A. Rendell, J. C. Burant, S. S. Iyengar, J. To-masi, M. Cossi, N. Rega, J. M. Millam, M. Klene, J. E. Knox, J. B. Cross, V. Bakken, C. Adamo, J. Jaramillo, R. Gomperts, R. E. Stratmann, O. Yazyev, A. J. Austin, R. Cammi, C. Pomelli, J. W. Ochterski, R. L. Martin, K. Morokuma, V. G. Zakrzewski, G. A. Voth, P. Salvador, J. J. Dannenberg, S. Dapprich, A. D. Daniels, O. Farkas, J. B. Foresman, J. V. Ortiz, J. Cioslowski and D. J. Fox, Gaussian., 2013 Search PubMed.
- J. J. Rennick, A. P. R. Johnston and R. G. Parton, Nat. Nanotechnol., 2021, 16, 266 CrossRef CAS PubMed.
- M. S. de Almeida, E. Susnik, B. Drasler, P. Taladriz-Blanco, A. Petri-Fink and B. Rothen-Rutishauser, Chem. Soc. Rev., 2021, 50, 5397 RSC.
- M. Okada, A. Matsuzawa, A. Yoshimura and H. Ichijo, J. Biol. Chem., 2014, 289(47), 32926–32936 CrossRef CAS PubMed.
- S. Aits and M. Jäättelä, J. Cell Sci., 2013, 126(9), 1905–1912 CrossRef CAS PubMed.
- Z. Xie, M. Zhao, C. Yan, W. Kong, F. Lan, Narengaowa, S. Zhao, Q. Yang, Z. Bai, H. Qing and J. Ni, Cell Death Dis., 2023, 14(4), 255 CrossRef PubMed.
- B. Zhong, M. Liu, C. Bai, Y. Ruan, Y. Wang, L. Qiu, Y. Hong, X. Wang, L. Li and B. Li, Mol. Ther., 2020, 28(4), 1078–1091 CrossRef CAS PubMed.
Footnote |
| † Electronic supplementary information (ESI) available. See DOI: https://doi.org/10.1039/d4ra01328j |
| This journal is © The Royal Society of Chemistry 2024 |


