
 Open Access Article
 This Open Access Article is licensed under a Creative Commons Attribution-Non Commercial 3.0 Unported Licence
Facilitation of coke gasification by coking wastewater and its degradation properties in thermochemical reactions
Yang Geng *a,
Haobin Hua,
Yun Wua,
Zhijun Lia,
Yani Lua,
Penghui Zhanga and
Jinfeng Baib
*a,
Haobin Hua,
Yun Wua,
Zhijun Lia,
Yani Lua,
Penghui Zhanga and
Jinfeng Baib
aGansu Key Laboratory of Efficient Utilization of Oil, Gas Resources in Longdong, College of Petroleum and Chemical Engineering, Longdong University, Qingyang 745000, Gansu, China. E-mail: ldxy_gy666@163.com
bResearch Center of Coal Chemical Engineering Liaoning, School of Chemical Engineering, University of Science and Technology Liaoning, Anshan 114051, Liaoning, China
First published on 3rd June 2024
Abstract
The thermochemical reaction between coking wastewater and gasification-coke is a new way to achieve efficient and clean use of coal and solve the problem of coking wastewater treatment in the Gansu Longdong region. To further investigate the thermochemical reaction characteristics of coking wastewater and gasification-coke, this paper explores the effect of coking wastewater on syngas production from coke gasification at 1000 °C, the degradation effect of organic pollutants in coking wastewater, the thermochemical reactivity of gasification-coke, and the reasons why wastewater promotes coke gasification and wastewater degradation. The results showed that the thermochemical reaction of coking wastewater with gasification-coke not only facilitates the improvement of syngas yield and low-level calorific value but also improves the thermochemical reactivity of gasification-coke. Notably, phenol in coking wastewater plays a major role in promoting the gasification of gasification-coke. During the thermochemical reaction, the organic pollutants in the wastewater were effectively degraded, the degradation rate of CODCr reached more than 85%, and the degradation of organic pollutants reached more than 75%. Phenol water and coking wastewater can not only improve the dispersion of the ash phase on the surface of gasification-coke, effectively inhibiting the sintering and agglomeration of the ash phase in gasification-coke, but also change the type and number of organic functional groups in gasification-coke. Therefore, coking wastewater can promote the gasification of coke. The thermochemical reaction between coke wastewater and gasification-coke can simultaneously promote coke gasification and the degradation of coke wastewater and achieve the resourceful use of coke wastewater.
1. Introduction
The Longdong Coalfield in Gansu, China, located in the southwest Ordos Basin, is rich in fossil energy reserves. It is predicted to have coal reserves of up to 236 billion tons, predicted reserves of 136 million cubic meters of coalbed methane, and estimated oil reserves of 4 billion tons.1 The coal reserves of the Longdong Coalfield account for more than 90% of the coal reserves in Gansu Province, making it an indispensable energy pillar of the province and an important energy base in China.2 The majority of coals mined in the Longdong Coalfield are long-flame, weakly viscous, and non-viscous coals, along with lignite coals.3 These coals are characterized by high calorific values, low to medium ash content, and low to medium sulfur content. However, their current utilization is mainly limited to power generation or other inefficient utilization. Conventional coal-based technologies emit substantial amounts of greenhouse gases (CO2), pollutant gases (NOx and SOx), and toxic trace and heavy metals, raising various concerns.4,5 These issues mainly include issues related to ash disposal and utilization, global warming, acid rain, and health distress, necessitating an alternative method that can meet the energy demand via low-grade coal utilization while mitigating the aforementioned concerns.6,7 Among the various coal conversion processes for power generation and other applications, gasification technology has garnered significant attention due to its versatility and environmental advantages over conventional processes.8,9 Compared to traditional sources such as oil and natural gas, syngas obtained through coal coke gasification is an attractive option for chemical synthesis and the application of clean, high-value-added technologies such as hydrogen energy technology development.10However, the production of chemical products results in the discharge of a substantial amount of wastewater, a quantity that surges annually.11,12 Consequently, this has caused widespread concern in Northwest China, where water resources are relatively scarce.13 Coking wastewater is one of the most challenging wastewaters in the industry because of its complex composition and abundance of refractory organic matter, which includes phenols, polycyclic aromatic hydrocarbons, and cyanide.14,15 These substances are highly toxic to most microorganisms, especially those with volatile phenol contents ranging from 700 mg L−1 to 3000 mg L−1 and CODCr values ranging between 1200 mg L−1 and 8500 mg L−1.16 Because of the high pollution potential of coking wastewater, its improper disposal leads to severe environmental pollution and threatens human health and sustainable social development. The current treatment method for coking wastewater involves a combination of biological denitrification, chemical oxidation, adsorption, and coagulation methods.17–20 However, these approaches entail several issues, including overloading wastewater treatment equipment, high chemical oxygen demand (COD) and ammonia nitrogen (NH3–N) after treatment, intensive investment, large space for denitrification units, and high operational costs. It is expected that the cost of coking wastewater treatment will increase further as environmental protection awareness continues to grow along with the enforcement of stringent regulations for wastewater emissions.21,22 Therefore, the coal chemical industry has been exploring an environmentally friendly and economical process, the thermochemical reaction of hot coke and coking wastewater, in which the heat of hot coke is effectively utilized while simultaneously treating coking wastewater. The syngas produced can be processed into high-value-added chemical products. This process involves upgrading and modifying existing equipment so that the investment cost is not high and the system will not occupy a large land area. Moreover, the Longdong Coalfield has abundant coal reserves, which can not only give full play to geographical advantages and reduce transport costs but also make full use of the economic value contained in the raw coal, reduce costs and increase efficiency. It can also treat coal chemical wastewater. This process is considered a promising technology because of the resource utilization and high energy efficiency of wastewater.23 This promising technology offers significant economic and environmental advantages for the clean and efficient utilization of coal in Longdong while ensuring the resource utilization of coking wastewater.
Thus far, researchers generally acknowledge that the key factors affecting gasification are the gasification conditions, physical and chemical properties of the raw materials, and structure.24–28 Nevertheless, there has been a lack of systematic and comprehensive studies on the thermochemical reactions between coking wastewater and coke. Considering the good application prospects of this process technology, the study of the thermochemical reaction between coking wastewater and coke holds particular significance. It could be a new direction in the study of coal-coke gasification. The thermochemical reaction between coking wastewater and coke is very complex, and no clear mechanism exists. To facilitate this study, the thermochemical reaction between coking wastewater and coke can be regarded as the gasification reaction between water vapor and coke and the thermal decomposition of organic pollutants in water. Geng et al.23 used simulated wastewater to study the thermochemical reaction of gasification-coke and found that the simulated wastewater causes greater damage to the surface morphology of coke and that the simulated wastewater promotes the gasification of coke rather than its own thermal decomposition. Liu et al.29 analyzed the evolution of coke pore structure during the reaction using an N2 adsorption instrument and computed tomography, revealing the interaction between the microscopic carbon chemical structure in coke and minerals during the gasification reaction process. Gao et al.30 reported that the formation of a eutectic mixture, such as Na2Ca(CO3)2, can improve gasification reactivity by inhibiting the aggregation of the ash phase, as confirmed by scanning electron microscopy (SEM). Given the discussion above, this study aims to explore the characteristics of the thermochemical reaction of coking wastewater with coke. This study analyzed the impact of coking wastewater on the volume, composition, yield, calorific value, carbon conversion, and reactivity of coke gasification products. Furthermore, the degradation characteristics of coke wastewater during the reaction process and the impact of coke wastewater on the structure and ash phase of coke were analyzed through gas chromatography (GC), gas chromatography-mass spectrometry (GC-MS), scanning electron microscopy-energy-dispersive X-ray (SEM-EDX), and Fourier transform infrared (FTIR) analyses. The obtained results provide basic data and a theoretical basis for the process's rational design and stable operation.
2. Materials and methods
2.1. Collection and preparation of experimental materials
This study used two coals largely produced in the Longdong region, namely, long-flame coal (QYC) and gas coal (CYC). The following method was used to process QYC and CYC into gasification coke (QYGC and CYGC). Here, the moisture content of QYC and CYC was controlled at 10%. The experimental coke oven was ramped from 25 °C to 1000 °C at a heating rate of 0.5 °C min−1. Heating was continued for another 30 min once the central temperature of the coke cake reached 950 °C. Table 1 presents the proximate and ultimate analyses of the coal coke samples. Table 2 lists the chemical composition of the coke ash.| Sample | Proximate analysis (wt%, d) | Ultimate analysis (wt%, daf) | ||||||
|---|---|---|---|---|---|---|---|---|
| A | V | FC | C | H | O* | N | S | |
| a A: ash; V: volatile matter; FC: fixed carbon; d: dry basis; daf: dry ash-free basis; *: by difference. | ||||||||
| QYC | 8.17 | 39.67 | 52.16 | 75.88 | 4.87 | 17.62 | 0.91 | 0.72 |
| QYGC | 10.90 | 1.79 | 87.31 | 96.70 | 0.25 | 1.98 | 0.53 | 0.54 |
| CYC | 8.48 | 35.11 | 56.41 | 79.85 | 4.95 | 12.95 | 1.45 | 0.80 |
| CYGC | 12.39 | 1.86 | 85.75 | 97.18 | 0.29 | 1.11 | 0.76 | 0.66 |
| SiO2 | Al2O3 | Fe2O3 | CaO | MgO | SO3 | K2O | Na2O | Other | |
|---|---|---|---|---|---|---|---|---|---|
| QYC | 30.64 | 21.01 | 18.61 | 8.96 | 3.40 | 9.93 | 0.62 | 4.37 | 2.46 |
| CYC | 38.53 | 28.39 | 14.58 | 5.24 | 1.76 | 5.88 | 1.08 | 1.31 | 3.23 |
The coking wastewater used in the experiment was obtained from a coking plant, and its quality analysis is presented in Table 3. As indicated in the table, the phenol content is 1258 mg L−1. Therefore, 1258 mg L−1 of phenol water was prepared for control experiments. In this study, an aqueous solution of phenol was prepared using phenol (AR grade) and pure water.
| pH | COD/(mg L−1) | Ammonia nitrogen/(mg L−1) | Volatile phenol/(mg L−1) | Phenol/(mg L−1) |
|---|---|---|---|---|
| 9.8 | 5988.9 | 4815.4 | 1680.8 | 1258.3 |
2.2. Thermochemical experiments and preparation of char samples
Fig. 1 depicts the schematic of the thermochemical reaction device of coke and phenol aqueous solution. The gasification reaction device of coke and phenol aqueous solution mainly consists of heating equipment, the main reactor, a water pump, a cold trap, a gas–liquid separator, gas purification, and a gas detection system. For each run, 10 g of gasification-coke was placed on a distribution plate under a nitrogen gas (as a sweeping gas) flow of 300 mL min−1. The reactor temperature was controlled through a programmable temperature controller. The N2 flow was stopped when the reaction temperature reached 1000 °C, and different water samples were quantitatively supplied to the reactor using the peristaltic pump. The gaseous products were continuously collected, in turn, in several gas bags. The composition of the syngas in the gasbags was subsequently detected using GC. Following the completion of the reaction, the water sample was immediately cut off, and N2 was passed through it. The reaction residues were then collected for calculation and analysis. Furthermore, the condensates, detected using GC, were collected from the cold trap to determine their composition. In our previous study, we reported elimination conditions for gas external diffusion and certain calculation methods, such as those used for calculating the carbon conversion and low calorific value.23 The carbon conversion rate (X, %) and reaction rate (R, min−1) were calculated according to eqn (1) and (2), respectively.
 | (1) |
 | (2) |
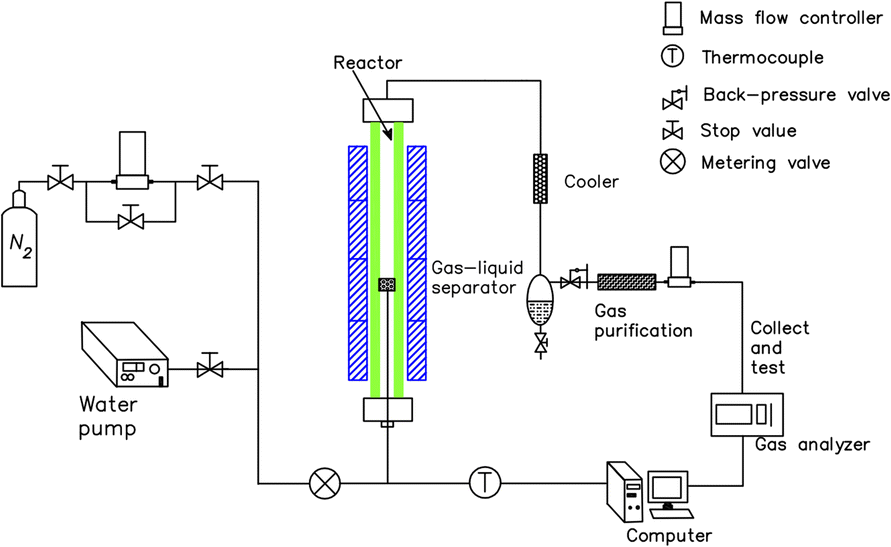 | ||
| Fig. 1 Schematic diagram of the thermochemical reaction device between coke and different water samples. | ||
The optimal conditions for the gasification experiments included a coke particle size of 2–3 mm and a water sample flow rate of 1.5 mL min−1. Notably, all the experimental data had an error of less than 5%. Our previous experimental results demonstrated that almost all the gaseous products produced by the reaction of a phenol aqueous solution with coke are derived from coke gasification. In contrast, the extra carbon introduced by phenol is negligible.31
2.3. Analysis and characterization
The product gas volumetric composition was determined by GC9800 gas chromatography using a thermal conductivity detector (TCD) and a flame ionization detector (FID). The TCD was utilized to measure CO and non-combustible gases (CO2, N2), while the FID was utilized for hydrocarbons (methane), and hydrogen.The main organic components of the coking wastewater were determined using gas chromatography-mass spectrometry (GC-MS). Dichloromethane (5 mL) was added to a 5 mL coking wastewater sample and ultrasonically extracted. Following centrifugation, the organic layer was removed. Then, 5 mL of methylene chloride was added to the remaining aqueous phase, and the extraction step was repeated. The organic layer was removed following centrifugation and mixed with the organic phase from the previous step. The mixed organic phase was subsequently blow-dried with nitrogen, dissolved in 2 mL of n-hexane, filtered through a 0.22 μm membrane, and ultimately analyzed through GC-MS.
The surface morphology of the char samples was characterized using a SIGMA HD field-emission scanning electron microscope. The elemental composition of the microarea of the residual gasification-coke samples was examined using energy-dispersive X-ray spectroscopy (Aztec type, British Oxford Company).
Additionally, analyses were conducted using the FTIR equipment, model INVENIO S, BRUKER OPTIK, to analyze the impact of coking wastewater on the functional groups and inorganic content of coal in thermochemical reactions.
3. Results and discussion
3.1. Effect of coking wastewater on syngas from coke gasification
Herein, the effect of coke wastewater on syngas production from coke gasification was examined at a reaction temperature of 1000 °C. Fig. 2 displays the composition and volume of syngas produced by the thermochemical reaction of gasification-coke (QYGC and CYGC) with pure water, 1258 mg L−1 phenol water, and coke wastewater.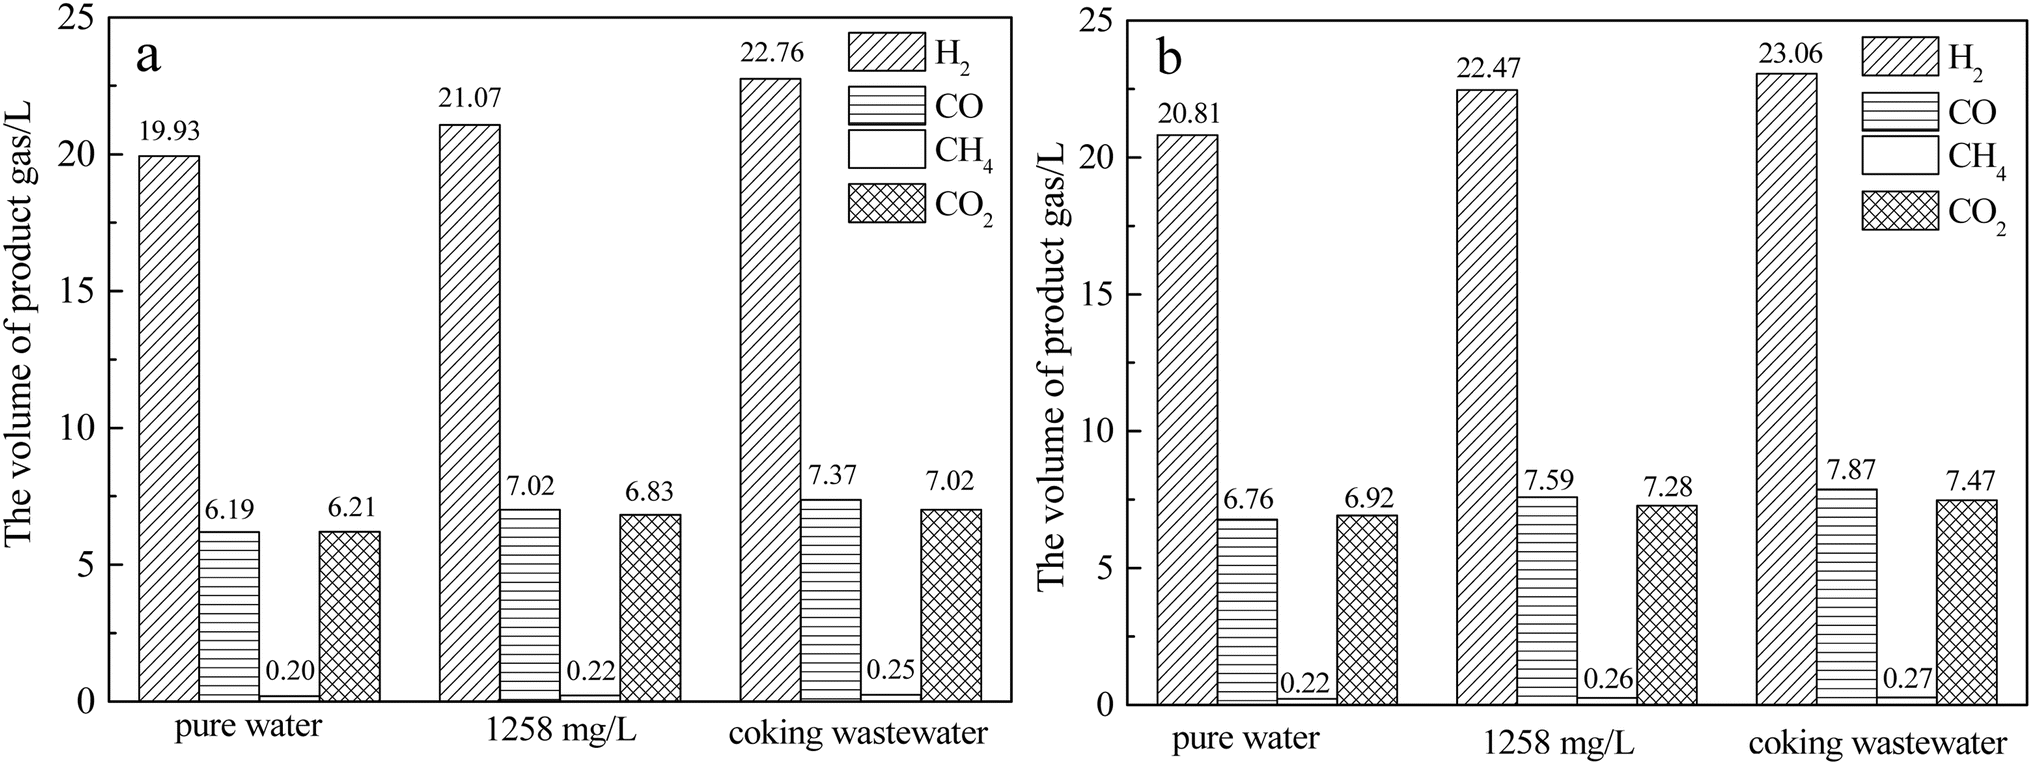 | ||
| Fig. 2 Effect of coking wastewater on syngas from coke gasification. (a) QYGC; (b) CYGC. | ||
As indicated in the figure, the volume of H2 is the largest, and that of CH4 is the smallest. However, the difference in the volumes of CO and CO2 is insignificant. Moreover, CO is slightly more abundant in the reaction of phenol water and coking wastewater with coke. Pure water with QYGC produced only 32.5 L of product gas, and the total volume of product gas generated by the thermochemical reaction of QYGC with 1258 mg L−1 phenol water and coking wastewater was 35.1 L and 37.4 L, which were increased by 2.6 L and 4.9 L, respectively. Using the same comparison method, it can be seen that the total volume of product gas of the reactions of 1258 mg L−1 phenol water and coking wastewater with CYGC increased by 2.9 L and 4 L, respectively. The product gas yields from the reaction of 1258 mg L−1 phenol water and coking wastewater with QYGC were calculated to be 22.7% and 23.7%, respectively, which were 2.1 and 3.1 percentage points greater than the yields from the reaction of pure water with QYGC, respectively. The product gas yields produced by the reaction of 1258 mg L−1 phenol water and coking wastewater with CYGC were 1.8 and 2.6 percentage points greater, respectively, than those of pure water. This indicates that coking wastewater and phenol water can promote the gasification reaction of coke to produce more syngas and increase the yield. Thermochemical analysis revealed that coking wastewater and phenol water may promote reactions (3) and (4). In addition, the promotion effects of phenol water and coking wastewater are basically the same, and it can be inferred that phenol in coking wastewater plays a major role in promoting the coke thermochemical reaction.
| C(s) + H2O(g) = CO + H2, ΔHθ = 131.3kJ mol−1 | (3) |
| CO + H2O(g) = CO2 + H2, ΔHθ = −41.2kJ mol−1 | (4) |
Fig. 3 depicts the volume of flammable gases (mainly H2, CO, and CH4) and the low-level calorific value of syngas produced by the thermochemical reaction of pure water, 1258 mg L−1 phenol water, and coking wastewater, respectively, with gasification-coke.
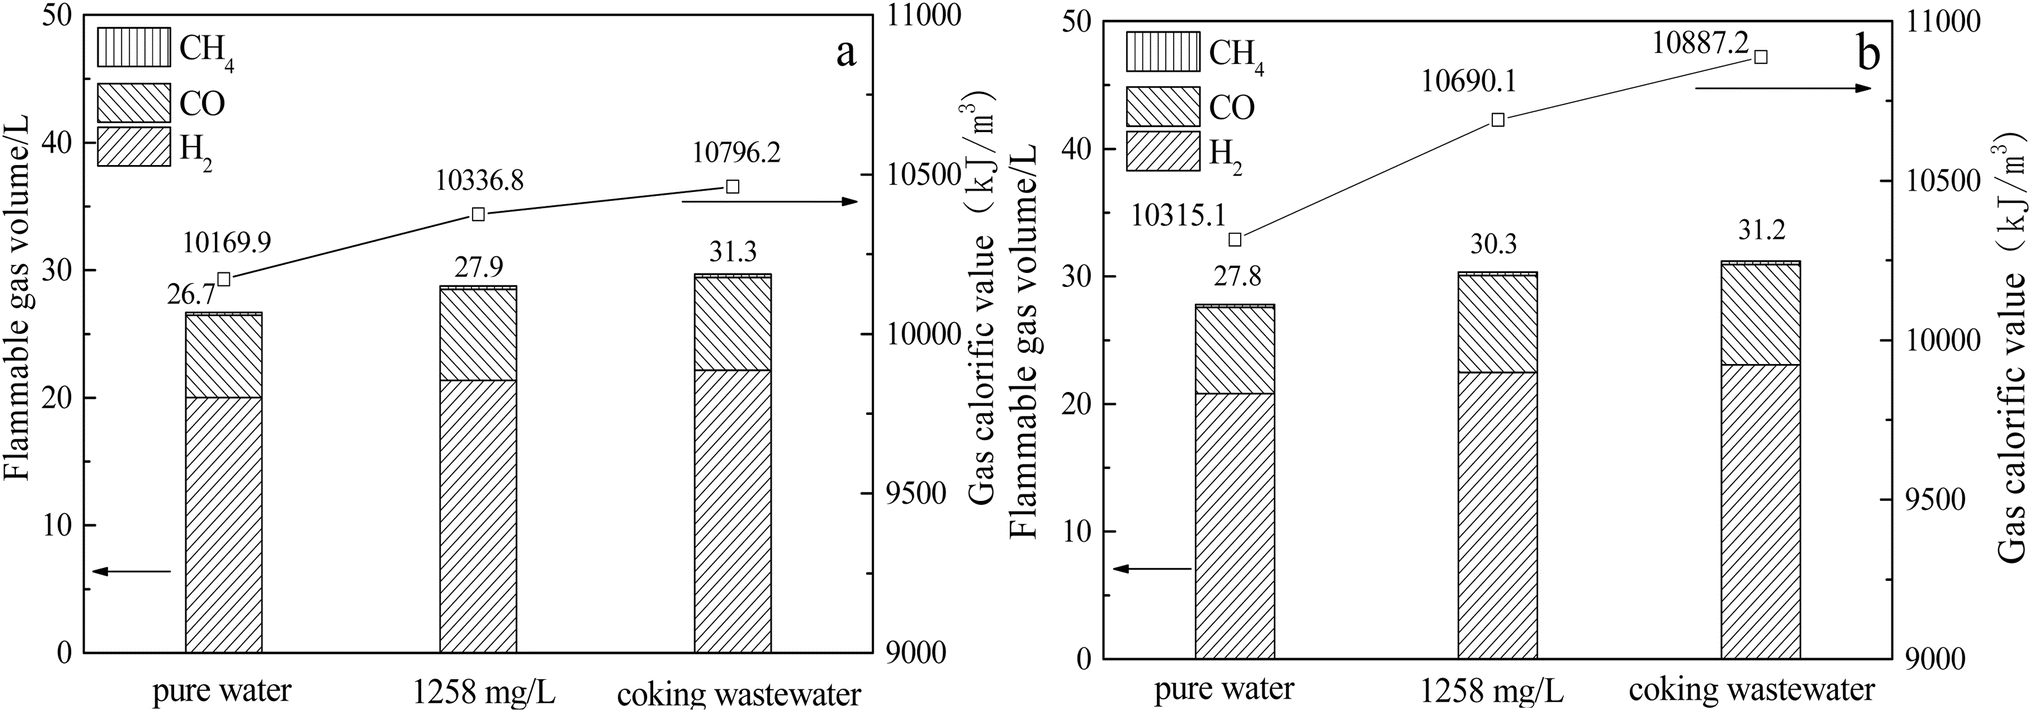 | ||
| Fig. 3 Composition and calorific value of syngas produced by the thermochemical reaction of pure water, 1285 mg L−1 phenol water and coking wastewater with gasification-coke, respectively. (a) QYGC; (b) CYGC. | ||
As observed from the figure, the low-level calorific value of the product gas produced by QYGC with 1258 mg L−1 phenol water and coking wastewater is 1.6% and 6.2% greater than that produced by the reaction of pure water with QYGC, respectively. The low-level calorific value of the product gas produced by CYGC with 1258 mg L−1 phenol water and coking wastewater was 3.6% and 5.5% higher than that produced by the reaction of pure water with CYGC, respectively. This is mainly due to the increase in combustible gases (H2, CO, CH4) in the product gas as a result of the promoting effect of reaction (3). QYGC with 1258 mg L−1 phenol water and coking wastewater produced 7.6% and 15.4% more combustible gases in the product gas, respectively, than pure water. Compared with those in pure water, the flammable gases in the product gases from CYGC with 1258 mg L−1 phenol water and coking wastewater increased by 9.1% and 12.3%, respectively. The above results indicate that the gasification reaction of coking wastewater with coke can not only increase the volume and yield of syngas but also increase the volume of combustible gases in syngas, thus increasing the low-level calorific value of syngas. A control experiment with 1258 mg L−1 phenol water showed that phenol in water can increase the yield of coke gasification product gas as well as the content of combustible gas in the product gas and that phenol in coke wastewater plays a major role in promoting the thermochemical reaction of coke.
3.2. Degradation characteristics of organic pollutants in coking wastewater in thermochemical reactions
It is observed that, compared to the volume of coking wastewater passed before the reaction, the collected post-reaction condensate was reduced by 79.2% and 81.3%, respectively. The degradation characteristics of organic pollutants in coking wastewater in the gasification reaction were examined by examining the water samples before and after the reaction through GC-MS. Table 4 displays the calculated results.| Phenol | 2-Methylphenol | p-Cresol | 2,5-Dimethylphenol | 3,4-Dimethylphenol | 2,3-Dimethylphenol | CODCr | |
|---|---|---|---|---|---|---|---|
| Before reaction | 1258 | 408 | 346 | 108 | 76 | 83 | 5978.9 |
| After reaction with QYGC | 302 | 70 | 42 | — | — | — | 878.4 |
| After reaction with CYGC | 264 | 58 | 31 | — | — | — | 853.9 |
A comparison of the organic content in the condensate after the reaction with that in the coking wastewater before the reaction revealed that the phenol content in the condensate post-reaction decreased by nearly 76% and 79%, respectively. In addition, the 2-methylphenol content in the coking wastewater decreased by 83% and 87%, respectively; the p-cresol content decreased by 88% and 91%, respectively. Nevertheless, no 2,5-dimethylphenol, 3,4-dimethylphenol, or 2,3-dimethylphenol was detected in the post-reaction condensate. Moreover, the CODCr contents of the post-reaction condensate were 878.4 mg L−1 and 853.9 mg L−1, which were reduced by nearly 85% and 86%, respectively. The aforementioned results suggest a significant reduction in the content of organic pollutants in coking wastewater during the thermochemical reaction between coking wastewater and gasification-coke. In particular, phenol and its phenolic compounds were effectively degraded. This is mainly due to the thermal decomposition of organic pollutants in the wastewater during the thermochemical reaction, the destruction of the structure of the pollutants, and the attachment of the decomposed small molecules to the surface of the gasification-coke or their adsorption by the coke.
3.3. Effect of coking wastewater on the thermochemical reactivity of gasification-coke
The impact of coking wastewater on the reactivity of coke gasification was analyzed at a reaction temperature of 1000 °C. Fig. 4 depicts the relationship between the carbon conversion rate and the reaction rate with respect to the reaction time. As presented in Fig. 4, the carbon conversion rate was the highest for coking wastewater. This was followed by 1258 mg L−1 phenol in water, with pure water demonstrating the lowest carbon conversion rate during the thermochemical reaction. The reaction rate initially increased and subsequently decreased. Notably, the maximum value appeared after nearly 20 min of the reaction. Compared with that of pure water, the total carbon conversion of the thermochemical reaction of QYGC with 1258 mg L−1 phenol water and coking wastewater increased by 3.1 and 6.9 percentage points, respectively, and the fastest reaction rate accelerated by 44.7% and 48.8%, respectively; when CYGC reacted, the thermochemical reaction of the total carbon conversion increased by 2.1 and 3.9 percentage points, respectively, and the fastest reaction rate accelerated by 46.5% and 47.6%, respectively. This indicates that the coking wastewater and phenol water facilitated the thermochemical reaction of gasification-coke and greatly improved the total carbon conversion and reaction rate of coke gasification.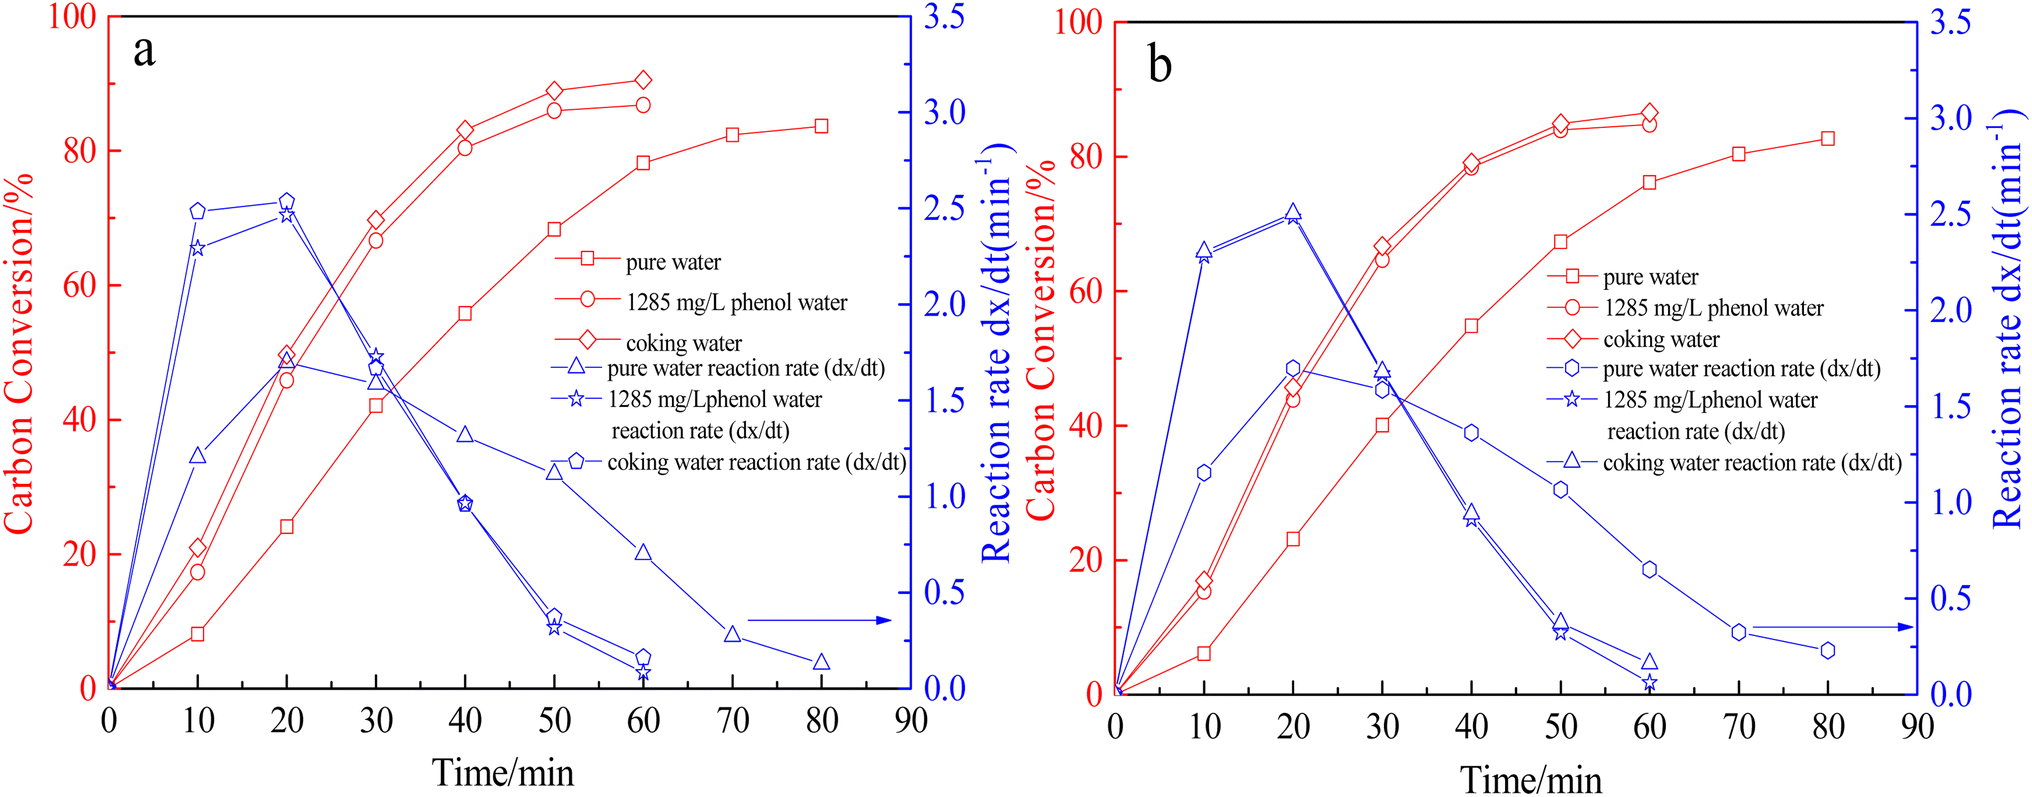 | ||
| Fig. 4 Relationship between carbon conversion and reaction rate of gasification-coke with reaction time. (a) QYGC; (b) CYGC. | ||
In addition, during the thermochemical reaction of coke gasification, the carbon conversion rate and reaction rate of coking wastewater and 1258 mg L−1 phenol water were very small, and the patterns of change were basically the same. From this, it can be inferred that the phenol in the coking wastewater plays a major role in promoting the gasification reaction of coke and is the main promoter.
3.4. Effect of coking wastewater on the surface morphology and ash phase of gasification-coke
Fig. 5 shows the SEM images of the residual coke produced by the thermochemical reaction of pure water, 1258 mg L−1 phenol water, and coking wastewater with gasification coke at a reaction temperature of 1000 °C and a carbon conversion of 50%. The bright granules observed in the SEM image correspond to the ash phase in the char samples. Moreover, as observed in Fig. 5, notable differences are evident in the surface morphologies of the three types of residual coke. The ash phase of the residual coke that reacted with pure water had a lamellar structure, displaying a rough and uneven surface. Certain ash phases covered or wrapped the carbon structure of the coke, leading to sintering and aggregation. This kind of flake structure produces an effect similar to that of “armor,” impacting the entry of water vapor into the pores of the coke for the reaction. Additionally, these ash phases wrap around the carbon structure, impeding the reaction. The residual coke ash phase exhibited a relatively smooth surface following the reaction with coking wastewater and 1258 mg L−1 phenol water, displaying a spherical structure and adhering to the gasification-coke surface. In addition, the dispersion of the ash phase is significantly improved. It can be inferred that the coking wastewater and phenol water can inhibit the sintering and aggregation of the ash phase in the gasification-coke reaction process. Furthermore, it can improve its dispersion on the surface of the gasification coke, allowing it to be trapped in the pore structure of the gasification coke and to be distributed more evenly. Consequently, more water vapor enters the pore structure of the gasification coke rather than being removed, effectively improving the thermochemical reactivity of the gasification coke.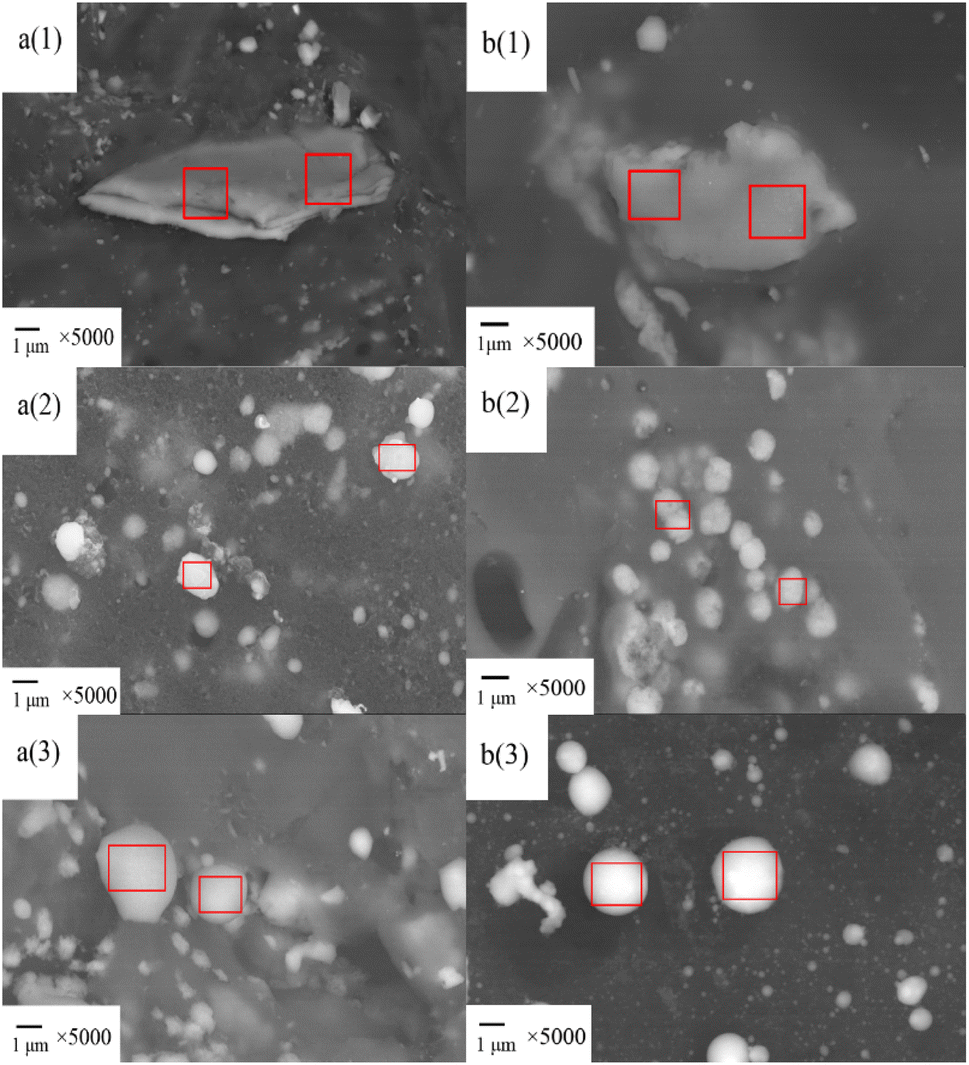 | ||
| Fig. 5 Surface morphology and ash phase of residual coke after reaction of gasification-coke with different water samples. (a) QYGC (b) CYGC (1) pure water (2) 1285 mg L−1 phenol water (3) coking wastewater. | ||
The elemental composition of the ash phase on the residual coke surface was further characterized by EDS, and the results are displayed in Table 5. As noted in Table 5, the elemental composition of the scale-like structure in the ash phase after reacting with pure water is mainly composed of O, Al, Si, and Ca. Notably, the contents of Al and Si are significantly greater than those of phenol water and coking wastewater. The EDS results imply that Al2O3, SiO2, and Ca2Al2SiO7 are likely to appear in the surface ash phase of the pure water-charcoal samples. However, Al2O3 and SiO2 are inert components that inhibit the occurrence of thermochemical reactions. Moreover, Ca2Al2SiO7 in the ash phase lowers the melting point of the ash phase, increasing the susceptibility of the ash phase to sintering and agglomeration. This leads to the formation of a scale-like structure, inhibiting the thermochemical reaction. The elemental composition of the small spherical ash phase, following reaction with phenol water and coking wastewater, mainly includes C and O, with traces of Al, Si, Ca, and Fe. Moreover, the contents of Al2O3, SiO2, and Ca2Al2SiO7, which can lower the ash melting point of the ash phase, are extremely low. Consequently, there is almost no sintering or agglomeration on the surface of the residual coke of the phenol water and coking wastewater, and the ash phase is in the form of uniform small spheres.
| C/% | O/% | Na/% | Mg/% | Al/% | Si/% | S/% | K/% | Ca/% | Fe/% | |
|---|---|---|---|---|---|---|---|---|---|---|
| a (1) | 5.58 | 36.52 | 0.12 | 0.61 | 21.5 | 21.09 | 0.03 | 0.04 | 13.27 | 1.24 |
| b (1) | 5.91 | 32.31 | 0.06 | 0.37 | 22.31 | 24.72 | 0.09 | 0.44 | 12.89 | 0.9 |
| a (2) | 42.46 | 37.63 | 0.15 | 0.53 | 6.11 | 4.16 | 0.07 | 0.05 | 5.88 | 2.96 |
| b (2) | 47.66 | 32.86 | 0.08 | 0.44 | 7.04 | 4.21 | 0.16 | 0.03 | 5.67 | 1.85 |
| a (3) | 45.17 | 37.69 | 0.25 | 1.03 | 3.27 | 5.93 | 0.11 | 0.04 | 3.44 | 3.07 |
| b (3) | 45.52 | 32.67 | 0.13 | 0.55 | 6.62 | 6.19 | 0.06 | 0.13 | 3.95 | 4.18 |
3.5. Effect of coking wastewater on the functional groups of gasification-coke
To analyze the effect of coking wastewater on the functional groups of gasification-coke, pure water, 1285 mg L−1 phenol water, and coking wastewater were thermochemically reacted with gasification-coke. On attaining 50% carbon conversion during the reaction, the residual coke samples were characterized by FTIR spectroscopy, and the results are displayed in Fig. 6.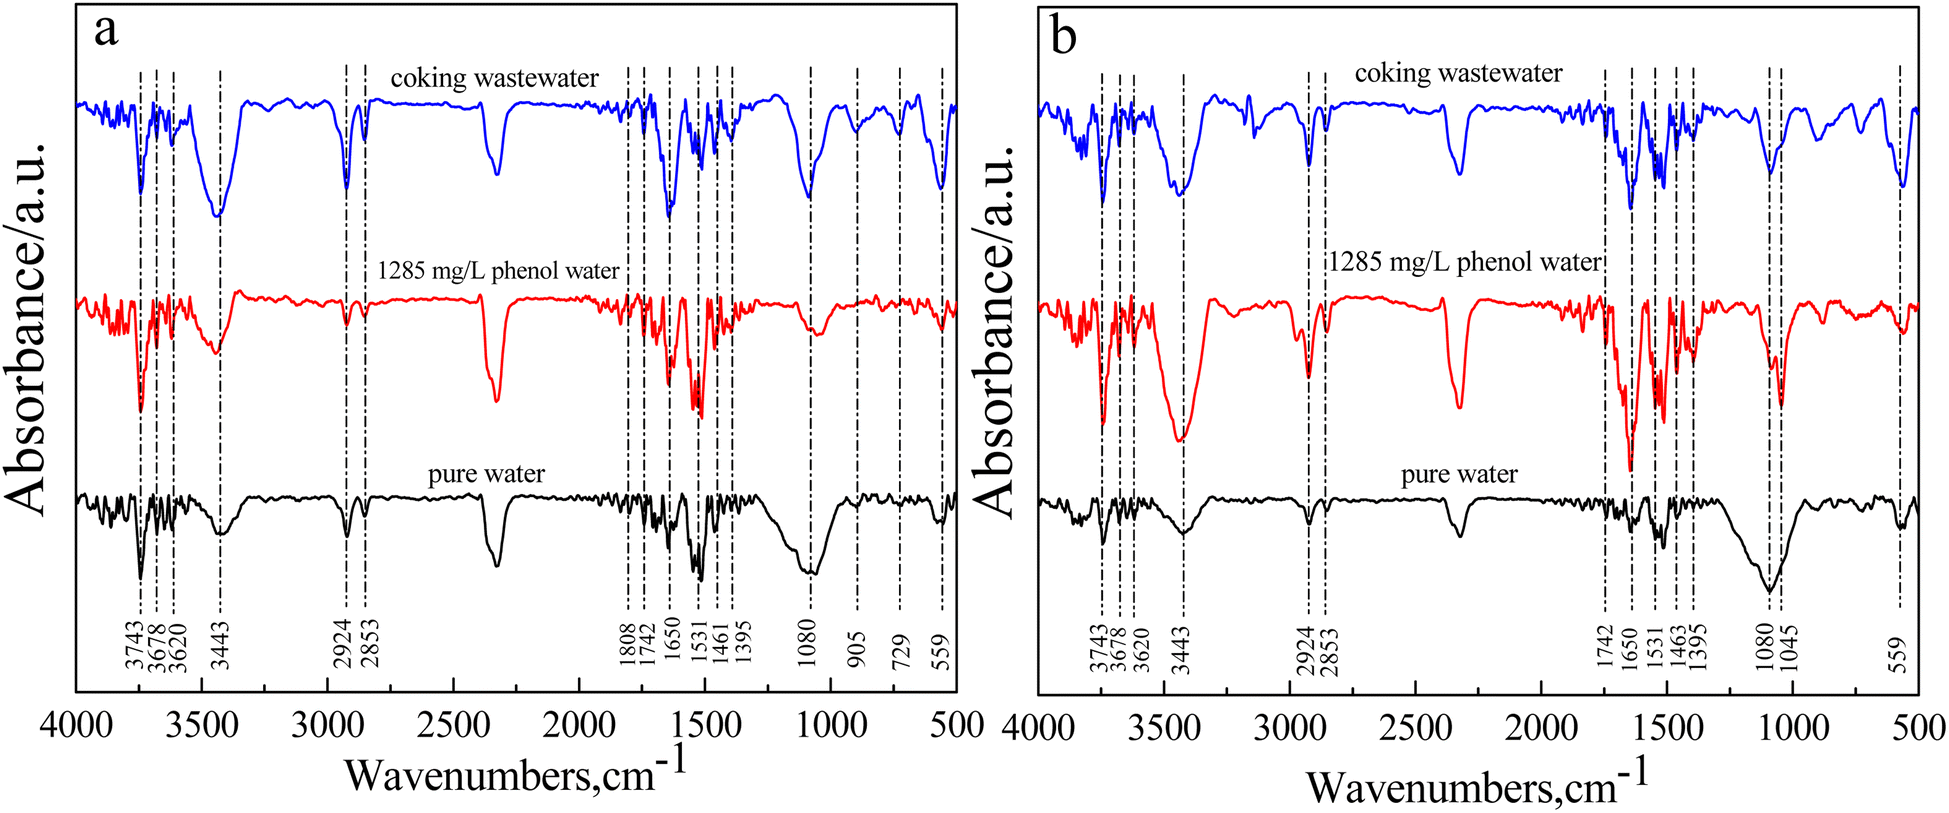 | ||
| Fig. 6 Changes in coke functional groups in thermochemical reactions of gasification-coke with different water samples. (a) QYGC (b) CYGC. | ||
FTIR analyses revealed O–H stretching (alcohol, phenol), C–H stretching of alkanes, CH2 and H–O–H bending of adsorbed water molecules, C–O bonding, carboxylate, and Si–O–(Si) vibrations, which are associated with peaks at 3693–3620 cm−1, 3400 cm−1, 2918 cm−1, 1628–1638 cm−1, 1404 cm−1, and 1040 cm−1, respectively. As depicted in Fig. 6, there is a significant difference in the functional groups of the residual coke produced by the thermochemical reactions of pure water, phenol water, and coking wastewater with gasification-coke. The major difference lies in the intensity and type of absorption peaks of organic functional groups. The absorption peaks observed at 3693–3620 cm−1 represent free OH, which serves as an important indicator for alcohols, phenols, and organic acids. Notably, the intensity of the absorption peak at 3685–3600 cm−1 was weak for the samples that were thermochemically reacted with pure water. Moreover, the intensity of the free OH peaks was strong in the samples that were thermochemically reacted with phenol water and coking wastewater. The absorption peaks near 2935–2915 cm−1 and 2860–2840 cm−1 correspond to the asymmetric stretching vibrations of –CH3 and –CH2 of cycloalkanes or aliphatic hydrocarbons, respectively. Although the intensities of the asymmetric stretching vibrations of –CH3 and –CH2 were weak in the pure water samples, they were stronger in the phenol water and coking wastewater samples. The absorption peaks observed near 1770–1720 cm−1 and 1690–1630 cm−1 represent the carbonyl stretching vibration, the stretching vibration of C![[double bond, length as m-dash]](https://www.rsc.org/images/entities/char_e001.gif) O in quinone, and the –CC vibration in aromatic compounds, respectively. Moreover, the absorption peaks in the vicinity of 1460–1435 cm−1 correspond to the antisymmetric deformation vibration of CH3, which is the characteristic absorption peak of the CH3 group. The absorption peak in the range of 500–810 cm−1 is attributed to the aromatic C–H out-of-plane deformation vibration. Additionally, the characteristic absorption peaks at these sites display the same pattern, indicating that the intensity of the organic functional groups is weaker in the pure water sample. However, the intensity of the organic functional groups is greater in the phenol water and coking wastewater samples. This is because certain organic functional groups and long-chain coke molecules will be broken and decomposed in the thermochemical reaction between pure water and gasification-coke, weakening the corresponding peak intensity of organic functional groups in the residual coke. However, in the thermochemical reaction between phenol water and coking wastewater and gasification-coke, the organic matter in the water will undergo reactions, producing a certain amount of organic groups. These organic groups increase the number of organic groups in the residual coke that reacts with the phenol water. These organic groups increase the number of organic functional groups in the residual coke reacting with phenol water. In the thermochemical reaction, the small molecular groups generated by the thermal decomposition of pollutants are adsorbed by the coke or attached to the surface of the coke, which changes the structure and elemental composition of the ash phase of the coke, thus inhibiting the sintering and agglomeration of the ash phase in the gasification-coke and improving its dispersion on the surface of the gasification-coke.
O in quinone, and the –CC vibration in aromatic compounds, respectively. Moreover, the absorption peaks in the vicinity of 1460–1435 cm−1 correspond to the antisymmetric deformation vibration of CH3, which is the characteristic absorption peak of the CH3 group. The absorption peak in the range of 500–810 cm−1 is attributed to the aromatic C–H out-of-plane deformation vibration. Additionally, the characteristic absorption peaks at these sites display the same pattern, indicating that the intensity of the organic functional groups is weaker in the pure water sample. However, the intensity of the organic functional groups is greater in the phenol water and coking wastewater samples. This is because certain organic functional groups and long-chain coke molecules will be broken and decomposed in the thermochemical reaction between pure water and gasification-coke, weakening the corresponding peak intensity of organic functional groups in the residual coke. However, in the thermochemical reaction between phenol water and coking wastewater and gasification-coke, the organic matter in the water will undergo reactions, producing a certain amount of organic groups. These organic groups increase the number of organic groups in the residual coke that reacts with the phenol water. These organic groups increase the number of organic functional groups in the residual coke reacting with phenol water. In the thermochemical reaction, the small molecular groups generated by the thermal decomposition of pollutants are adsorbed by the coke or attached to the surface of the coke, which changes the structure and elemental composition of the ash phase of the coke, thus inhibiting the sintering and agglomeration of the ash phase in the gasification-coke and improving its dispersion on the surface of the gasification-coke.
4. Conclusions
In conclusion, this study systematically analyzed the thermochemical reaction characteristics of coking wastewater and gasification-coke and the degradation of wastewater and elucidated the reason why phenol in water promotes the thermochemical reaction of gasification-coke. Notably, phenol water and coking wastewater promoted syngas production by the gasification-coking thermochemical reaction. The syngas yields increased by 1.8–3.1%, and the low-level calorific values increased by 1.6–6.2% compared to pure water. In addition, phenol water and coking wastewater were more favorable for the thermochemical reaction of gasification-coke than was pure water. Compared with that of pure water, the total carbon conversion of the thermochemical reaction increased by 3.1–6.9 percentage points, and the fastest reaction rate was accelerated by 44.7–48.8%. The presence of phenols in coking wastewater plays an important role in promoting the thermochemical reaction of gasification-coke. The thermochemical reaction of gasification-coke had a significant degradation effect on the organic pollutants in the coking wastewater, the degradation rate of CODCr was more than 85%, and the degradation rates of phenol, 2-methylphenol and p-cresol were more than 76%, 83% and 88%, respectively. In the thermochemical reaction, the organic pollutants in the wastewater were thermally decomposed into small molecular structures, and the small molecules were adsorbed by the coke or attached to the surface of the coke, which changed the structure and elemental composition of the ash phase of the coke, thus inhibiting the sintering and agglomeration of the ash phase in the gasification-coke and improving the dispersion of the ash phase on the surface of the gasification-coke. This is one of the reasons why coking wastewater promotes the thermochemical reaction of gasification-coke.Author contributions
Yang Geng: conceptualization, methodology, data curation, and writing – original draft; Haobin Hu: supervision, writing – review & editing; Yun Wu: project administration; Zhijun Li: investigation; Yani Lu and Penghui Zhang: supervision and data curation; Jinfeng Bai: visualization and conceptualization.Conflicts of interest
The authors declare that they have no known competing financial interests or personal relationships that could have appeared to influence the work reported in this paper.Acknowledgements
This work was supported by the Long Dong University Doctoral Fund (Grant No. XYBYZK2225, XYBYZK2226 and XYBYZK2101).References
- L. Xue, W. Zhang, Z. Zheng, Z. Liu, S. Meng, H. Li and Y. Du, Measurement and influential factors of the efficiency of coal resources of China's provinces: Based on Bootstrap-DEA and Tobit, Energy, 2021, 221, 119763 CrossRef.
- Y. Shang, S. Lu, X. Li, P. Hei, X. Lei, J. Gong, J. Liu, J. Zhai and H. Wang, Balancing development of major coal bases with available water resources in China through 2020, Appl. Energy, 2016, 194, 735–750 CrossRef.
- Y. Zhao, X. Liu, S. Wang and Y. Ge, Energy relations between China and the countries along the Belt and Road: An analysis of the distribution of energy resources and interdependence relationships, Renew. Sustain. Energy Rev., 2019, 107, 133–144 CrossRef.
- S. Ahmad, Y. Mohammad, A. Noor, S. Rahman, U. Muhammad, V. Bamidele and A. Bawadi, Hydrogen-rich syngas production from bi-reforming of greenhouse gases over zirconia modified Ni/MgO catalyst, Int. J. Energy Res., 2022, 46, 2529–2545 CrossRef.
- A. Patrick, A. Khalifa and A. Saleh, Influence of phase change materials on thermal comfort, greenhouse gas emissions, and potential indoor air quality issues across different climatic regions: A critical review, Int. J. Energy Res., 2022, 46, 22386–22420 CrossRef.
- Z. Rahimi, A. Anand and S. Gautam, An overview on thermochemical conversion and potential evaluation of biofuels derived from agricultural wastes, Energy Nexus, 2022, 7, 325–332 CrossRef.
- N. Kotaiah, S. Kalpit, K. Suresh, B. Satyavathi and P. Rajarathinam, Oxygen–steam gasification of karanja press seed cake: Fixed bed experiments, ASPEN Plus process model development and benchmarking with saw dust, rice husk and sunflower husk, J. Environ. Chem. Eng., 2018, 6, 3061–3069 CrossRef.
- A. Anand, S. Gautam and L. C. Ram, Feedstock and pyrolysis conditions affect suitability of biochar for various sustainable energy and environmental applications, J. Anal. Appl. Pyrolysis, 2023, 103, 170–181 Search PubMed.
- S. Verma, R. Masto, S. Gautam, D. Choudhury, L. Ram and S. Maity, Investigations on PAHs and trace elements in coal and its combustion residues from a power plant, Fuel, 2015, 162, 138–147 CrossRef CAS.
- Q. Wang, M. Wang, H. Wang, J. Kong, W. Xie, J. Wang, L. Chang and W. Bao, Effect of temperature and gasification gas from char on the reactions of volatiles generated from rapid pyrolysis of a low rank coal, Fuel Process. Technol., 2021, 212, 106601 CrossRef CAS.
- J. Yue, Y. Zhao, Y. Sheng, H. Cao and H. Wen, Simultaneous optimization of structure and operation for coking wastewater biological treatment process, Ind. Eng. Chem. Res., 2020, 59, 5022–5031 CrossRef CAS.
- X. Liu, X. Yu, L. Sha, Y. Wang, Z. Zhou and S. Zhang, The preparation of black titanium oxide nanoarray via coking fluorinated wastewater and application on coking wastewater treatment, Chemosphere, 2020, 270, 128609 CrossRef PubMed.
- S. Saleh, S. Soheyla, R. Gholam and D. Farshad, Phenol biodegradation by immobilized Rhodococcus qingshengii isolated from coking effluent on Na-alginate and magnetic chitosan-alginate nanocomposite, J. Environ. Manage., 2022, 307, 114586 CrossRef PubMed.
- S. Wang, W. An, J. Lu, L. Liu, J. Hu, Y. Liang and W. Cui, A Cu/CuFe2O4-OVs two-electron centre-based synergistic photocatalysis-Fenton system for efficient degradation of organic pollutants, Chem. Eng. J., 2022, 441, 135944 CrossRef CAS.
- C. Na, Y. Zhang, X. Quan, S. Chen, W. Liu and Y. Zhang, Evaluation of the detoxi-fication efficiencies of coking wastewater treated by combined anaerobic–anoxic–oxic (A2O) and advanced oxidation process, J. Hazard. Mater., 2017, 338, 186–193 CrossRef CAS PubMed.
- O. Malik, A. Hsu, L. Johnson and A. Sherbinin, A global indicator of wastewater treatment to inform the Sustainable Development Goals (SDGs), Environ. Sci. Policy, 2015, 48, 172–185 CrossRef.
- Y. Dmytro, Utilization of phosphogypsum in phenol removal from coking wastewater, J. Hazard. Mater. Lett., 2023, 4, 100089 CrossRef.
- Z. Wu, W. Zhu, Y. Liu, L. Zhou, P. Liu and J. Xu, An integrated biological-electrocatalytic process for highly-efficient treatment of coking wastewater, Bioresour. Technol., 2021, 339, 125584 CrossRef CAS PubMed.
- H. Fan, F. Wang, J. Ma, E. Li, X. Zhou, Y. Zhang and H. Chu, Field-scale zero liquid discharge of coking wastewater-Operating efficiency and environmental impact, J. Cleaner Prod., 2023, 424, 138736 CrossRef CAS.
- C. Wang, W. Wang, W. Deng, S. Zhang, S. Shao, M. Wen, G. Li and T. An, Distribution characteristics, air-water exchange, ozone formation potential and health risk assessments of VOCs emitted from typical coking wastewater treatment process, Sci. Total Environ., 2023, 862, 160845 CrossRef CAS PubMed.
- K. Ankita, C. Lubhan and K. Balvir, Leveraging microorganisms for phenol and cyanide degradation in coke oven industry effluent treatment: Current advances and future potential, Bioresour. Technol. Rep., 2023, 23, 101586 CrossRef.
- Z. Li, X. Zhang, Z. Jiang, L. Wu and N. Lai, Bi-objective optimization and thermal economy analysis of a novel coke quenching process with wastewater gasification, Appl. Therm. Eng., 2023, 219, 119473 CrossRef.
- Y. Geng, J. Bai, Y. Liu, X. Zhong, C. Li, Y. Liu, Z. Zhang and Y. Zhang, Catalysis and degradation of phenol in coking wastewater during low-rank coal coke gasification, React. Chem. Eng., 2021, 6, 629–639 RSC.
- J. Yu, Q. Guo, L. Ding, Y. Gong and G. Yu, Study on the effect of inherent AAEM on char structure evolution during coal pyrolysis by in-situ Raman and TG, Fuel, 2021, 292, 120406 CrossRef CAS.
- M. Liu, Q. He, J. Bai, J. Yu, L. Kong, Z. Bai, H. Li, C. He, X. Cao, Z. Ge and W. Li, Char reactivity and kinetics based on the dynamic char structure during gasification by CO2, Fuel Process. Technol., 2021, 211, 10683 CrossRef.
- Y. Zhao, Y. Sun, S. Liu, Z. Chen and Y. Liang, Pore structure characterization of coal by synchrotron radiation nano-CT, Fuel, 2018, 215, 102–110 CrossRef CAS.
- B. Wang, W. Li, C. Ma, W. Yang, P. Deepak, G. Rajender and L. Sun, Synergistic effect on the co-gasification of petroleum coke and carbon-based feedstocks: A state-of-the-art review, J. Energy Inst., 2022, 102, 1–13 CrossRef CAS.
- S. Zhang, W. Hu, X. Xiang, H. Xu, Z. Shen, Y. Liu, Q. Xia, Z. Ge, Y. Wang and X. Li, Ni-Fe-Ce hydrotalcite-derived structured reactor as catalyst for efficient steam reforming of toluene, Fuel Process. Technol., 2022, 226, 107077 CrossRef CAS.
- M. Liu, Q. He, J. Bai, J. Yu, L. Kong, Z. Bai, H. Li, C. He, X. Cao, Z. Ge and W. Li, Char reactivity and kinetics based on the dynamic char structure during gasification by CO2, Fuel Process. Technol., 2021, 211, 10683 CrossRef.
- M. Gao, P. Lv, Z. Yang, Y. Bai, F. Li and K. Xie, Effects of Ca/Na compounds on coal gasification reactivity and char characteristics in H2O/CO2 mixtures, Fuel, 2017, 206, 107–116 CrossRef CAS.
- Y. Geng, J. Bai, X. Zhong, Y. Liu, Z. Zhang and X. Chen, Promoting characteristics and mechanisms of phenol in coking wastewater on coke gasification, Int. J. Energy Res., 2022, 46, 18727–18739 CrossRef CAS.
| This journal is © The Royal Society of Chemistry 2024 |